Revisiting differences in the thermoresponsive behavior of PNIPAAm and PMEO2MA aqueous solutions†
Ye
Li
,
Jianhai
Yang
,
Jingqing
Li
,
Yuan
Liu
and
Wenguang
Liu
*
School of Materials Science and Engineering, Tianjin Key Laboratory of Composite and Functional Materials, Tianjin University, Tianjin 300072, PR China. E-mail: wgliu@tju.edu.cn
First published on 1st February 2012
Abstract
In this work, we synthesized PNIPAAm and poly[2-(2-methoxyethoxy)ethyl methacrylate] (PEG analogue) with a similar degree of polymerization by ATRP. Their thermoresponsive behaviors in aqueous solution were inspected with phase diagrams, rheological properties and static/time resolved fluorescence analyses. We found that the gelation capability of the PNIPAAm solution was far superior to the PMEO2MA solution due to more pronounced physical interactions between PNIPAAm chains, whereas for PMEO2MA, weak intermolecular interactions fail to result in gelling in the selected concentration range during heating. This distinct property suggests that the PNIPAAm solution will be more suitable for use as an injectable embolic or drug loading material; while thermoresponsive PEG analogues can be a beneficial supplement or even alternative to PNIPAAm in non-thermogelling applications.
Thermosensitve polymers have gained considerable attention due to their theoretical and practical significance, in particular as promising materials for potential applications such as smart drug delivery, tunable bioadhesion and tissue engineering.1–3 Among the thermoresponsive polymers so far developed, poly(N-isopropylacrylamide) (PNIPAAm) has been the most intensively studied and can be considered as the gold standard in this area. However, PNIPAAm has inherent disadvantages, for example, it is not a bio-inert polymer since its secondary amides may adsorb proteinsvia cooperative hydrogen bonding.4 Recently, Lutz et al. reported a new type of thermoresponsive polymer of nonlinear PEG analogues containing short oligo(ethyleneglycol) side chains.5–7 Point by point comparison by turbidity measurement showed that P(MEO2MA-co-OEGMA) displayed roughly reversible heating and cooling cycles; while for PNIPAAm, a broad hysteresis was observed upon cooling in spite of sharp heating transition. They also found that the degree of polymerization (DP) had a very little influence on the lower critical solution temperature (LCST) of P(MEO2MA-co-OEGMA), whereas the chain length exerted a more evident influence on the thermal behavior of PNIPAAm.8 It seemed that the superior thermoresponsiveness revealed by turmidimetry may become a promising alternative to conventional PNIPAAm.9 We cannot help ask a question: is there still any difference in the thermoresponsive behavior of PNIPAAm and PMEO2MA aqueous solutions ?
To further differentiate the difference in thermoresponsive behavior between PNIPAAm and poly[oligo(ethyleneglycol) methacrylate], we synthesized one representative thermoresponsive nonlinear PEG analogue, poly[2-(2-methoxyethoxy)ethyl methacrylate] (PMEO2MA) (Mn = 51![[thin space (1/6-em)]](https://www.rsc.org/images/entities/char_2009.gif) 461, PDI = 1.17) and PNIPAAm (Mn = 34
461, PDI = 1.17) and PNIPAAm (Mn = 34![[thin space (1/6-em)]](https://www.rsc.org/images/entities/char_2009.gif) 249, PDI = 1.31) with a similar degree of polymerization (see the ESI†).
249, PDI = 1.31) with a similar degree of polymerization (see the ESI†).
We determined the phase diagrams of PNIPAAm and PMEO2MA solutions with varied molar concentrations by a microtube inversion method (see the ESI†). As shown in Fig. 1, with increases in the temperature or concentration, we can distinguish five regions in the phase diagram: (I) transparent solution, (II) whitish solution, (III) opaque solution, (IV) solution containing precipitate, and (V) gel. At temperatures below their respective LCSTs, both PNIPAAm and PMEO2MA solutions are transparent, indicating good solubility in water in this case (region I). When heated above their respective LCSTs, polymer solutions become whitish (region II) and turn into opaque solution gradually (region III). Further increasing temperature, some sediment appears in the PNIPAAm solution over a range spanning from 0.29 to 1.45 μmol mL−1 (region IV) due to enhanced hydrophobic interactions. While the concentration of PNIPAAm is raised up to a critical gelation concentration (CGC), 1.45 μmol mL−1, a gelation behavior is observed at an elevated temperature (region V, Fig. 1A,C). Comparatively, the PMEO2MA solution starts to precipitate at a higher concentration, 0.58 μmol mL−1. Far different from PNIPAAm, the PMEO2MA solution cannot gel, but only becomes a milk-like liquid even at high concentrations (Fig. 1B) and elevated temperature (IV region, Fig. 1B,C). We also recorded the rheological properties of PNIPAAm and PMEO2MA solutions at 2.9 μmol mL−1, the highest concentration, as a function of temperature (for detailed experimental procedure, see the ESI†). As shown in Fig.2A, B, below LCST, 34 °C, the storage moduli (G'), loss moduli (G′′) and viscosity of PNIPAAm solution are very low; while temperature exceeds LCST, there is a dramatic increase of both moduli and viscosity. A distinctive feature is that G′ begins to overtake G′′, an indicator that gelling occurs.10 At 40 °C, the values of G′, G′′ and viscosity increase up to 85, 56 Pa and 81 Pa s, respectively. Further increasing temperature, syneresis of the gel leads to a decrease of moduli and viscosity. In contrast, the moduli and viscosity of PMEO2MA solution are rather low (Fig. 2C, D), and over the selected temperature range G′ never exceeds G′′, which implies that PMEO2MA solution always remains in a sol state. The above results reveal that the gelation ability of PMEO2MA is inferior to that of PNIPAAm. To unveil the underlying mechanism of the gelation behavior of PNIPAAm and PMEO2MA, we used the steady-state fluorescence spectra and fluorescence lifetime of pyrene to monitor the phase transition behavior of both PNIPAAm and PMEO2MA in aqueous solution (for detailed experimental procedure, see the ESI†).
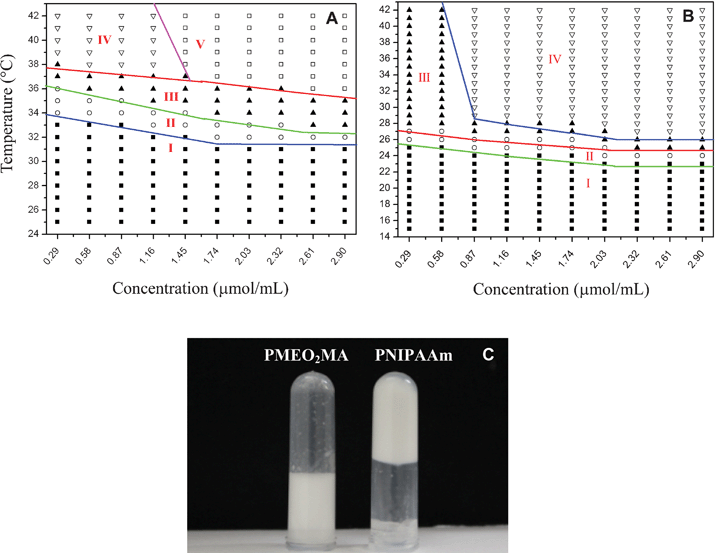 | ||
| Fig. 1 Phase diagrams of PNIPAAm (A) and PMEO2MA (B). (I) Transparent solution, (II) whitish solution, (III) opaque solution, (IV) solution containing precipitate, and (V) gel. Photographs recorded for 1.5 μmol mL−1PNIPAAm and PMEO2MA aqueous solutions at 38 °C (C). | ||
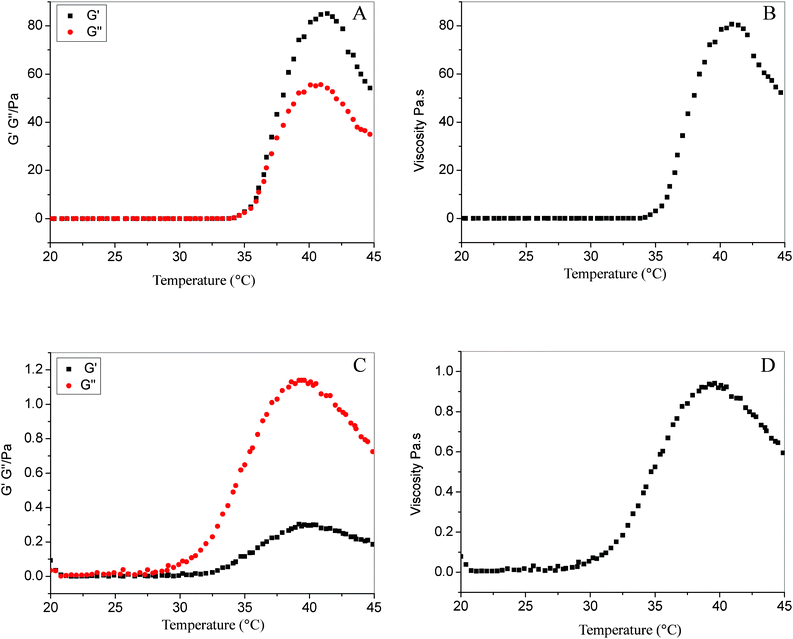 | ||
| Fig. 2 Change in storage moduli (G′), loss moduli (G′′) and viscosity with increasing temperature for 2.9 μmol mL−1PNIPAAm (A, B) and PMEO2MA (C, D) solutions. | ||
It is well documented that the emission spectrum of pyrene is sensitive to the polarity of its surroundings.11–14 In this study, we recorded the fluorescence emission spectra of pyrene (10−6 M) dispersed in PNIPAAm or PMEO2MA solutions with varied concentrations at 15 °C. The intensity ratios (I1/I3) of the first to the third bands estimated for PNIPAAm and PMEO2MA are shown in Fig. 3. In the case of PNIPAAm, the ratios remain constant over the entire polymer concentration range, a behavior similar to that in water.15,16 It suggests that the media where pyrene is dispersed is polar. Whereas for PMEO2MA solutions, when the concentration is above 1 × 10⁻³ μmol ml−1, the I1/I3 ratios start to decrease remarkably, indicating that the pyrene dispersed in PMEO2MA solutions is transferred from a polar into a less polar microenvironment as polymer concentration is enhanced.17 From its lower I1/I3 ratio, we speculate that pyrene probes are well separated by hydrophobic microdomains of PMEO2MA, thereby lowering the probability of encounter.
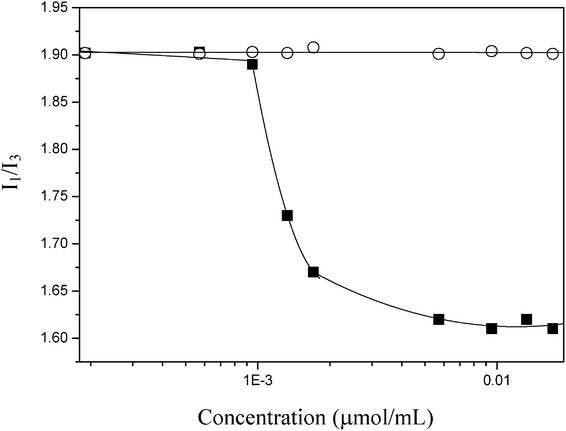 | ||
| Fig. 3 Dependence of I1/I3 ratio of pyrene (10−6 M) on the polymer concentration of PNIPAAm (○) and PMEO2MA (■). | ||
The temperature dependence of the ratio I1/I3 was also monitored for solutions of PNIPAAm and PMEO2MA. As seen in Fig. 4A, there is a dramatic decrease of the ratio I1/I3 across the phase transition of PNIPAAm. This reflects that the pyrene probes become soluble within the hydrophobic microdomains formed by the collapse of polymer chains due to the dehydration of macromolecular chains.18,19 However, the ratio I1/I3 decreases only slightly for PMEO2MA (Fig. 4B). This mild reduction suggests that the polarity of PMEO2MA solution does not change too much across the phase transition. A close inspection of I1/I3 ratios reveals that above their respective LCSTs, the I1/I3 values of PNIPAAm are lower than those of PMEO2MA at the same molarity, implying that the hydrophobic microdomains formed in PNIPAAm solutions are more hydrophobic than PMEO2MA.
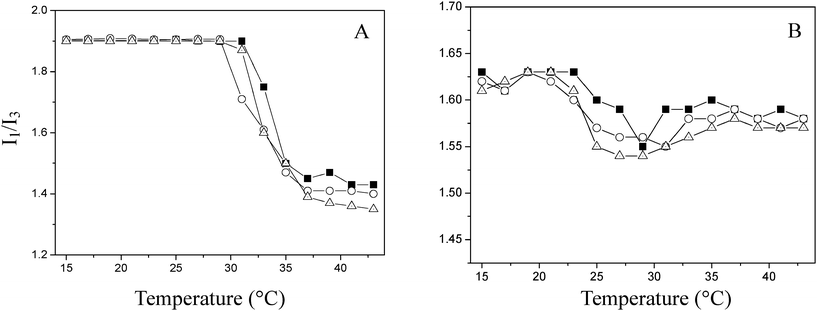 | ||
| Fig. 4 Changes in the ratio I1/I3 for pyrene in solutions of PNIPAAm (A) and PMEO2MA (B) (■: 1.45 × 10⁻² μmol mL−1; ○: 2.9 × 10⁻² μmol mL−1; △: 5.8 × 10⁻² μmol mL−1) as a function of temperature. | ||
The spectroscopic data serve as a measure of the polarity averaged over all solubilization sites. But it cannot provide site-specific information, unless the location of pyrene is known. Fluorescence lifetime measurements can be used to detect more information on the hydrophilicity/hydrophobicity of water-soluble polymers.16Fig. 5 shows the fluorescence lifetime of pyrene in PNIPAAm and PMEO2MA solutions as a function of temperature.
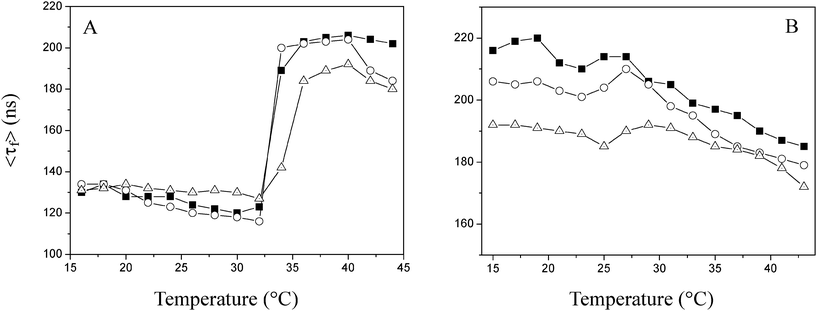 | ||
| Fig. 5 Fluorescence lifetime of pyrene dispersed in solutions of PNIPAAm (A) and PMEO2MA (B) (■: 5.8 × 10⁻² μmol mL−1; ○: 2.9 × 10⁻² μmol mL−1; △: 1.45 × 10⁻² μmol mL−1). | ||
As seen in the figure, below the respective LCSTs of each PNIPAAm solution, the average lifetime, <τf> of pyrene is similar to that of pyrene in water (120∼140 ns).15 In the range of temperatures below the LCST, hydrogen bonding exists between amide groups and water, which renders PNIPAAm macromolecular chains soluble in water. While the solution is heated above the LCST, the average lifetime of pyrene in PNIPAAm solutions increases abruptly in the vicinity of the LCST, 34 °C as expected. A heating-induced sharp increment of <τf> implies that the H-bonds between PNIPAAm and water molecules are destroyed, and consequently, hydrophobic moieties come into contact to form more hydrophobic microdomains which solubilize a large amount of pyrene.20 At higher PNIPAAm concentration, much more physical interlocking and intermolecular hydrogen bonding between PNIPAAm chains formed can result in gelling of solution, as observed in Fig. 1.
Fig. 5B displays the lifetime data of pyrene dispersed in PMEO2MA solutions. One striking feature is that <τf> of pyrene in PMEO2MA solution is much longer than that of pyrene in water between 15 and 45 °C. The lifetime data imply that the solution of PMEO2MA is more hydrophobic than the pure water phase. Even if the temperature is far below the LCST, PMEO2MA solutions are capable of solubilizing pyrene. Similar to PNIPAAm solutions, there exists hydrogen bonding formed between polymers and water at low temperature. However, this effect is counter-balanced by the hydrophobicity of the apolar backbone.5 In addition, the ester bonds on the side chains of PMEO2MA also contribute to the hydrophobicity due to the insufficient hydrophilicity from the short hydrophilic (methoxyethoxy)ethyl chains. As a consequence, there are already apolar microdomains which are hydrophobic enough to solubilize pyrene prior to the occurrence of the phase transition. From Fig. 5, we can also find that the lifetime data undergo a marginal increase around the transition temperature, 25 °C, suggesting that only a mild decrease in the polarity of the PMEO2MA occurs above the LCST. Although polymer–polymer interactions start to dominate in the solutions of PMEO2MA as the temperature is heated above the LCST, and the association of hydrophobic groups results in the collapse of macromolecular chains, simultaneously involving a dehydration process, a large amount of hydrogen bonding between PMEO2MA and water molecules may be retained based on the variation in polarity probed by pyrene (Fig. 5B). Additionally, the collapse of PMEO2MA chains brings about more close contact of polar ether oxygen at side chain, which could offset the loss of water molecules.5 For PMEO2MA, there are no intermolecular H-bonding acceptors and donors. Thus, the polymer–polymer interactions are too weak to form a strong physically crosslinked gel upon the phase transition as shown in Fig. 1.
In conclusion, the phase diagram, rheological test and fluorescence analyses demonstrate that in the respect of gelling ability, PNIPAAm is far superior to PMEO2MA due to more physical interlocking and intermolecular hydrogen between PNIPAAm chains, whereas for PMEO2MA, weak intermolecular interactions cannot lead to gelling upon the heating-induced phase transition. These results suggest that we can make use of thermogelling ability of PNIPAAm solution to design biomaterials for embolization or drug encapsulation and so on, whereas in non-thermogelling applications, PMEO2MA is most like to act as a beneficial supplement or even an alternative to PNIPAAm.
Acknowledgements
The authors gratefully acknowledge the support for this work from the National Natural Science Foundation of China (Grants 50973082).References
- B. S. Murray, A. W. Jackson, C. S. Mahon and D. A. Fulton, Chem. Commun., 2010, 46, 8651–8653 RSC.
- M. A. C. Stuart, W. T. S. Huck, J. Genzer, M. Müller, C. Ober, M. Stamm, G. B. Sukhorukov, I. Szleifer, V. V. Tsukruk, M. Urban, F. Winnik, S. Zauscher, I. Luzinov and S. Minko, Nat. Mater., 2010, 9, 101–113 CrossRef.
- G. V. Martins, J. F. Mano and N. M. Alves, Langmuir, 2011, 27, 8415–8423 CrossRef CAS.
- E. Wischerhoff, K. Uhlig, A. Lankenau, H. G. Börner, A. Laschewsky, C. Duschl and J. F. Lutz, Angew. Chem., Int. Ed., 2008, 47, 5666–5668 CrossRef CAS.
- J. F. Lutz, K. Weichenhan, Ö. Akdemir and A. Hoth, Macromolecules, 2007, 40, 2503–2508 CrossRef CAS.
- J. F. Lutz and A. Hoth, Macromolecules, 2006, 39, 893–896 CrossRef CAS.
- J. F. Lutz, J. Andrieu, S. Üzgün, C. Rudolph and S. Agarwal, Macromolecules, 2007, 40, 8540–8543 CrossRef CAS.
- J. F. Lutz, Ö. Akdemir and A. Hoth, J. Am. Chem. Soc., 2006, 128, 13046–13047 CrossRef CAS.
- J. H. Yang, P. Zhang, L. Tang, P. Sun, W. G. Liu, P. Sun, A. J. Zuo and D. C. Liang, Biomaterials, 2010, 31, 144–155 CrossRef CAS.
- M. Tizzotti, C. Creuzet, M. P. Labeau, T. Hamaide, F. Boisson, E. Drockenmuller, A. Charlot and E. Fleury, Macromolecules, 2010, 43, 6843–6852 CrossRef CAS.
- K. Kalyanasundaram and J. K. Thomas, J. Am. Chem. Soc., 1977, 99, 2039–2044 CrossRef CAS.
- H. Ringsdorf, J. Venzmer and F. M. Winnik, Macromolecules, 1991, 24, 1678–1686 CrossRef CAS.
- E. M. S. Castanheira and J. M. G. Martinho, Chem. Phys. Lett., 1993, 206, 45–48 CrossRef CAS.
- T. Costa, J. S. S. Melo, C. S. Castro, S. Gago, M. Pillinger and I. S. Goncalves, J. Phys. Chem. B, 2010, 114, 12439–12447 CrossRef CAS.
- N. J. Flint, S. Gardebrecht and L. Swanson, J. Fluoresc., 1998, 8, 343–353 CrossRef CAS.
- H. Ringsdorf, J. Venzmer and F. M. Winnik, Macromolecules, 1991, 24, 1678–1686 CrossRef CAS.
- H. Faes and F. C. De Schryver, Macromolecules, 1996, 29, 3875–3880 CrossRef CAS.
- J. E. Chung, M. Yokoyama, T. Aoyagi, Y. Sakurai and T. Okano, J. Controlled Release, 1998, 53, 119–130 CrossRef CAS.
- C. K. Chee, S. Rimmer, D. A. Shaw, I. Soutar and L. Swanson, Macromolecules, 2001, 34, 7544–7549 CrossRef CAS.
- C. K. Chee, S. Rimmer, I. Soutar and L. Swanson, Polym. Int., 2006, 55, 740–748 CrossRef CAS.
Footnote |
| † Electronic supplementary information (ESI) available. See DOI: 10.1039/c2ra01208a |
| This journal is © The Royal Society of Chemistry 2012 |
