The development of affinity capture devices—a nanoscale purification platform for biological in situtransmission electron microscopy
Katherine
Degen
a,
Madeline
Dukes
b,
Justin R.
Tanner
c and
Deborah F.
Kelly
*c
aDepartment of Biomedical Engineering, University of Virginia, Charlottesville, VA, U. S. A.
bApplications Science, Protochips, Inc., Raleigh, NC, U. S. A.
cVirginia Tech Carilion Research Institute, 2 Riverside Circle, Roanoke, VA, U. S. A. E-mail: debkelly@vt.edu; Fax: 01 540 985 3373; Tel: 01 540 526 2031
First published on 1st February 2012
Abstract
The use of in situtransmission electron microscopy (TEM) to study biological processes is a new frontier in high-resolution imaging. Here we report the development of affinity capture devices that are used to isolate biological entities for in situ studies. Affinity capture devices are silicon nitride microchips coated with functionalized lipid monolayers. We tested the isolation capacity of the devices by using protein synthesis machinery as a test specimen for single particle and in situTEM analysis. Overall, we demonstrate the feasibility of purifying biological assemblies in a liquid environment within a TEM column. This novel application may serve to bridge the gap between cellular and molecular imaging techniques.
Introduction
The purification of biological complexes remains the rate-limiting step for structural studies in the electron microscopy (EM) field.1 One key issue is that macromolecular assemblies need to be rapidly removed from other cellular contaminants while maintaining their native functionality. Classical biochemistry techniques rely upon lengthy chromatographic or gradient separations and require large amounts of starting material. Often, weakly associated subunits of multi-component assemblies readily dissociate during purification.To address these issues, we have recently developed the affinity grid approach. Affinity grids are carbon coated EM grids containing functionalized monolayers doped with Ni–NTA (nickel–nitrilotriacetic acid) lipids (Avanti Polar Lipids, Alabaster, Alabama).2 Affinity grids mimic a Nickel–NTA affinity column to purify proteins carrying a continuous stretch of histidine residues (His tag).3 His-tagged proteins bind with high affinity to Ni–NTA matrices.4 Moreover, affinity grids differ from conventional column separations in that they require only nanogram quantities of starting material and they can purify protein complexes in less than 5 min.2
New materials, such as silicon nitride5 and graphene,6 have been introduced as alternatives to traditional carbon substrates to coat metal EM grids. Recently developed liquid-flow sample holders used for in situTEM utilize silicon nitride membranes as windows for their flow-cell chamber.7 Therefore, we aimed to adapt our nanoscale protein purification system to work with silicon nitride surfaces.
Here we present a novel expansion of our affinity capture technology. We demonstrate the use of functionalized semiconductor devices to purify active protein machinery for structural studies and in situ imaging. This new application for silicon nitride membranes gives rise to EM affinity capture devices. These devices can be used as the flow-cell windows for commercial in situTEM sample holders. Utilizing this platform we were able to capture tagged macromolecules of interest while viewing them in a liquid-flow environment within a TEM column. Additionally, our new application maintains a rapid purification component with high specificity and nanogram sensitivity. The method also lends itself for use with antibodies against cell surface proteins to isolate whole cells. The isolation of rare cells or cancer cells may be possible in combination with TEM imaging. This opens a new avenue for the visual screening of therapeutic interventions aimed at multiscale imaging—from the molecular to the cellular levels. Overall, the use of affinity capture devices and live TEM imaging provide a unique platform to view active biological processes at nanometer resolution.
Results and discussion
The functionalization of silicon nitride devices
Affinity capture devices were developed using custom designed silicon nitride microchips having dimensions of 2.60 mm × 2.00 mm (Fig. 1a). The devices contain a central 50 nm thick window that is 500 μm × 50 μm and allows the electron beam to penetrate the chip for imaging purposes (Fig. 1b).7 These microchips are commercially available from Protochips, Inc., (Raleigh, NC) at http://www.protochips.com/products/durasin.html.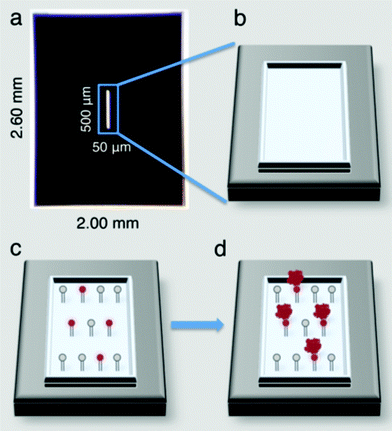 | ||
| Fig. 1 Affinity capture devices produced on commercial silicon nitride microchips (a) contain viewing windows (b) that allow an EM beam to penetrate to the specimen level. Devices can be functionalized with lipid monolayers (c) containing Ni–NTA head groups (red circles) that bind to His-tagged protein targets (red complexes) (d). | ||
Lipid mixtures composed of 2% to 20% Ni–NTA lipids and DLPC (1,2-dilauryl-phosphatidylcholine) filler lipids (Avanti Polar Lipids, Alabaster, Alabama) were each reconstituted in chloroform (1 mg ml−1) and cast over 25 μl drops of Milli-Q water placed into wells of Teflon blocks as previously described.8 The Teflon blocks were sealed in a humid petri dish and incubated on ice for 60 min. Silicon nitride chips were heated to 150 °C for 90 min and allowed to cool to room temperature prior to incubating on top of the lipid layers for at least 1 min. The hydrophobic lipid chains interacted favourably with the silicon nitride surface and the lipid layer was effectively transferred to the chip (Fig. 1c). The chips and associated lipid layers were lifted off of the drop and used to isolate His-tagged protein targets (Fig. 1d).
The purification of macromolecules using affinity capture devices
We used His-tagged ribosomes produced in E. coli as an ideal EM specimen to test the purification capacity of our affinity capture devices. Bacterial cell lysates containing recombinant His-tagged subunits (rpl3) incorporated into 50S ribosomes were prepared in the presence of imidazole. Briefly, a His-tagged construct for a subunit of the large ribosome, rpl3 (clone MPMGp800 I10582) was purchased from RZPD (GmbH, Berlin, Germany) with the T7 promoter in the PQE30NST vector. His-tagged rpl3 was expressed in E. coli (BL21 strain) overnight at 16 °C in 200 ml of LB media containing 30 mg l−1 kanamycin and 50 mg l−1 ampicillin upon the addition of 0.5 mM IPTG at an OD600 = 0.6.
Cells containing recombinant rpl3 were harvested and centrifuged at 3500 g for 20 min at 4 °C. Cell pellets were suspended in 20 ml of lysis buffer containing 20 mM Hepes (pH, 7.5), 150 mM NaCl, and 0.2 g of lysozyme (EMD Biosciences, Inc., San Diego, CA), followed by sonication. The cell lysate was centrifuged at 17![[thin space (1/6-em)]](https://www.rsc.org/images/entities/char_2009.gif) 000 g for 20 min at 4 °C. Total protein concentration of the lysate was determined to be 3.2 mg ml−1 by absorbance measurements performed at 280 nm.
000 g for 20 min at 4 °C. Total protein concentration of the lysate was determined to be 3.2 mg ml−1 by absorbance measurements performed at 280 nm.
To test if our devices could capture macromolecules from bacterial lysates, we employed a similar approach to that of the affinity grid system. We applied 4 μl aliquots of bacterial lysate in buffer solution containing 20 mM Hepes (pH, 7.5), 150 mM NaCl, 20 mM CaCl2, 20 mM MgCl2 and 60 mM imidazole to affinity capture devices and incubated the solution for 2 min at room temperature. Following incubation, excess amounts of lysate were blotted away using Whatman 1 filter paper and the chips were washed with successive drops of Milli-Q water then negatively stained using 1% uranyl formate (Electron Microscopy Sciences, Hatfield, PA).9
To test the requirement for the presence of Ni–NTA lipids in the monolayer, samples were prepared on devices using only the DLPC filler lipids. Also, to test the isolation component of the system, silicon nitride devices lacking the lipid layer were glow-discharged and incubated with the 4 μl aliquots of the same bacterial lysate, then washed and negatively stained using the same procedures. The glow-discharged devices should reveal the total contents of the bacterial lysate. We can, therefore, assess the purification power of the functionalized affinity devices by directly comparing their contents with respect to the glow-discharged samples.
EM imaging of purified complexes in a static environment
Negatively stained affinity device specimens were examined using a FEI Spirit BioTwin TEM (FEI, Hillsboro, OR) equipped with a tungsten filament and operated at an acceleration voltage of 120 kV under low-dose conditions. Images were recorded on a FEI Eagle 2k HS CCD camera with a pixel size of 30 μm at a nominal magnification of 68![[thin space (1/6-em)]](https://www.rsc.org/images/entities/char_2009.gif) 000× and a defocus value of −1.5 μm for a sampling of 4.4 Å pixel−1.
000× and a defocus value of −1.5 μm for a sampling of 4.4 Å pixel−1.
We determined the optimum working concentration of the lysate solution to be between 0.2 to 0.01 mg ml−1. Lysate samples containing a total protein concentration above 0.2 mg ml−1 recruited an excess of ribosomal complexes onto our affinity capture devices and were not useful for image processing routines. Samples prepared with a total protein concentration below 0.01 mg ml−1 did not recruit enough particles per image for reasonable processing routines. On average, we estimated ∼10 ng of ribosomes were recruited per device using 4 μl aliquots of lysate solution (0.2 mg ml−1). Thus, our system exhibits nanogram-level sensitivity with an estimated detection limit of ∼2.5 ng μl−1 per device. The incorporation of imidazole in our buffer helped to attenuate non-specific background components from binding to the surface of our affinity capture devices.
Images of bacterial lysate samples prepared on affinity devices lacking Ni–NTA lipids did not show any complex binding (Fig. 2a). This supports the idea that the Ni–NTA lipids are required in the lipid layer to bind to His-tagged complexes in our sample. In contrast, lysate samples prepared on glow-discharged silicon nitride microchips lacking the lipid monolayer contained an excess of proteins that randomly represent the total cell contents of the bacteria (Fig. 2b). A minimal level of ribosomal complexes can be identified in the lysate sample (white circles, Fig. 2b). Images of lysate samples prepared on affinity capture devices decorated with 2% Ni–NTA lipid monolayers showed protein complexes with features and dimensions (25 – 30 nm) consistent with that of bacterial 50S ribosomes (white circles, Fig. 2c). Considering that aliquots from the same bacterial lysates were added to each device and we see a more concentrated, homogeneous population of complexes when the Ni–NTA monolayer coating is present (compare Fig. 2c with Fig. 2b) supports our claim that we are specifically purifying tagged complexes onto affinity capture devices.
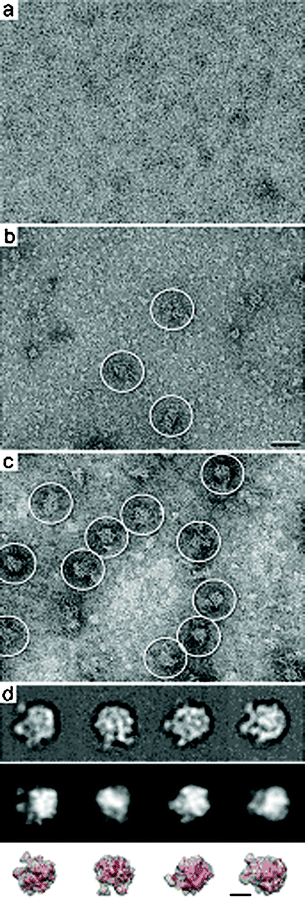 | ||
| Fig. 2 Images of negatively stained bacterial lysate samples applied affinity devices lacking Ni–NTA lipids in the monolayer (a) show no specific binding. (b) Glow-discharged, non-functionalized silicon nitride devices show an excess of randomly bound proteins while only a minimal number of complexes (white circles) can be identified. Scale bar is 50 nm. (c) Image of cell lysate applied to functionalized affinity capture devices show protein complexes consistent with the size and features of 50S ribosomes (white circles). (d) Representative averages of affinity captured specimens indicate the presence of 50S ribosomes (top panel). Class averages show a high correlation (> 0.8) with filtered projections of the 50S ribosome crystal structure (pdb code, 1ML5;11 middle panel). A comparison between the representative averages (top panel) and the filtered 3D volume and crystal structure of the 50S ribosome (red, bottom panel) indicate a high agreement in different orientations. Individual panels are 52 nm. Scale bar is 15 nm. | ||
We collected 300 images of samples prepared on affinity capture devices and selected 5919 individual particles from the images using the WEB interface for the SPIDER software package.10 Particles were windowed into individual image panels of 120 x 120 pixels. Using SPIDER, the selected particles were subjected to 10 cycles of multi-reference alignment. References used for the first round of alignment were randomly selected from the raw images. Each round of alignment was followed by principal component analysis and K-means classification, outputting class averages.10
Representative averages (Fig. 2d, top panel) were filtered to 20 Å resolution and cross-correlated with projections of the 50S ribosome crystal structure (pdb code, 1ML511) also filtered to the same resolution (Fig. 2d, middle panel) using the SPIDER software package. Normalized cross-correlational coefficients above 0.7 indicate an adequate match between the experimental averages and the theoretical projections.2 A comparison between the experimental averages (Fig. 2d, top panel) and the theoretical projections (Fig. 2d, middle panel) gave mathematical correlation values above 0.8. This calculation statistically quantifies the measure of structural similarities exhibited by the 50S complexes isolated on our devices with respect to their known correlates. In general, single particle EM samples have a nanogram detection limit, which is a highly sensitive means to determine the identity of bound complexes. As an additional note of validation, we compared corresponding views of the filtered 3D volume of the 50S crystal structure11 (Fig. 2d, bottom panel) with the experimental projections (Fig. 2d, top panel) and found a high degree of agreement. Taken together, these results support the finding that the affinity capture system can be successfully used with silicon nitride devices to prepare specimens suitable for TEM structural analysis.
In situ TEM imaging of captured biological specimens
The use of in situTEM to study biological processes is a new frontier in the imaging field. Until recently, there was no way to maintain biological specimens in a liquid environment while enclosing them in the high vacuum system of a TEM. The newly developed TEM liquid-flow holder7 accommodates biological samples between two semiconductor microchips that are tightly sealed together. These chips form a microfluidic device at the tip of a specimen holder that permits liquid flow in and out of the holder.To test whether affinity capture devices could be used to isolate biological macromolecules within a TEM column, affinity devices were prepared using 20% Ni–NTA lipid layers and allowed to dry overnight in a grid box at room temperature. Based on our previous results in preparing cryo-EM specimen, we anticipated a 10-fold increase in the available number of Ni–NTA functional head groups may be necessary to ensure complex binding. One functionalized affinity device and one non-functionalized device having a spacer size of 150 nm were loaded into the tip of a Poseiden flow-holder (Protochips, Inc., Raleigh, NC) designed for a JEOL 1400 TEM. The TEM, located at the Georgia Institute of Technology (Atlanta, Georgia), was equipped with a tungsten filament operating at 120 kV and a Gatan Orius SC1000 CCD camera. Images were recorded at a nominal magnification of 50![[thin space (1/6-em)]](https://www.rsc.org/images/entities/char_2009.gif) 000× to 100
000× to 100![[thin space (1/6-em)]](https://www.rsc.org/images/entities/char_2009.gif) 000× using a defocus value of approximately −3 μm.
000× using a defocus value of approximately −3 μm.
A 500 μl aliquot of the same lysate sample that was used for single particle analysis was loaded into the specimen flow-holder using a step-motor pumping system that regulated the solution flow rate to be 300 μl h−1. We acquired images of the affinity capture devices before the lysate solution entered the imaging window of the holder as well as an initial time point before complex binding occurred (Fig. 3a). No notable complexes were present at the initial time point of solution flow. As the lysate solution containing tagged complexes flowed over the affinity device, we observed an optimal level of decoration (Fig. 3b) within 5 min that became saturated shortly thereafter (Fig. 3c) due to the excess of Ni–NTA lipid used in comparison to the negatively stained specimens. This suggests that dynamic capture events could potentially be modulated at the level of Ni–NTA incorporation during the functionalization step. A magnified view of the affinity device (100![[thin space (1/6-em)]](https://www.rsc.org/images/entities/char_2009.gif) 000×) shows complexes with the dimensions consistent with 50S ribosomes (Fig. 3d).
000×) shows complexes with the dimensions consistent with 50S ribosomes (Fig. 3d).
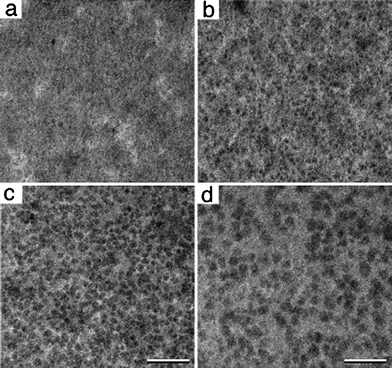 | ||
| Fig. 3 Tagged ribosomes were captured from a bacterial lysate solution and imaged in an in situ flow holder within a TEM column. (a) Upon the initial flow of lysate solution into the imaging window, no notable ribosomal complexes adhered to the capture device (50 k×). (b) Tagged complexes bound to the functionalized affinity capture devices as they flowed inside the holder until the field of view became saturated with particles (c). Scale bar is 200 nm. (d) Higher magnified view (100 k×) of the complexes bound to the affinity device showed dimensions consistent with 50S ribosome complexes. Scale bar is 100 nm. | ||
In general as we imaged many different areas within the transparent viewing window of the affinity devices, we noted a consistent binding pattern as complexes in the lysate solution flowed across the device and accumulated. The characteristic nature of the dynamic binding events typically included: 1) minimal to no particles binding; 2) optimal binding; 3) saturation of bound complexes and 4) oversaturation. Differing combinations of these steps can be visualized within a single imaged area (Fig. 4). After particle binding was completed, buffer solution could flow into the holder with no appreciable reduction in the number of complexes bound to the functionalized affinity device.
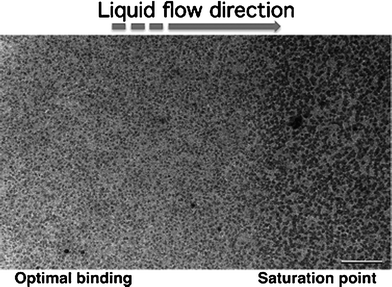 | ||
| Fig. 4 A dynamic population of tagged 50S ribosomal complexes were captured upon affinity devices. Images across many regions showed a disparate number of 50S particles bound to the functionalized devices. | ||
We speculate that bound complexes could be further diluted in the flow holder by increasing the concentration of imidazole in the flowing sample buffer. Overall, complex binding events could be influenced by the initial number of tagged macromolecules present in the lysate, by the solution flow rate or by the amount of Ni–NTA lipids used to coat the silicon nitride devices. These observations are consistent with our previous work in the development of affinity grids.2 Therein, we noted that an increase in the amount of Ni–NTA lipids used in the production of EM affinity grids corresponded with an increase in the number of particles bound to the functionalized grid.
To test the potential use of affinity capture devices to recruit cells for in situ imaging experiments, we used HEK 293T cells and a series of adaptor proteins. His-tagged Protein A and monoclonal antibodies (IgGs) against the Notch receptor were purchased from Abcam (Cambridge, MA). HEK 293T cells were grown to confluency in Dulbecco's modified Eagle's medium and mechanically dislodged from the culture dish with the tip of a pipette. Affinity capture devices containing 2% Ni–NTA monolayers were prepared and coated with 0.05 mg ml−1 of His-tagged Protein A for 1 min at room temperature. Subsequently, antibodies (0.1 mg ml−1 in 20 mM Hepes (pH, 7.5), 150 mM NaCl, 20 mM CaCl2, 20 mM MgCl2 and 60 mM imidazole) were added to the devices coated with Protein A and incubated for 1 min. Cells contained in conditioned media were added to the devices and incubated on the decorated devices for 2 min. Specimens were then washed and negatively stained. A schematic representation of an affinity capture device with tethered cells is given in Fig. 5a.
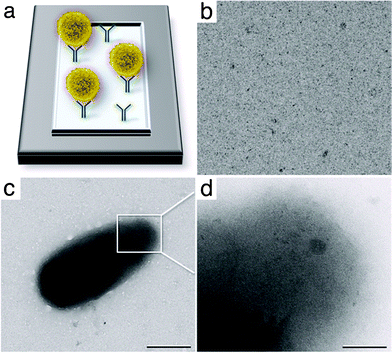 | ||
| Fig. 5 (a) Schematic to indicate how cells (yellow) may be recruited to functionalized affinity capture devices containing His-tagged protein A and antibodies (IgGs, blue) against cell surface receptors. (b) Affinity devices lacking IgGs fail to recruit cells. (c) Image of HEK 293T cell isolated onto an affinity device. Scale bar is 0.5 μm. (d) Image taken on the curved edge of the cell surface shows visible features within the cell. Scale bar is 0.1 μm. | ||
As a negative control, Ni–NTA containing affinity devices were prepared and coated with His-tagged Protein A but not IgG antibodies. 293T cells were added to the devices and incubated for up to 5 min at room temperature. Using TEM, no cells were identified on any of the devices (Fig. 5b). This finding supports the necessity for the use of antibodies to bind to receptors on the cells' surfaces. Upon the addition of IgG to protein A coated microchips, cells were recruited to the affinity capture devices and could be imaged using TEM (Fig. 5c). Images taken at approximately 9000× magnification allowed us to confirm the presence of whole cells on our devices. At higher magnification (50![[thin space (1/6-em)]](https://www.rsc.org/images/entities/char_2009.gif) 000×) we could begin to discern the presence of internal complexities (Fig. 5d). In order to fully explore any underlying cellular architectures, cells with a thickness of < 2 microns should be used in conjunction with a TEM operating at higher voltages. Overall, we anticipate affinity capture devices would be able to recruit cells in an in situ environment, similar to our purification experiments performed on 50S ribosomes. We are currently focusing our work in this direction.
000×) we could begin to discern the presence of internal complexities (Fig. 5d). In order to fully explore any underlying cellular architectures, cells with a thickness of < 2 microns should be used in conjunction with a TEM operating at higher voltages. Overall, we anticipate affinity capture devices would be able to recruit cells in an in situ environment, similar to our purification experiments performed on 50S ribosomes. We are currently focusing our work in this direction.
Conclusions
Here we present the necessary steps for producing functionalized silicon nitride surfaces for EM analysis. These functionalized microchips, that we have named affinity capture devices, can be used to isolate protein complexes for single particle EM structural studies. Samples may be examined in a static environment by embedding the biological material in heavy metal salts, such as uranyl formate, or in a dynamic liquid environment using a TEM flow-holder.With the recent success of in situTEM experiments5, the potential exists for the use of affinity capture devices to view biological processes in a liquid environment. One limitation in viewing reactions, however, may be attributed to electron beam damage. Low-dose imaging conditions help to minimize this damage while examining biological specimens. In addition, the slow but steady flow of liquid within the microfluidic specimen chamber may also help to reduce damage to beam-sensitive samples. Overall, we anticipate that affinity capture devices can be used to observe dynamic interactions with in situ imaging just as affinity grids can be used to prepare single particle specimens for cryo-EM. Furthermore, our work shows the first images of macromolecular complexes being isolated in a liquid environment while fully enclosed in an EM column.
Multiscale applications for affinity capture approaches
At the molecular level, we demonstrate the use of affinity capture devices to isolate biological assemblies for single particle imaging. This approach may soon allow us to view molecular events in real-time. At the intermediate scale of view, receptors or antibodies may be added to affinity capture devices while viruses or other infectious agents are flowed, captured and imaged. At the cellular level, antibodies against cell surface markers can be bound specifically to affinity devices and used to isolate rare cells types including stem cells and cancer cells. It may also be possible to perform single cell experiments with broad scientific applications on a single device. Therefore, the use of affinity capture devices may permit biologists to observe real-time events from the structural level to the cellular scale in a near-native, liquid environment. Overall, these new molecular tools will undoubtedly enable us to view biological processes in a remarkable new way.Acknowledgements
We would like to acknowledge Stephen Mick for his advice and support of our work.References
- D. F. Kelly, D. Dukovski and T. Walz, Methods Enzymol., 2010, 481, 83–107 CAS
.
- D. F. Kelly, P. D. Abeyrathne, D. Dukovski and T. Walz, J. Mol. Biol., 2008, 382, 423–433 CrossRef CAS
.
- R. Janknecht, G. de Maryynoff, J. Lou, R. A. Hipskind, A. Nordheim and H. G. Stunnenberg, Proc. Natl. Acad. Sci. U. S. A., 1991, 88, 8972–8976 CrossRef CAS
.
- J. Schmitt, H. Hess and H. G. Stunnenberg, Mol. Biol. Rep., 1993, 18, 223–230 CrossRef CAS
.
- D. B. Peckys and N. de Jonge, Nano Lett., 2011, 11, 1733–1738 CrossRef CAS
.
- S. Chen, W. Cai, R. D. Piner, J. W. Suk, Y. Wu, Y. Ren, J. Kang and R. S. Ruoff, Nano Lett., 2011, 11, 3519–3525 CrossRef CAS
.
- E. A. Ring and N. de Jonge, Microsc. Microanal., 2010, 16, 622–629 CrossRef CAS
.
- D. F. Kelly, D. Dukovski and T. Walz, Proc. Natl. Acad. Sci. U. S. A., 2008, 105, 4703–4708 CrossRef CAS
.
- M. Ohi, Y. Li, Y. Cheng and T. Walz, Biol. Proced. Online, 2004, 6, 23–34 CrossRef CAS
.
- J. Frank, M. Rademacher, P. Penczek, J. Zhu, Y. Li, M. Ladjadj and A. Leith, J. Struct. Biol., 1996, 116, 190–199 CrossRef CAS
.
- B.P. Klaholz, T. Pape, A. V. Zavialov, A. G. Myasnikov, E. V. Orlova, B. Vestergaard, M. Ehrenberg and M. van Heel, Nature, 2003, 421, 90–94 CrossRef CAS
.
| This journal is © The Royal Society of Chemistry 2012 |
