Photon frequency management for trapping & concentration of sunlight
Tom
Markvart
*,
Lefteris
Danos
,
Liping
Fang
,
Thomas
Parel
and
Nazila
Soleimani
Solar Energy Laboratory, Engineering Sciences, University of Southampton, Southampton, SO17 1BJ, UK. E-mail: tm3@soton.ac.uk
First published on 30th January 2012
Abstract
This paper considers a range of techniques which – within the realm of classical optics – can be used to enhance light capture as a first step in photovoltaic energy conversion. Examples include a simple case of downshifting, fluorescent collectors which reduce the size of a light beam, and a novel form of light trapping to increase the path length of light within the solar cell. The results are discussed using a thermodynamic framework where the energy exchange with an absorbing/fluorescent medium allows the entropy of the captured photon gas to be lowered, reducing the étendue of the emitted beam. We show that frequency management represents a powerful tool, allowing enhancement in light trapping above the Yablononovitch limit, leading to potentially highly efficient but very thin crystalline silicon solar cells.
1. Introduction
Techniques to manipulate sunlight for energy purposes have a long history. This rather broad topic has been the subject of extensive discussion in recent years, from a number of different standpoints.1 In this paper we restrict our sights on techniques which lie within the realm of ray optics, with emphasis on photon frequency management with the aim of reducing the size of the beam, increasing the path length of light or otherwise improving the collection efficiency of photo-generated electron-hole pairs.Examples that depict several approaches are shown in Fig. 1. Concentration of light by mirrors or lenses is probably the most popular example of light management (Fig. 1a). The term concentration rather than focusing of light is used here on purpose as there is no need to produce an image of the sun.5 The ultimate aim, of course, is to collect light from a large area to deliver photon flux to a smaller solar cell for conversion to electricity. These systems can only concentrate the direct beam; hence, most of the diffuse radiation is unused and a mechanism is needed to move the array and track the sun.
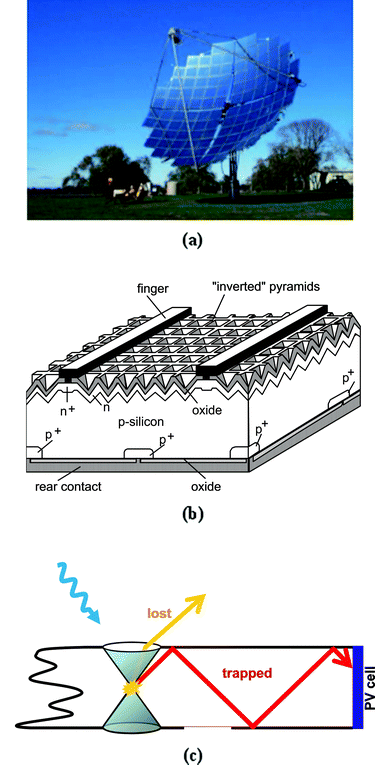 | ||
| Fig. 1 Examples of light management to improve light collection in PV conversion. (a) A parabolic concentrator;2 (b) UNSW PERL cell where light is trapped by top surface texturing;3 (c) A schematic of fluorescent collector.4 | ||
A different way to reduce the amount of photovoltaic material is to trap the incident light inside the solar cell. A textured front surface not only reduces reflection but increases the path length the light travels inside the cell, enhancing absorption (Fig. 1b). Light trapping structures re-distribute ray directions by scattering (a stochastic process) but they share one common feature with geometric concentrators: they do not alter the frequency of light.
A different class of systems where photon frequency is changed forms the subject of this paper. We shall consider fluorescent collectors which, in the shape of a plate containing fluorescent dyes, guide the fluorescent light towards solar cells attached at the edge (Fig. 1c; to be discussed in more detail in Sec. 4). Fluorescent collectors can be considered as concentrator systems. We shall show in Sec. 5 that similar structures can also be used for highly effective light trapping. But we shall begin with a simple example to show how frequency change can increase the efficiency of CdTe solar cells.
2. Light capture with a frequency change: downshifting
Cadmium telluride solar cells typically contain a CdS window layer as one part of the solar cell heterostructure (Fig. 2a). Electron transport in the CdS layer is not very efficient and if this layer is thick, these solar cells are likely to show a poor spectral response at short wavelengths (Fig. 3; see, for example, ref. 8). This problem can be alleviated with the use of luminescent dyes. There is a wide range of dyes with strong absorption in this region and, since luminescence occurs towards longer wave-lengths we may be able to find a dye which emits in the region where the quantum efficiency of the CdTe solar cell is high.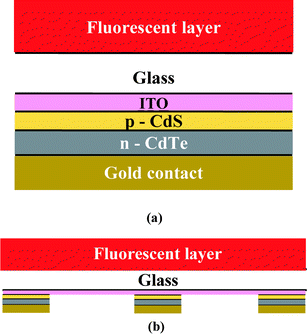 | ||
| Fig. 2 (a) Schematic of a downshifting structure for CdTe solar cells (superstrate configuration, not to scale). (b) A similar structure as a fluorescent concentrator. | ||
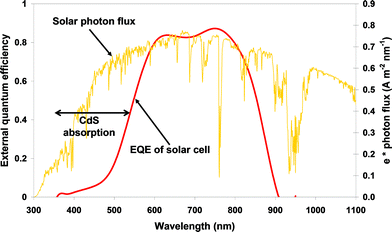 | ||
| Fig. 3 Spectral issues in CdS/CdTe solar cells. | ||
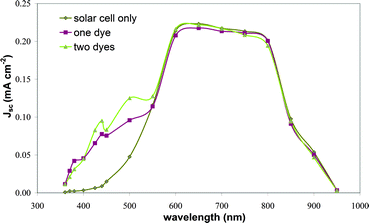
A yet more effective solution is to employ a mixture of dyes. The absorption needs to cover wavelengths between 300 and about 510 nm near the band gap of CdS but emission should occur only through the species emitting at the longest wavelength. This can be achieved through an efficient Förster excitation energy transfer between the dyes.6 The absorption and emission of one such dye combination is shown in Fig. 4b. The dyes now cover a wider part of the required wavelength range, emission is shifted towards longer wavelengths, and the overall spectral response is improved (Fig. 5).7
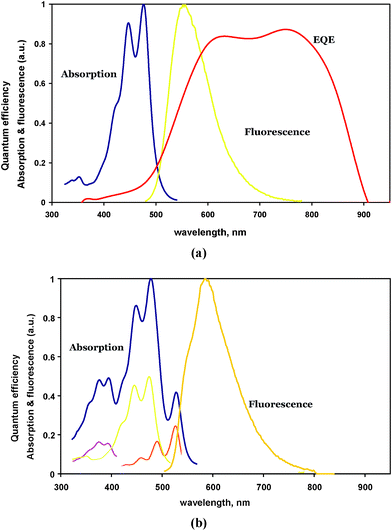 | ||
| Fig. 4 (a) A single dye absorption and fluorescence spectrum. (b) The absorption and fluorescence of a mixture of dyes with energy transfer. Note the red shift of fluorescence. | ||
 | ||
| Fig. 5 Improvement of quantum efficiency by downshifting, with and without energy transfer between two dyes. Some of these structures also act as concentrators. | ||
Homogeneous solutions, however, are not optimum structures for energy transfer. Efficient energy transfer requires a close proximity between the donor (absorber) and acceptor (emitter) dyes which is achieved most easily at high dye concentrations. These conditions also often promote self-quenching of dye fluorescence resulting in the absorbed energy being dissipated non-radiatively as heat. More efficient are structured systems where dye molecules are held in appropriate positions, for example, by protein skeletons of light harvesting units in photosynthesis, in artificial structures formed by Langmuir–Blodgett films9 or inserting dyes into nanochannels of zeolites (Fig. 6).10 The zeolite systems, in particular, display near perfect energy transfer to donor molecules. Interestingly, the spectral management is also accompanied by spatial hopping of excitation energy which can be used for charge separation and conversion to other energy forms.
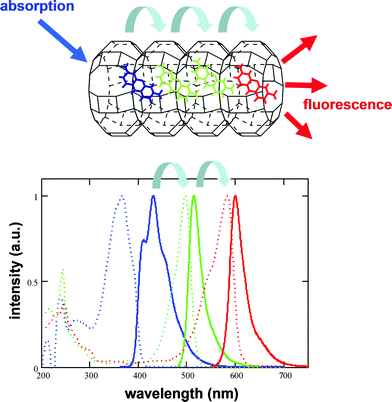 | ||
| Fig. 6 Efficient energy transfer between molecules in zeolite L, illustrating dual aspect of Förster energy transfer: spatial hopping of molecular excitation (top) accompanied by a change of the fluorescence spectrum (bottom).10 | ||
Experiments with downshifting to improve the spectral response reveal an interesting fact: the downshifting structures also work well when solar cells cover only a part of the down shifting structure (Fig. 2b). This can be explained by light-guiding properties of the combined glass/fluorescent layers which usually have similar refractive indices. Light travels along the light guide, and is diverted into the semiconductor solar cells which have a higher refractive index. These structures show a close similarity between down shifting and a structure that will be discussed in some length in Sec. 4: fluorescent collectors. First, however, we shall introduce a useful concept that will help us describe the concentration of sunlight as well as possible links to thermodynamics.
3. Defining the size of a light beam: the étendue
A useful quantity which characterizes the size of a beam is the étendue.11 For a narrow beam of angular spread δΩ passing through an area element δA, the étendue is defined as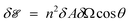 | (1) |
 = πn2A. Much of the importance of étendue in optics stems from the fact that the étendue of a beam propagating in a clear, transparent medium is conserved.
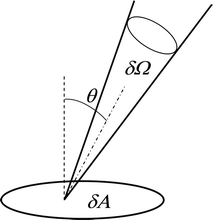 | ||
| Fig. 7 The concept of étendue. | ||
A quantitative description of frequency management relies on a different aspect of the étendue, as a measure of the volume that a beam occupies in the “phase space” of photon coordinates including both space (Cartesian) as well as orientations (wave vector or momentum) coordinates.5,11 Following a parallel with the early statistical mechanics it then follows that étendue describes the number of quantum states in a beam. Similarly to particles in a box, a beam with étendue  and frequency ν contains 2v2
 /c2 quantum states available for photon occupation. Since the frequency is constant, the phase spacevolume of a beam remains constant during the beam propagation in a clear and transparent medium. The étendue is a semi-classical concept, and our description only holds in situations where the number of modes is large. However, an extension to waveguides or systems with a smaller number of modes can be made.12
4. Fluorescent concentrators/collectors
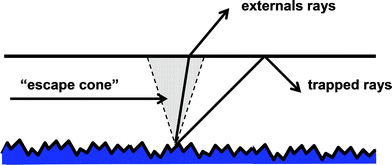
In many ways, fluorescent collectors (see Fig. 2b or Fig. 1c for a more usual geometry) resemble optical light guides. But there is an important difference: in an optical fibre, light is injected at a small local region at the end of the fibre. In contrast, fluorescent collectors absorb light through a large front face (entrance aperture) and guide it to smaller solar cells at the end of the collector.† This results in concentration of light but introduces an important loss mechanism: escape of light along the same path through which it enters the collector. Clearly, this loss mechanism cannot be avoided on the grounds of microscopic reversibility, closely linked to the second law of thermodynamics.11The operation of fluorescent collectors shown in Fig. 2b and 1c rests on the phenomenon of total internal reflection. The absorbed light is emitted isotropically inside the collector. If the ray orientation falls within the “escape cone” of the front surface (with a probability P = Ω/4π, where Ω is the solid angle of the escape cone), the photons will be lost from the collector within one or two passes through the thickness. Rays with directions outside the escape cone are trapped and have a good chance of reaching the solar cell, unless re-absorbed. In the latter case, the situation is repeated, and light is emitted from the collector with probability P in each re-absorption. Clearly, a good collector is characterized by a low re-absorption probability for fluorescent light–in contrast to a high absorbance for the incident solar light. This dichotomy lies in the heart of operation of all fluorescent collectors, and we shall consider it again in more detail below.
Similar structures to those used for downshifting provide a useful starting point for a discussion of fluorescent collectors. Here, however, re-absorption of light propagating along the substantial path length along the collector reveals subtly different spectral requirements (Fig. 8). The focus is now on the overlap between absorption and fluorescence, giving rise to losses through re-absorption.
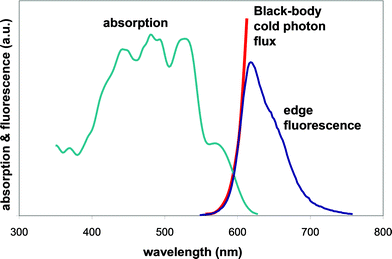 | ||
| Fig. 8 Typical absorption and edge fluorescence spectra of fluorescent collectors. In the overlap region, the edge emission resembles the quasi-black body radiation at ambient temperature. | ||
We note in passing that the overlap region between absorption and fluorescence displays also some interesting fundamental physics. If viewed from the edge, light in this spectral range has been repeatedly absorbed and re-emitted, bringing the photons into thermal equilibrium with the absorbing medium. These photons thus behave as a cold photon gas; their frequency distribution is governed by the equilibrium Bose-Einstein statistics with a non-zero chemical potential. In contrast, the incident photon flux has a spectrum which resembles a true black body at temperature close to 6000 K but chemical potential equal to zero.20
An optimum choice of the Stokes shift between absorption and fluorescence is key to good collector operation. A small Stokes shift results in a high re-absorption and substantial photon transport losses. A large Stokes shift, on the other hand, indicates that a considerable part of the spectrum is not absorbed. This discussion points to an optimum absorption spectrum of a fluorescent collector as shown in Fig. 9c, leading to a two-flux (or two channel) model of fluorescent collectors:3
Absorption channel , extending over a large part of the solar spectrum where the absorption coefficient of the collector αabs is large (≫ 1/d, where d is the thickness of the collector);
Fluorescence/photon transport channel, formed by a narrow frequency band at longer wavelengths, where the absorption coefficient αem is small (≪ 1/L, where L is the lateral dimension of the collector; Fig. 9a).
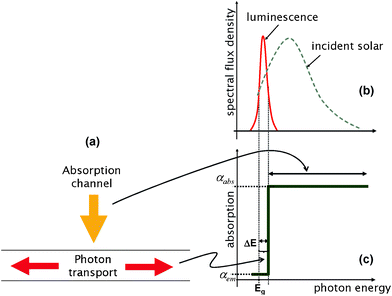 | ||
| Fig. 9 (a) Two flux model of fluorescent collectors based on Total Internal Reflection. (b) The spectra of the incident and emitted light. (c) The absorption coefficients in the two channels. | ||
We note that absorption in the photon transport channel cannot be entirely eliminated as, by Kirchhoff's law, some absorption must accompany the dye fluorescence.
This model also provides a pointer towards how the collector operation could be improved. It would clearly be desirable to remove the principal loss mechanism represented by photon emission through the escape cone. One such avenue would be to use materials with high refractive index but such materials are not readily available. An alternative choice is to employ photonics to replace photon management by high/low absorption coefficients.14,15 Such strategy is shown in Fig. 10. The top face (entrance aperture) of the collector is covered by a photonic filter (a band stop) that reflects the fluorescent light (Fig. 10a). Interference filters with a similar profile are commonplace in laser physics but usually display a dependence of the cut off energy on angle of incidence which, from a thermodynamics viewpoint, can be here neglected. The photonic filter blocks much of the escaping light and reduces photon transport losses to a minimum. Again, these losses cannot be eliminated entirely as a “window” has to be left open for the absorption of the incident photon flux and some fluorescent light will therefore be emitted.
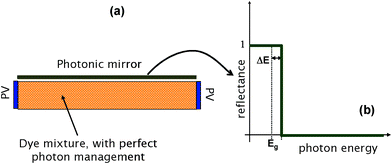 | ||
| Fig. 10 (a) An advanced fluorescent collector where a photonic band stop covers the entrance aperture., with reflectance shown in (b). | ||
The limit on photon collection efficiency is imposed by microscopic reversibility which gives:14
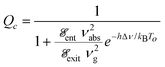 | (2) |
5. Light trapping
Similarly to geometric concentrators, the prime motivation for the use of fluorescent collectors is to reduce the size of the solar cell whilst light is captured from a large area. We shall now show that fluorescent collectors can bring about a further benefit: extending the path of light inside the solar cell. A strategy that illustrates this concept is shown in Fig. 11; here, a fluorescent collector is used to illuminate a solar cell from the edge. We have shown16 that a similar collector can, in principle, deliver optical efficiencies approaching 90% whilst concentrating light onto the edge of 1 μm thick crystalline silicon solar cell. This is clearly a substantial improvement in material usage even against traditional fluorescent collectors.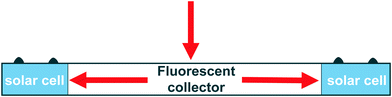 | ||
| Fig. 11 Fluorescent collectors can be used to direct light onto the edge of a solar cell, acting both as a concentrator and light-trapping structure. | ||
The improvement of light absorption by this means is usually called light trapping. Fig. 12 shows a more usual light trapping scheme based on a textured rear surface, scattering photons between radiation (externally coupled) and trapped (internal) photon modes. Photons incident from within the collectors onto the top surface in modes with directions outside the “escape cone” are reflected whilst photons within the cone are emitted from the structure. A similar effect can be produced by surface texturing of the front surface or indeed, by any scattering mechanism inside the absorber. Optimum light trapping is obtained when the scattered light attains an equilibrium (uniform) distribution of over all directions, resulting in a photon path length of 4n2d, where n is the refractive index.17 This argument assumes that light is emitted from the front (illuminated) surface of area A within a full hemisphere, with an étendue of πA. If the étendue of the emitted beam is restricted to a value ![[scr E, script letter E]](https://www.rsc.org/images/entities/char_e140.gif) exit smaller than πA, the path length can be extended further to‡
exit smaller than πA, the path length can be extended further to‡
 | (3) |
 | ||
| Fig. 12 A light trapping scheme with a textured rear surface.18 | ||
Suppose now that the textured reflecting rear surface of Fig. 12 is replaced with a highly absorbing fluorescent layer of a similar refractive index as silicon. A photonic filter/mirror similar to that shown in Fig. 10 is placed across the top face, and a perfect reflector covers the rear surface (Fig. 13).
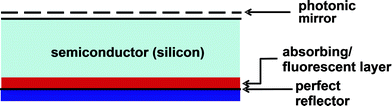 | ||
| Fig. 13 A light trapping scheme of Fig. 12 where an absorbing/fluorescent layer at the back surface introduces a frequency shift. | ||
Within the realm of ray optics, the isotropic emission process ensures uniform orientations of the emitted rays as in the case of geometrical light trapping. Furthermore, if all photons incident on this layer are absorbed and re-emitted as fluorescence, equilibrium is established between radiation and the absorbing/fluorescent medium, as in the case of fluorescent collectors (see Sec. 4). The semiconductor layer will now contain an equilibrium cold photon gas; the photonic mirror with band gap hΔν ensures that only photons with a energy above this band gap can escape. Consequently, the emission rate will be slowed down by a factor proportional to the appropriate Boltzmann factor and the path length of photons in the structure is increased to18
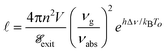 | (4) |
As an illustration, Fig. 14 shows the fraction of light with wavelength 1 μm (hνo = 1.24 eV) close to the silicon band gap (taken here as the optical band gap of 1.107 eV) which is absorbed by a structure 1 μm thick with a light trapping scheme based on a frequency shift (in this case, hΔν = 0.133 eV) and compared with the fraction of light absorbed by a similar layer with surface texturing and a back reflector. It is seen that photonic light trapping provides a substantial improvement in absorption and allows almost all the above band gap light to be absorbed in a layer only few micrometres thick.
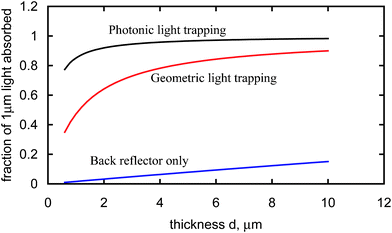 | ||
| Fig. 14 Fraction of light with wavelength 1 μm absorbed by structures with BSR and different forms of light trapping. | ||
The practical implication of such absorption enhancement is illustrated in Fig. 15. Obtained by modeling,18Fig. 15 shows the quantum efficiencies of 1 μm thick crystalline silicon solar cells compared to the ideal efficiency of a 500 μm thick cell with a back surface reflector (BSR). The corresponding conversion efficiencies are shown in Table 1. We note that the light trapping scheme with a photonic mirror (with cut off wavelength ∼900 nm) now takes over from the semiconductor band gap as the principal parameter that governs the operation of the solar cell, with an interesting consequence. The change in band gap has an interesting further consequence—it moves the band gap closer to the highest possible efficiency of a single junction solar cell, as predicted by the Shockley-Queisser theory.19 Thus, somewhat surprisingly, a 1 μm thick c-Si solar cell with a photonic band gap is not only highly effective in trapping light but can exceed the efficiency of a standard crystalline silicon solar cell!
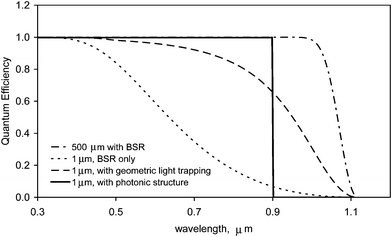 | ||
| Fig. 15 Comparison of quantum efficiencies of the two light trapping schemes, with cells of different thickness with Back Surface Reflector. | ||
| Thickness (μm) | Light trapping/BSR | Efficiency (%) |
|---|---|---|
| 500 | BSR | 30.3 |
| 1 | BSR | 15.6 |
| 1 | Geometric light trapping | 23.2 |
| 1 | Photonic light trapping | 30.7 |
6. Discussion
We have shown how different photon frequency management strategies can enhance the capture of light and improve the efficiency of photovoltaic conversion. They provide a diverse collection of techniques which can be loosely divided into light trapping and concentration but it is useful to summarize several common trends.To this end, let us picture—with the help of some thermodynamics—photon management as a transformation of a light beam. One can show11 that there is a close connection between the number of states in the beam (and thus étendue), and the entropy carried by a beam: each photon in a beam with étendue  carries the entropy kB ln
  + const. The conservation of étendue in geometrical optics (at constant frequency) thus also signifies the conservation of entropy, similarly to a system subject to purely mechanical laws. If stochastic behaviour is included, the second law of thermodynamics implies a generalization to this rule, that étendue cannot decrease. Similar to elastic scattering, light trapping by scattering at a textured surface also occurs at a constant energy but entropy increases as photon distribution approaches an equilibrium distribution with respect to directions.
These processes occur on a constant frequency shell, in an isolated system. They can be contrasted with a beam transformation where the condition of frequency conservation is relaxed.§ The absorption and emission of radiation introduces an interaction with the absorbing substance. Through standard detailed balance conditions¶ this interaction imprints the temperature of matter on the spectrum of emitted fluorescence. The equilibrium state of such systems is now governed by the maximum of free energy. Equivalently one can say that the chemical potential of the emitted photons is equal to the chemical potential of excitons or electron-hole pairs which are subsequently converted into electricity—a familiar connection to the open circuit voltage produced by the solar cell.20
Seen from this viewpoint, one can now understand that, unlike purely geometrical systems, fluorescent collectors can reduce the étendue of the beam, facilitating the concentration process by allowing, for example, the concentration of diffuse light.
Thus, changing frequency creates more effective environment than filling photon modes trapped by total internal reflection (TIR) at a single frequency. In this framework, a “hot” photon beam at temperature TS ≅ 6000 K enters the structure without a significant obstruction by the band stop. The photons are absorbed and cooled by interaction with matter to the ambient temperature To ≅ 300 K. This cold photon gas (already encountered in Sec. 4) is trapped by the combination of TIR and the band stop as energy hΔν is needed for escape by thermal activation.
7. Conclusions
We have shown that photon frequency management opens promising avenues for increasing solar cell efficiency and lowering the cost, by reducing the size as well thickness of the solar cell. In the near term, opportunities arise from the application of down shifting/light guiding structures to increase the efficiency of, for example, CdTe solar cells or producing reasonably efficient fluorescent collectors. Looking towards the longer term photon frequency management in photonic structures to confine light, be it in fluorescent collectors or directly in crystalline silicon solar cells, offers the promise of more substantial improvements in efficiency, with significantly lower material usage than hitherto.Acknowledgements
Research presented in this paper has been supported in part by the Supergen-PV21 Programme of the Engineering and Physical Sciences Research Council, UK. Liping Fang would like to acknowledge receipt of a studentship from the China Scholarship Council.References
- See H. A. Atwater and A. Polman, Nat. Mater., 2010, 9, 205 CrossRef CAS , for a review of alternative approaches to light trapping using sub-wavelength techniques and nanostructures.
- P. J. Verlinden, High-efficiency concentrator silicon solar cells, in: T. Markvart and L. Castañer (eds), Practical Handbook of Photovoltaics: Fundamentals and Applications, Elsevier, Oxford, 2003, p. 435 Search PubMed.
- M. A. Green, High-efficiency solar cell concepts, ibid, 253 Search PubMed.
- P. Kitidachachan, L. Danos, T. J. J. Meyer, N. Alderman and T. Markvart, Chimia, 2007, 61, 780 CrossRef.
- W. T. Welford and R. Winston, The Optics of Non-Imaging Concentrators, Academic Press, New York, 1978 Search PubMed.
- Th. Förster, Ann. Phys., 1948, 2, 55 CrossRef.
- L. Danos, T. Parel, T. Markvart, V. Barrioz, W. S. M. Brooks and S. J. C. Irvine, Solar Energy Materials and Solar Cells, 2012, 98, 486 CrossRef CAS.
- V. Krishnakumar, J. Han, A. Klein and W. Jaegermann, Thin Solid Films, 2010, 519, 7138 CrossRef.
- See, for example, H. Kuhn, D. Mobius and H. Bucher, in: Techniques of Chemistry, ed. A. Weisberger, B. Rossiter, Wiley, New York, 1972, p. 577 Search PubMed.
- (a) G. Calzaferri, M. Pauchard, H. Maas, S. Huber, A. Khatyr and T. Schaafsma, J. Mater. Chem., 2002, 12, 1 RSC; (b) G. Calzaferri and K. Lutkouskaya, Photochem. Photobiol. Sci., 2008, 7, 879 RSC.
- T. Markvart, J. Opt. A: Pure Appl. Opt., 2008, 10, 015008 CrossRef , and to be published.
- H. R. Stuart and D. G. Hall, J. Opt. Soc. Am. A, 1997, 14, 3001 CrossRef CAS.
- J. C. Goldschmidt, P. S. Fischer, S. Janz, M. Peters, S. W. Glunz, G. Willeke, E. Lifshitz, K. Krämer and D. Biner, 2008 Conference on Optoelectronic and Microelectronic Materials and Devices, 2008, COMMAD 2008, 307–311, DOI:10.1109/COMMAD.2008.4802153.
- T. Markvart, J. Appl. Phys., 2006, 99, 026101 CrossRef.
- U. Rau, F. Einsele and G. C. Glaser, Appl. Phys. Lett., 2005, 87, 171101 CrossRef.
- T. Markvart and L. Danos, Proc. 5th World Conf. Photovoltaic Energy Conversion, Valencia, 2010, p. 2692–2693 Search PubMed.
- E. Yablonovitch, J. Opt. Soc. Am., 1982, 72, 899 CrossRef.
- T. Markvart, Appl. Phys. Lett., 2011, 98, 071107 CrossRef , and to be published.
- W. Shockley and H. J. Queisser, J. Appl. Phys., 1961, 32, 510 CrossRef CAS.
- See, for example, P. Wurfel, Physics of Solar Cells, Wiley, Weinheim, 2005 Search PubMed.
Footnotes |
| † Small collecting regions at the front or rear surface have also been proposed.13,15 |
| ‡ Obtained originally in a different form by A. Goetzberger, 15th IEEE Photovoltaic Specialists Conference 1981, p. 867–870. The étendue formulation follows by a simple modification of argument presented in Ref. 18 |
| § The assumption of constant number of photons is retained, corresponding to a unit fluorescence yield. |
| ¶ Expressed here through the Kennard-Stepanov relations. See E. H. Kennard, Phys. Rev. 1918 11, 29; 1926 28, 672. B. I. Stepanov, Sov. Phys. Doklady, 1957, 112, 81. |
| This journal is © The Royal Society of Chemistry 2012 |