Looped carbon capturing and environmental remediation: case study of magnetic polypropylene nanocomposites†
Jiahua
Zhu
ab,
Hongbo
Gu
a,
Sowjanya B.
Rapole
ab,
Zhiping
Luo
c,
Sameer
Pallavkar
a,
Neel
Haldolaarachchige
d,
Tracy J.
Benson
a,
Thomas C.
Ho
a,
Jack
Hopper
a,
David P.
Young
d,
Suying
Wei
*b and
Zhanhu
Guo
*a
aIntegrated Composites Laboratory (ICL), Dan F. Smith Department of Chemical Engineering, Lamar University, Beaumont, TX 77710, USA. E-mail: zhanhu.guo@lamar.edu; Tel: (409) 880-7654 (Z. G.)
bDepartment of Chemistry and Biochemistry, Lamar University, Beaumont, TX 77710, USA. E-mail: suying.wei@lamar.edu; Tel: (409) 880-7654 (S.W.)
cMicroscopy and Imaging Center and Materials Science and Engineering Program, Texas A&M University, College Station, TX 77843, USA
dDepartment of Physics and Astronomy, Louisiana State University, Baton Rouge, LA 70803, USA
First published on 24th April 2012
Abstract
A waste-free process to recycle Fe@Fe2O3/polypropylene (PP) polymer nanocomposites (PNCs) is introduced to synthesize magnetic carbon nanocomposites (MCNCs) and simultaneously produce useful chemical species which can be utilized as a feedstock in petrochemical industry. The magnetic nanoparticles (NPs) are found to have an effective catalytic activity on the pyrolysis of PP. The PNCs (with a NP loading of 20.0 wt%) undergo a complete degradation with 2 h pyrolysis at 500 °C in a H2/Ar atmosphere and the degradation components exhibit a distribution of species with different numbers of carbon, while only 40% of pure PP is decomposed after applying the same pyrolytic conditions. The coked solid waste from the conventional process has been utilized as a carbon source to form a protective carbon shell surrounding the magnetic NPs. The magnetic carbon nanocomposites (MCNCs) pyrolyzed from PNCs containing 20.0 wt% NPs demonstrate extremely fast Cr(VI) removal from wastewater with the almost complete removal of Cr(VI) within 10 min. The pH effect on the Cr(VI) removal efficiency is investigated with a preferable value of 1–3. The adsorbent exhibits much higher adsorption capacity in acidic solutions than that in alkali solutions. The large saturation magnetization (32.5 emu g−1) of these novel magnetic carbon nanocomposites allows fast recycling of both the adsorbents and the adsorbed Cr(VI) from the liquid suspension in a more energetically and economically sustainable way by simply applying a permanent magnet. The significantly reduced treatment time required to remove the Cr(VI) makes these MCNCs promising for the efficient removal of the heavy metals from wastewater. Kinetic investigation reveals the pseudo-second-order adsorption of Cr(VI) on these novel magnetic carbon nanocomposite adsorbents.
1. Introduction
The ever increasing disposal of municipal solid waste (MSW) has placed serious environmental problems in the last few decades. The amount of MSW generated in the United States continues to increase, from each person 2.68 lb day−1 in 1960 to each person 4.34 lb day−1 in 2009.1 The total MSW generation was as high as 243 million tons in 2009 and new technologies to recycle MSW in a more efficient and sustainable manner are in great demand. From the United States Environmental Protection Agency (EPA) report, the recycling rate of the MSW has increased significantly from 6.4% in 1960 to 33.8% in 2009.1 However, much more effort is still required to recycle plastics due to the very low recycled amount for some types of plastic wastes. For instance, polypropylene (PP) accounted for 13.6% of the total plastic waste in the United States in 2000 and only about 0.3% was recycled.1Land-filling, incineration and recycling are currently the major options for MSW treatment.2,3 However, landfill has environmental risks due to the chemical inertness of the plastics and limited available space, which is another drawback of this method. Incineration, not widely used primarily because of the potential generation of toxic gaseous products and ash, only shifts a solid waste issue to an air pollution problem. Recycling plastic waste obtains great benefits in terms of the environmental concerns and economic feasibility, which includes reducing the need for landfilling and incineration, preventing the pollution caused by the manufacturing of products from raw materials, decreasing the emissions of greenhouse gases, and conserving the natural resources such as timber, water, and minerals. The options for plastic recycling are divided into four major groups: (1) reusing the plastics directly for other applications; (2) reprocessing waste plastics to secondary products; (3) recovering valuable chemical resources from waste plastics; (4) incinerating waste plastics to recover energy.4 Pyrolysis is an attractive resource recovery approach that converts plastic waste to valuable chemicals and/or monomers to produce new polymers. Compared to thermal pyrolysis, catalytic pyrolysis is preferred to improve the yield of valuable products, lower the reaction temperature, increase the yield of gasoline (C5–C12) and/or alter the composition of the oil product.5 Acidic catalysts (zeolites ZSM-5, moedenite, zeolite-Y, and a sulfur-promoted zirconia),6 base promoted iron catalysts supported on γ-alumina,7 zeolite and clay based microporous catalysts,8 and even enzyme (Candida antarctica lipase)3 were used in recycling the different types of polymer waste to improve the yield and to enhance the selectivity of the products. However, catalyst deactivation by poisoning, fouling and thermal degradation is of a great concern in the catalytic processes due to the huge cost for the catalyst replacement and process shutdown.
With the rapid development of novel multifunctional polymer nanocomposites (PNCs), unique physicochemical properties have been revealed and tremendous potential applications have been discovered deriving from these novel nanostructured materials.9–18 For examples, poly(vinylidene fluoride-co-hexafluoro propylene) nanocomposites reinforced with surface modified BaTiO3 nanoparticles (NPs) have demonstrated the capacity to sustain high energy density19 and β-MnO2/polypyrrole nanorod composites have served as high performance supercapacitors with a specific capacitance of 294 F g−1.20 Moreover, these various newly designed and fabricated PNCs have shown great applications such as in electronics, like light-emitting diode (LED),21 electrocatalysts in fuel cell systems,22 strain sensors,23 and microwave absorbers.24,25 Be aware of the current challenges in recycling the plastic waste, how to efficiently recycle PNCs becomes even much more challenging due to the complex components and unpredictable degradation species with the existence of the nanofillers. Especially, PNCs filled with 3d transition metals such as Fe, Co, and Ni NPs,7,26–28 the pyrolysis pathway of the PNCs can be significantly different from that of the pure polymers.28 Meanwhile, the strong affinity of the polymers with the particle surfaces inevitably generates more coke to deactivate the catalysts in the pyrolysis process. Ways to comprehensively and sustainably recycle the PNCs for valuable products are demanded for academic understanding and industrial applications; however they are rarely studied.
3d transition metal including Fe, Co and Ni NPs are of great interest due to their unique magnetic properties and catalytic activity.24,29–38 However, these bare metal particles especially in the nanoscale are readily oxidized or even ignite spontaneously upon exposure to air.38–40 Therefore, a protecting shell structure is often introduced to extend the applications of these NPs.41 Typically, these protective shells including silica,39,41,42 polymer,43 carbon44,45 and noble metals.46,47 Compared to other shells, the carbon shell with much higher stability in harsh environments48 and large specific surface area has shown an enhanced efficiency in the wastewater treatment.45 The reported techniques to synthesize carbon shells include magnetron and ion-beam co-sputtering,49 high temperature annealing,50 catalytic chemical vapor deposition,51 and pyrolysis of organometallic compounds52 or polymers.32,40 However, all these methods are costly, which limits their large-scale application. An economic method for large-scale synthesis of carbon coated metallic NPs is still not available. These carbon-coated magnetic NPs have been demonstrated as effective adsorbents for Cr(VI) removal from wastewater with great advantages of high adsorption capacity and facile recycling by simply using a permanent magnet45,53 as compared to the conventional adsorbents such as activated carbon,54,55 biomass56 and Fe(III)/Cr(III) hydroxides.57 A recent review reporting on the synthesis and versatile applications of magnetic carbon nanocomposites (MCNCs) reveals the great advantages of these materials.58 However, different from the traditional method which includes intentionally introducing a polymer layer on the nanoparticle surface and then converting it to carbon, the carbon source from the recycled PNCs is simultaneously used to produce the MCNCs for heavy metal removal has been rarely studied so far.
In this paper, a comprehensive and sustainable waste-free coupled process of polymer nanocomposite (PNC) recycling is introduced to synthesize magnetic carbon nanocomposites (MCNCs) and to produce useful chemical radicals simultaneously. Briefly, Fe@Fe2O3/PP PNCs are fabricated using a facile organometallic thermal decomposition method. Following by a pyrolysis process under H2 (5%)/Ar environment at 500 °C for 2 h, the embedded NPs serve as catalysts for the PP pyrolysis. The coke produced on the NP surface during heating serves as a carbon source for the in situ formation of a carbon shell structure and the volatile phase is collected as a useful chemical resource or potential liquid fuel upon condensation. The related products have been thoroughly analyzed. The gas and polymer gel components are analyzed by the gas chromatography/mass spectrometry (GC-MS). The mechanisms of PP pyrolysis with and without NPs are comparatively proposed and discussed. The MCNCs are characterized by high resolution transmission electron microscopy (HRTEM), X-ray diffraction (XRD), thermogravimetric analysis (TGA) and magnetic measurements. Meanwhile, the feasibility of these MCNCs serving as novel adsorbents to remove Cr(VI) from wastewater is tested and the results show that the MCNCs have a large adsorption capacity and high removal efficiency. The adsorption kinetics and solution pH dependent adsorption behaviour are also detailed in this work.
2. Experimental
2.1. Materials
The isotactic PP used in this study was supplied by Total Petrochemicals Inc. USA (0.9 g cm−3 in density, Mn ≈ 40![[thin space (1/6-em)]](https://www.rsc.org/images/entities/char_2009.gif) 500, Mw ≈ 155000, melt index ≈ 35 g min−1). Iron(0) pentacarbonyl (iron carbonyl, Fe(CO)5, 99%) and three alkene standard chemicals of 1-tridecene(C13
500, Mw ≈ 155000, melt index ≈ 35 g min−1). Iron(0) pentacarbonyl (iron carbonyl, Fe(CO)5, 99%) and three alkene standard chemicals of 1-tridecene(C13![[double bond, length as m-dash]](https://www.rsc.org/images/entities/char_e001.gif) , 96%), 1-hexadecene (C16, > 99%) and 1-nonadecene (C19, > 99%) were commercially obtained from Sigma Aldrich. Potassium dichromate (K2Cr2O7, 99%) and 1,5-diphenyl carbazide (DPC) were purchased from Alfa Aesar. o-Phosphoric acid (H3PO4, 85 wt%) and xylene (laboratory grade, ρ = 0.87 g cm−3) were purchased from Fisher Scientific. All the chemicals were used as received without further treatment.
, 96%), 1-hexadecene (C16, > 99%) and 1-nonadecene (C19, > 99%) were commercially obtained from Sigma Aldrich. Potassium dichromate (K2Cr2O7, 99%) and 1,5-diphenyl carbazide (DPC) were purchased from Alfa Aesar. o-Phosphoric acid (H3PO4, 85 wt%) and xylene (laboratory grade, ρ = 0.87 g cm−3) were purchased from Fisher Scientific. All the chemicals were used as received without further treatment.
2.2 Fabrication of polymer nanocomposites and the pyrolysis process
The PP nanocomposites were prepared following the reported procedures.31 Briefly, PP was initially dissolved in xylene with a weight ratio of 1:10 (20 g:207 mL) and refluxed at the boiling point (∼140 °C) of xylene for around 2 h until the PP was completely dissolved. Then different weights (2.17 and 17.48 g) of Fe(CO)5 were injected into the dissolved PP dispersion to obtain the final PNCs containing 3.0 and 20.0 wt% of the NPs (based on pure elemental iron). The mixture solution turned from transparent to yellow immediately after the addition of Fe(CO)5 and then gradually changed to black during the additional 3 h refluxing process under nitrogen protecting conditions, indicating the formation of the NPs. Upon heating, Fe(CO)5 decomposed to Fe2(CO)9 and Fe3(CO)12 with the rapid formation of CO, reaching an equilibrium mixture of all the three carbonyls. The Fe3(CO)12 was then decomposed and finally formed the metallic NPs.59,60 The PNC solution was then cooled to around 90 °C and poured onto a large glass plate to allow solvent evaporation overnight. After that, the solid residues (powder-like products) were collected and dried in a vacuum oven at room temperature overnight.
To recycle the PNC waste, the PNCs were placed in a horizontal quartz tube and heated to 500 °C with a heating rate of 10 °C min−1 under the gas atmosphere of H2(5%)/Ar. The effect of the particle loading was also investigated by using PNCs with a particle loading of 3.0 and 20.0 wt%. The samples were denoted S3 and S20, respectively. The gas components, polymer gel components and solid particles decomposed from S3/S20, denoted SG3/SG20, SS3/SS20 and SP3/SP20, were collected for analysis. The schematic process for the polymer nanocomposite preparation and its thermal decomposition to various products is shown in Scheme 1. The gas samples were collected using Tedlar bag (SKC Inc., Part No. 232-05) from the downstream of the quartz tube 5 min later once the temperature reaches 500 °C. The polymer gels were condensed at the end of the quartz tube and they were scraped from the tube for further analysis after the heating process.
 | ||
| Scheme 1 The schematic process for the polymer nanocomposite preparation, thermal decomposition and application of the decomposed products. S3 and S20 indicate the polymer nanocomposites (PNCs) with a nanoparticle loading of 3.0 and 20.0 wt%. SG3/SG20, SS3/SS20 and SP3/SP20 represent the gas phase components, polymer gel components and solid particles decomposed from S3/S20, respectively. | ||
2.3 Characterization
The thermal degradation of the decomposed polymer gels was studied with a thermobalance (TA instruments TGA Q-500) from 25 to 550 °C in nitrogen atmosphere, with a flow rate of 60 mL min−1 and a heating rate of 10 °C min−1. The carbon-coated NPs (SP3/SP20) were analyzed in an air atmosphere from 25 to 775 °C with the same flow rate and heating rate.
The morphology of the carbon-coated SP3/SP20 NPs was determined using a FEI Tecnai G2 F20 microscope with field emission gun, operated at an accelerating voltage of 200 kV. Samples for TEM observation were prepared by drying a drop of SP3/SP20–ethanol suspension on the carbon-coated copper TEM grids.
The powder X-ray diffraction analysis of the SP3/SP20 was carried out with a Bruker AXS D8 Discover diffractometer with GADDS (General Area Detector Diffraction System) operating with a Cu-Kα radiation source filtered with a graphite monochromator (λ = 1.5406 Å).
For the magnetic measurements, a plastic drinking straw was used as the sample holder. A small portion of each sample, approximately 5–10 mg, was loaded into the straw. The magnetic moment of the sample was measured at room temperature in a commercial magnetometer (Quantum Design PPMS system), which is a Faraday-extraction type magnetometer. At each field value, 10 scans were measured and averaged.
3. Results and discussion
3.1 Gas components
Pure PP and S3/S20 PNCs were processed following the same pyrolysis procedures. The gas component and polymer gel component were collected separately during pyrolysis and were analyzed by GC-MS in order to identify the chemical structure of the evolved products. The GC traces for the gas products are shown in Fig. 1 and the assigned structure for each peak is displayed in Table 1. The species of the gas component consist of mainly three categories: alkanes, alkenes and aromatic compounds (No. 15 in Table 1). This product distribution is slightly different from previous literature reports where dienes were often observed.4,62 The structures were identified through the analysis of the mass fragmentation patterns as compared to the standard patterns of the pure chemical compounds. Most of the gas compounds obtained from both pure PP and S3/S20 PNCs are observed to be the same with a slight difference in the fraction, Table 1. For example, the major species of the gas component numbered 1, 2, 3, 4 and 7, representing 2,5-dimethyl-3-hexene (m/z 112), 3,4-diethyl-3-hexene (m/z 140), 3-methyl-1-butene (m/z 70), 1-pentene (m/z 70) and 2,4-dimethyl-hexane (m/z 114), respectively, are observed in all the three samples in considerable fraction.
| Species (no.) | m/z | Fraction (%) | Structures | ||
|---|---|---|---|---|---|
| PP | 3.0 wt% NPs | 20.0 wt% NPs | |||
| a “/” indicates the component, which is not available in the products. | |||||
| 1 | 112 | 14.81 | 23.42 | 12.29 |

|
| 2 | 140 | 8.45 | 18.47 | 12.73 |

|
| 3 | 70 | 15.34 | 5.02 | 9.56 |

|
| 4 | 70 | 4.3 | 19.27 | 12.40 |

|
| 5 | 128 | 2.64 | 0.97 | 2.36 |

|
| 6 | 142 | /a | 2.01 | 1.17 |

|
| 7 | 114 | 15.05 | 13.86 | 14.62 |

|
| 8 | 140 | 1.39 | 1.67 | 1.85 |

|
| 9 | 82 | 1.05 | 0.75 | 1.86 |

|
| 10 | 112 | / | 0.42 | 1.22 |

|
| 11 | 98 | 2.94 | 1.24 | 2.14 |

|
| 12 | 124 | 2.96 | 1.20 | 2.00 |

|
| 13 | 152 | 1.30 | / | 0.97 |

|
| 14 | 196 | 1.21 | / | 0.96 |

|
| 15 | 92 | 0.83 | 0.62 | 2.23 |

|
| 16 | 126 | 6.40 | 0.57 | 4.64 |

|
| Others | 21.33 | 10.51 | 17.00 | ||
The pyrolysis pathway that leads to the observed major products with different carbon numbers is clarified in Scheme 2 based on the reaction types proposed by Tsuchiya et al.63 The degradation is initiated by the random scission on the PP chains and thus primary (p) and secondary radicals (s) are formed. These free radicals either go further to abstract hydrogen from the long PP chains to form a tertiary (t) radical or recombine with free radicals to form alkanes. Generally, the alkenes are formed by radical transfer followed by a β-scission to generate a double bond, such as product no. 3. The formation of products no. 1 and 2 is more complex, that involves a radical attraction to a small alkene molecule and then forms larger radicals. These larger radicals follow a radical transfer (from primary to secondary/tertiary radical) and β-scission to form alkene (product no. 1) or radical–radical recombination to form a new double bond (product no. 2 and no. 4). The alkanes (product no. 7) are formed by four major steps—random scission, radical transfer, β-scission and hydrogenation. Although other steps that not explicitly drawn here are possible for the other products, the formation of these dominant products suggests that the pyrolysis mechanism in Scheme 2 represents the major reaction pathways.
 | ||
| Scheme 2 The degradation mechanism for the major gas components. | ||
3.2 Polymer gel components
Fig. 2 shows the typical GC traces of the diluted polymer gel (SS3) pyrolyzed from S3 PNCs. Pure PP and SS20 give similar GC peaks following the same analysis procedure, Fig. S1† and S2†. EI mass spectra data, insets (I) and (II) in Fig. 2, present the molecular weight information. Analysis of the chromatograms showed distinct groupings of peaks along the retention time axis. Decomposition components are identified using mass spectrometry according to the molecular weight and structural type, which are further verified by matching the retention time with those using standard compounds from Sigma-Aldrich. The EI results indicate that all the detected compounds have similar but different structures. Analysis of the CI results (Fig. S3†) on each peak of different retention times from the EI chromatograms, Fig. 2, show the same molecular mass within each of the groupings. Therefore, it was concluded that the compounds within the same group were isomers. For verification, available standards (C13, C16 and C19) were purchased and analyzed. Quantitation was based upon the C13 standard for the C13 peaks, C16 standard for the C16 peaks, and C19 standard for all remaining peaks, all using EI mode. As one can see, there are peaks up to C43, Fig. 3. Standards beyond the C19 were not available; however, in terms of retention times and mass spectra, these peaks are consistent with the smaller molecular weight species that elute earlier from the GC column.
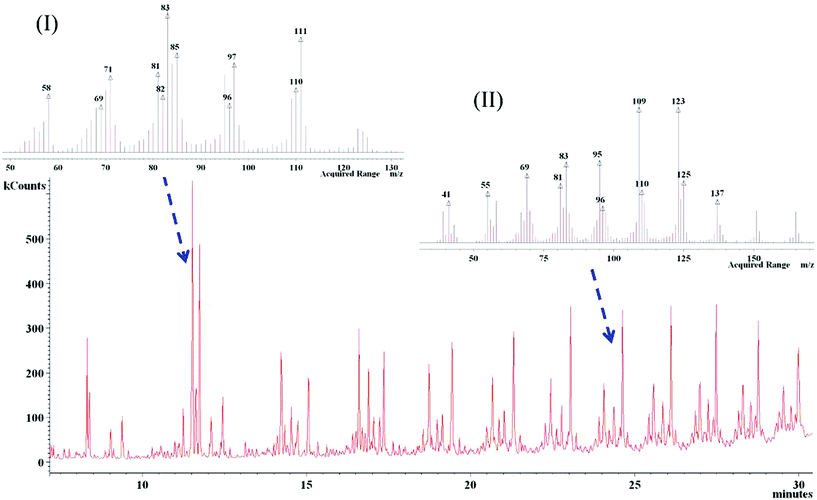 | ||
| Fig. 2 Typical GC-MS ion chromatogram for the polymer gel after pyrolysis of the S3 PNCs. Inset figures (I) and (II) are the EI mass spectra data presenting the molecular weight information. The polymer gel was diluted by toluene with 1/40 weight ratio before analysis. Similar spectra were obtained from pure PP and S20 PNCs. | ||
 | ||
| Fig. 3 Product yield of the polymer gel pyrolysis components from PP and PNCs. (H2(5%)/Ar gas, 500 °C, 2 h). Compounds were identified using EI and CI methods, and by retention times from standard compounds. SS(PP) represents the collected polymer gel components after thermal decomposition of pure PP. The samples were diluted by toluene with 1/40 weight ratio before analysis. | ||
Fig. 3 shows the product yields of the polymer gel from pure PP and S3/S20 PNCs. By analyzing the concentration of each component with different carbon numbers from C13 to C43, it is evident that SS3 and SS20 are able to generate more low carbon number molecules than SS(PP). The concentration of each component increases significantly after introducing 3% NPs into the PP matrix. Typically, the concentration of C19 in SS3 is 2.38 mg mL−1, which is 145% higher than that of 0.97 mg mL−1 of pure PP. SS3 exhibits the highest concentration of lower carbon number species (C13–C19), while the highest concentration of C22–C43 is dominated by SS20. In particular, the yield products of SS20 from C25 to C43 are nearly doubled as compared to those of pure PP. These results indicate that the thermal decomposition of PP could be significantly affected by the existence of small amount of Fe@Fe2O3 NPs. The large difference in the fraction of various species arises from the catalytic activity of the embedded NPs, which have been demonstrated as effective catalysts for PP degradation.64 More recently, iron oxide–carbon composite catalysts have been produced which exhibit excellent catalytic performance in the thermal degradation of brominated acrylonitrile–butadiene–styrene (ABS)/PP blends.65
To further characterize the polymer gel components, samples are collected and then subjected to thermogravimetric analysis (TGA) with a heating rate of 10 °C min−1 in a nitrogen atmosphere, and the DTG curves are also presented in Fig. 4(a and b). The TGA curve of the as-received PP is also plotted for comparison. Obviously, the as-received PP shows the highest initial decomposition temperature (Td), which starts from ∼400 °C and completes at 475 °C. However, the collected polymer gel begins to lose weight at a much lower temperature (∼ 50 °C) due to the existence of low-boiling-point small molecules. Comparing the TGA curves of SS(PP), SS3 and SS20, it is interesting to observe that SS(PP) degrades more slowly than SS3 and SS20. Meanwhile, a sharp weight loss of 60% starting from 400 °C and completing at 475 °C is observed, which is highly consistent with the results from the as-received PP. The TGA curves for SS3 and SS20 are similar to each other and both of them follow a linear degradation pattern until a complete decomposition. The SS3 curve goes down even faster than SS20 especially below 350 °C, which is consistent with the GC-MS analysis that more low-boiling-point (C13–C19) components are obtained from SS3. The DTG curves for all the samples are plotted in Fig. 4(b). The major weight loss of PP and SS(PP) happens between 400 and 475 °C with a sharp peak of large intensity in this region. On the contrary, the DTG curves for SS3 and SS20 were flattened and no such peaks were observed. These results indicate that the degradation of pure PP only generates small amount of light-weight components (∼40%) and ∼60% PP remains at its original molecular weight. With the addition of Fe@Fe2O3 NPs to the PP matrix, all the PP molecules have been decomposed and the amount of different carbon number species is evenly distributed as evinced by the flattened DTG curves. Moreover, it is worth mentioning that larger loadings of NPs do not contribute to a significant difference in the final polymer gel.
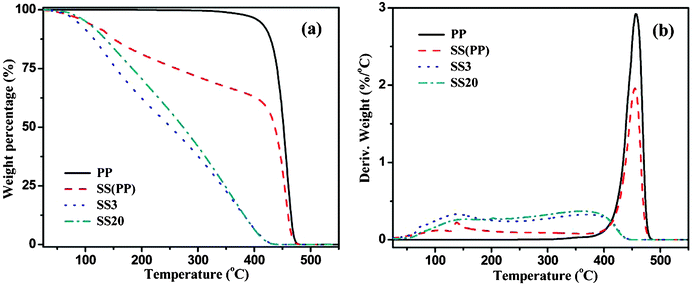 | ||
| Fig. 4 (a) TGA curves for the PP and the polymer gel pyrolyzed from PP and NPs/PP PNCs in nitrogen, and (b) the corresponding DTG curves. | ||
The formation mechanism for the dominant propylene oligomers (C13, C19, C22, i.e., C(3n+4), n = 3, 4, 5, 6, …) is illustrated in Scheme 3. Firstly, the reaction is initiated by the random scission of any PP chain to generate two shorter end-chain free radicals, as shown step (I) in Scheme 3. Secondly, the end-chain radicals can abstract hydrogen at different locations (such as a, b and c marked in Scheme 3) from a long PP chain to form a tertiary radical, step (II). Finally, the tertiary polymer radical is broken into two fragments undergoing a β-scission, one with a double bond at the end and the other with a secondary free radical, step (III).4,62
 | ||
| Scheme 3 The degradation mechanism for the polymer gels SS3/SS20. | ||
3.3 Solid residue (SP3 and SP20)
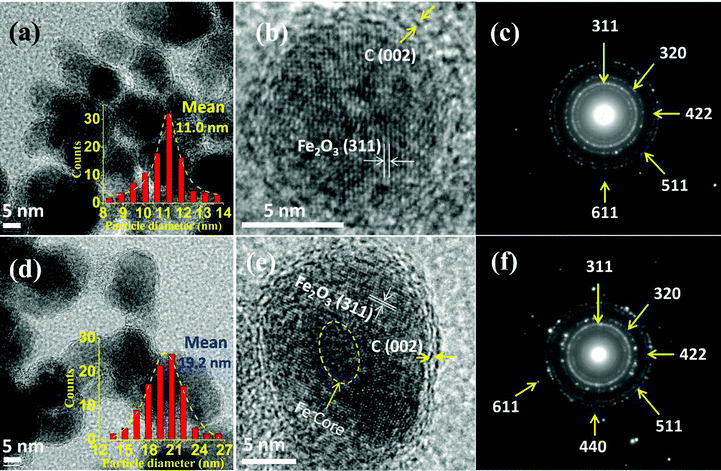 | ||
| Fig. 5 (a) TEM, (b) HRTEM images and (c) selected area electron diffraction (SAED) of SP3 NPs; (d) TEM and (e) HRTEM and (f) SAED of SP20 NPs. Insets of (a) and (d) indicate the particle size distribution and mean value of the NPs. | ||
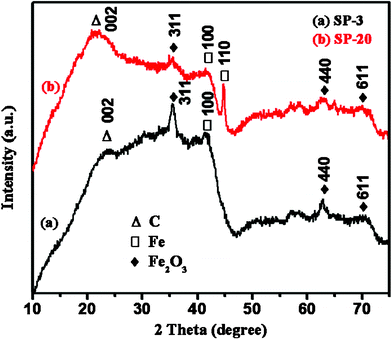 | ||
| Fig. 6 XRD profiles of the solid residue from (a) 3.0 wt% NPs/PP, (b) 20.0 wt% NPs/PP. | ||
000 Oe67). γ-Fe2O3 can be excluded since it has a much larger Ms of 64.0 emu g−1.68 The calculated Ms for the SP20 is 33.3 emu g−1, indicating a larger fraction of 14.6% pure iron and 85.4% α-Fe2O3.
 | ||
| Fig. 7 Magnetic hysteresis loop of the SP3/SP20 NPs at room temperature. The inset shows the enlarged partial hysteresis loop. | ||
 | ||
| Fig. 8 Thermogravimetric curves of the SP3 and SP20 magnetic carbon nanocomposites. | ||
3.4 Chromium removal
![Cr(vi) removal percentage (a) from Cr(vi) solution of different concentrations [SP20] = 1 g L−1; (b) with different SP20 concentrations, [Cr(vi)] = 1.5 mg L−1. Adsorption time: 10 min. UV-vis spectra refer to ESI Fig. S6 and S7.](/image/article/2012/RA/c2ra01150f/c2ra01150f-f9.gif) | ||
| Fig. 9 Cr(VI) removal percentage (a) from Cr(VI) solution of different concentrations [SP20] = 1 g L−1; (b) with different SP20 concentrations, [Cr(VI)] = 1.5 mg L−1. Adsorption time: 10 min. UV-vis spectra refer to ESI Fig. S6† and S7†. | ||

| (1) |
![Kinetic adsorption data plots of Cr(vi) by SP20: Cr(vi) removal rate qtvs. time t (solid square) and the transformed rate plot t/qtvs t (open square). [SP20] = 1 g L−1, [Cr(vi)] = 1.5 mg L−1, pH = 7. UV-vis spectra refer to ESI Fig. S8.](/image/article/2012/RA/c2ra01150f/c2ra01150f-f10.gif) | ||
| Fig. 10 Kinetic adsorption data plots of Cr(VI) by SP20: Cr(VI) removal rate qtvs. time t (solid square) and the transformed rate plot t/qtvs t (open square). [SP20] = 1 g L−1, [Cr(VI)] = 1.5 mg L−1, pH = 7. UV-vis spectra refer to ESI Fig. S8†. | ||
The fitting results obtained from different models are summarized in Table 2. With the highest correlation coefficient of R2 = 0.992 (fitting curve is shown in Fig. 10, open square curve), the pseudo-second-order model provides an excellent correlation for the adsorption of Cr(VI) on SP20. The R2 for the pseudo-first-order, Elovich and intraparticle diffusion models are 0.953, 0.976 and 0.936, respectively, indicating that these models are less suitable than that of the pseudo-second-order model for describing the Cr(VI) adsorption on SP20. The higher adsorption rate constant kad (0.099 g mg−1 min−1) of SP20 from the pseudo-second-order model than that of aluminum magnesium mixed hydroxide (<0.024 g mg−1 min−1),74 pomegranate husk carbon (<0.032 g mg−1 min−1)75 and activated carbon (<0.093 g mg−1 min−1)76 indicates the much faster removal rate with SP20.
| Models | Equationa | Parameters | R 2 | ||
|---|---|---|---|---|---|
| a q t is the solid-phase loading of Cr(VI) in the adsorbent at time t, qe is the adsorption capacity at equilibrium, k1 is the rate constant of pseudo-first-order adsorption. In pseudo-second-order model, kad is the rate constant of adsorption and h is the initial adsorption rate at t approaching zero, h = kadqe2. α and β represent the initial adsorption rate and desorption constant in the Elovich model. kdif indicates the intraparticle diffusion rate constant and C provides information about the thickness of the boundary layer. | |||||
| Pseudo-first-order69 |

|
k 1 (min−1) | q e (mg g−1) | 0.953 | |
| 0.089 | 1.342 | ||||
| Pseudo-second-order70 |

|
k ad (g mg−1 min−1) | q e (mg g−1) | h (mg g−1 min−1) | 0.992 |
| 0.099 | 1.519 | 0.229 | |||
| Elovich71,72 |

|
α (mg g−1 min−1) | β(g mg−1) | 0.976 | |
| 1.102 | 4.338 | ||||
| Intraparticle diffusion73 |

|
k dif (mg g−1 min−0.5) | C (mg g−1) | 0.936 | |
| 0.073 | 0.711 | ||||
![The effect of solution pH on Cr(vi) removal efficiency of SP20. [SP20] = 1 g L−1, [Cr(vi)] = 1.5 mg L−1, treating time: 10 min. For UV-vis spectra refer to ESI Fig. S9.](/image/article/2012/RA/c2ra01150f/c2ra01150f-f11.gif)
4. Conclusion
To recycle magnetic Fe@Fe2O3/PP polymer nanocomposites (PNCs) into useful chemical species and valuable magnetic carbon nanocomposites (MCNCs) in a sustainable way has been achieved with a looped carbon capturing feature. The Fe@Fe2O3 NPs within the PNCs (even in small amounts, for example, 3 wt%) play a significant role in the degradation of the PP matrix due to their catalytic activity. The decomposed species of the volatile components are almost the same for pure PP and PNCs but the major species such as 2,5-dimethyl-3-hexene, 3,4-diethyl-3-hexene, 3-methyl-1-butene and 1-pentene are in different fractions. The condensed polymer gel components decomposed from PNCs obtain a much higher fraction of light-weight species, for example, the concentration of the C13–C43 species is almost doubled as compared to the same species from pure PP. In addition, TGA results reveal that only 40% of the PP is degraded to lower molecular weight species following the same pyrolysis process from pure PP without NPs. The conventional coked solid residue is utilized as a carbon source to in situ synthesize carbon-coated NPs. The carbon-coated magnetic nanocomposites pyrolyzed from PNCs containing 20.0 wt% NPs show high adsorption capacity (1.5 mg g−1) and fast Cr(VI) removal from waste water. Typically, a 99% Cr(VI) removal percentage can be achieved within 10 min and the Cr(VI) concentration could be controlled well below the EPA regulation of 100 μg L−1. Kinetic investigation reveals a pseudo-second-order adsorption of Cr(VI) on the synthesized MCNCs. These MCNCs present higher adsorption capacity at lower pH solutions and the strong magnetization facilitates their easy separation from solution using a permanent magnet, which is an energetically and economically sustainable process.Acknowledgements
This project is financially supported by the National Science Foundation—Chemical and Biological Separations (EAGER: CBET 11-37441) managed by Dr Rosemarie D. Wesson. We acknowledge the support from the National Science Foundation—Nanoscale Interdisciplinary Research Team and Materials Processing and Manufacturing (CMMI 10-30755) managed by Dr Mary M. Toney to obtain the DSC and TGA equipments. D. P. Young acknowledges support from the NSF under Grant No. DMR 10-05764.References
- X. Qi, G. Poernomo, K. Wang, Y. Chen, M. B. Chan-Park, R. Xu and M. W. Chang, Nanoscale, 2011, 3, 1874–1880 RSC.
- R. S. Stein, Proc. Natl. Acad. Sci. U. S. A., 1992, 89, 835–838 CrossRef CAS.
- S. Kobayashi, H. Uyama and T. Takamoto, Biomacromolecules, 2000, 1, 3–5 CrossRef CAS.
- T. M. Kruse, H. -W. Wong and L. J. Broadbelt, Macromolecules, 2003, 36, 9594–9607 CrossRef CAS.
- G. Manos, A. Garforth and J. Dwyer, Ind. Eng. Chem. Res., 2000, 39, 1203–1208 CrossRef CAS.
- G. de la Puente and U. Sedran, Appl. Catal., B, 1998, 19, 305–311 CrossRef.
- J.-S. Kim, W.-Y. Lee, S.-B. Lee, S.-B. Kim and M.-J. Choi, Catal. Today, 2003, 87, 59–68 CrossRef CAS.
- K. Gobin and G. Manos, Polym. Degrad. Stab., 2004, 86, 225–231 CrossRef CAS.
- J. Zhu, S. Wei, J. Ryu, L. Sun, Z. Luo and Z. Guo, ACS Appl. Mater. Interfaces, 2010, 2, 2100–2107 CAS.
- J. Zhu, S. Wei, M. Alexander Jr., T. D. Dang, T. C. Ho and Z. Guo, Adv. Funct. Mater., 2010, 20, 3076–3084 CrossRef CAS.
- J. Zhu, S. Wei, J. Ryu, M. Budhathoki, G. Liang and Z. Guo, J. Mater. Chem., 2010, 20, 4937–4948 RSC.
- P. Mavinakuli, S. Wei, Q. Wang, A. B. Karki, S. Dhage, Z. Wang, D. P. Young and Z. Guo, J. Phys. Chem. C, 2010, 114, 3874–3882 CAS.
- J. Zhu, S. Wei, A. Yadav and Z. Guo, Polymer, 2010, 51, 2643–2651 CrossRef CAS.
- J. Zhu, S. Wei, L. Zhang, Y. Mao, J. Ryu, P. Mavinakuli, A. B. Karki, D. P. Young and Z. Guo, J. Phys. Chem. C, 2010, 114, 16335–16342 CAS.
- J. Zhu, S. Wei, L. Zhang, Y. Mao, J. Ryu, A. B. Karki, D. P. Young and Z. Guo, J. Mater. Chem., 2011, 21, 342–348 RSC.
- J. Zhu, S. Wei, L. Zhang, Y. Mao, J. Ryu, N. Haldolaarachige, D. P. Young and Z. Guo, J. Mater. Chem., 2011, 21, 3952–3959 RSC.
- J. Zhu, S. Wei, R. Patil, D. Rutman, A. S. Kucknoor, A. Wang and Z. Guo, Polymer, 2011, 52, 1954–1962 CrossRef CAS.
- H. Wei, X. Yan, Y. Li, S. Wu, A. Wang, S. Wei and Z. Guo, J. Phys. Chem. C, 2012, 116, 4500–4510 CAS.
- P. Kim, N. M. Doss, J. P. Tillotson, P. J. Hotchkiss, M. -J. Pan, S. R. Marder, J. Li, J. P. Calame and J. W. Perry, ACS Nano, 2009, 3, 2581–2592 CrossRef CAS.
- J. Zang and X. Li, J. Mater. Chem., 2011, 21, 10965–10969 RSC.
- P. Vacca, G. Nenna, R. Miscioscia, D. Palumbo, C. Minarini and D. D. Sala, J. Phys. Chem. C, 2009, 113, 5777–5783 CAS.
- K. Ding, H. Jia, S. Wei and Z. Guo, Ind. Eng. Chem. Res., 2011, 50, 7077–7082 CrossRef CAS.
- J. Zhu, S. Wei, J. Ryu and Z. Guo, J. Phys. Chem. C, 2011, 115, 13215–13222 CAS.
- Z. Guo, S. Park, H. T. Hahn, S. Wei, M. Moldovan, A. B. Karki and D. P. Young, J. Appl. Phys., 2007, 101, 09M511 CrossRef.
- J. Zhu, S. Wei, N. Haldolaarachchige, D. P. Young and Z. Guo, J. Phys. Chem. C, 2011, 115, 15304–15310 CAS.
- G. L. Bezemer, J. H. Bitter, H. P. C. E. Kuipers, H. Oosterbeek, J. E. Holewijn, X. Xu, F. Kapteijn, A. J. van Dillen and K. P. de Jong, J. Am. Chem. Soc., 2006, 128, 3956–3964 CrossRef CAS.
- A. Chambers, T. Nemes, N. M. Rodriguez and R. T. K. Baker, J. Phys. Chem. B, 1998, 102, 2251–2258 CrossRef CAS.
- J. Zhu, S. Wei, Y. Li, S. Pallavkar, H. Lin, N. Haldolaarachchige, Z. Luo, D. P. Young and Z. Guo, J. Mater. Chem., 2011, 21, 16239–16246 RSC.
- P. Gambardella, S. Rusponi, M. Veronese, S. S. Dhesi, C. Grazioli, A. Dallmeyer, I. Cabria, R. Zeller, P. H. Dederichs, K. Kern, C. Carbone and H. Brune, Science, 2003, 300, 1130–1133 CrossRef CAS.
- W. Z. Li, S. S. Xie, L. X. Qian, B. H. Chang, B. S. Zou, W. Y. Zhou, R. A. Zhao and G. Wang, Science, 1996, 274, 1701–1703 CrossRef CAS.
- J. Zhu, S. Wei, Y. Li, L. Sun, N. Haldolaarachchige, D. P. Young, C. Southworth, A. Khasanov, Z. Luo and Z. Guo, Macromolecules, 2011, 44, 4382–4391 CrossRef CAS.
- Z. Guo, S. Park, H. T. Hahn, S. Wei, M. Moldovan, A. B. Karki and D. P. Young, Appl. Phys. Lett., 2007, 90, 053111 CrossRef.
- Z. Guo, C. S. S. R. Kumar, L. L. Henry, E. E. Doomes, J. Hormes and E. J. Podlaha, J. Electrochem. Soc., 2005, 152, D1–D5 CrossRef CAS.
- J. Zhu, S. Wei, X. Chen, A. B. Karki, D. Rutman, D. P. Young and Z. Guo, J. Phys. Chem. C, 2010, 114, 8844–8850 CAS.
- X. Chen, S. Wei, C. Gunesoglu, J. Zhu, C. S. Southworth, L. Sun, A. B. Karki, D. P. Young and Z. Guo, Macromol. Chem. Phys., 2010, 211, 1775–1783 CrossRef CAS.
- J. Zhu, S. Wei, D. Rutman, N. Haldolaarachchige, D. P. Young and Z. Guo, Polymer, 2011, 52, 2947–2955 CrossRef CAS.
- S. Wei, R. Patil, L. Sun, N. Haldolaarachchige, X. Chen, D. P. Young and Z. Guo, Macromol. Mater. Eng., 2011, 296, 850–857 CrossRef CAS.
- Z. Guo, H. T. Hahn, H. Lin, A. B. Karki and D. P. Young, J. Appl. Phys., 2008, 104, 014314 CrossRef.
- N. J. Tang, W. Chen, W. Zhong, H. Y. Jiang, S. L. Huang and Y. W. Du, Carbon, 2006, 44, 423–427 CrossRef CAS.
- D. Zhang, R. Chung, A. B. Karki, F. Li, D. P. Young and Z. Guo, J. Phys. Chem. C, 2010, 114, 212–219 CAS.
- S. Wei, Q. Wang, J. Zhu, L. Sun, H. Lin and Z. Guo, Nanoscale, 2011, 3, 4474 RSC.
- J. Zhu, S. Wei, I. Y. Lee, S. Park, J. Willis, N. Haldolaarachchige, D. P. Young, Z. Luo and Z. Guo, RSC Adv., 2012, 2, 1136 RSC.
- J. L. Wilson, P. Poddar, N. A. Frey, H. Srikanth, K. Mohomed, J. P. Harmon, S. Kotha and J. Wachsmuth, J. Appl. Phys., 2004, 95, 1439–1443 CrossRef CAS.
- S. R. Rudge, T. L. Kurtz, C. R. Vessely, L. G. Catterall and D. L. Williamson, Biomaterials, 2000, 21, 1411–1420 CrossRef CAS.
- D. Zhang, S. Wei, C. Kaila, X. Su, J. Wu, A. B. Karki, D. P. Young and Z. Guo, Nanoscale, 2010, 2, 917–919 RSC.
- Z. Guo, M. Moldovan, D. P. Young, L. L. Henry and E. J. Podlaha, Electrochem. Solid-State Lett., 2007, 10, E31–E35 CrossRef CAS.
- Z. Lu, M. D. Prouty, Z. Guo, V. O. Golub, C. S. S. R. Kumar and Y. M. Lvov, Langmuir, 2005, 21, 2042–2050 CrossRef CAS.
- J. Hassoun, G. Derrien, S. Panero and B. Scrosati, Adv. Mater., 2008, 20, 3169 CrossRef CAS.
- T. Hayashi, S. Hirono, M. Tomita and S. Umemura, Nature, 1996, 381, 772–774 CrossRef.
- P. J. F. Harris and S. C. Tsang, Chem. Phys. Lett., 1998, 293, 53–58 CrossRef CAS.
- T. Yamada, T. Namai, K. Hata, D. N. Futaba, K. Mizuno, J. Fan, M. Yudasaka, M. Yumura and S. Iijima, Nat. Nanotechnol., 2006, 1, 131–136 CrossRef CAS.
- J. Zhu, S. Wei, H. Gu, S. B. Rapole, Q. Wang, Z. Luo, N. Haldolaarachchige, D. P. Young and Z. Guo, Environ. Sci. Technol., 2012, 46, 977 CrossRef CAS.
- F. Ding, A. Rosén, E. E. B. Campbell, L. K. L. Falk and K. Bolton, J. Phys. Chem. B, 2006, 110, 7666–7670 CrossRef CAS.
- D. Mohan and C. U. Pittman Jr, J. Hazard. Mater., 2006, 137, 762–811 CrossRef CAS.
- C. P. Huang and M. H. Wu, Water Res., 1977, 11, 673–679 CrossRef CAS.
- D. Park, Y. -S. Yun, J. Hye Jo and J. M. Park, Water Res., 2005, 39, 533–540 CrossRef CAS.
- C. Namasivayam and K. Ranganathan, Environ. Pollut., 1993, 82, 255–261 CrossRef CAS.
- M. Zhu and G. Diao, Nanoscale, 2011, 3, 2748–2767 RSC.
- T. W. Smith and D. Wychick, J. Phys. Chem., 1980, 84, 1621–1629 CrossRef CAS.
- J. V. Wonterghem, S. Mørup, S. W. Charles, S. Wells and J. Villadsen, Phys. Rev. Lett., 1985, 55, 410 CrossRef.
- M. Gardner and S. Comber, Analyst, 2002, 127, 153–156 RSC.
- H. -W. Wong and L. J. Broadbelt, Ind. Eng. Chem. Res., 2001, 40, 4716–4723 CrossRef CAS.
- Y. Tsuchiya and K. Sumi, J. Polym. Sci., Part A-1, 1969, 7, 1599 CrossRef CAS.
- M. Day, J. D. Cooney and M. MacKinnon, Polym. Degrad. Stab., 1995, 48, 341–349 CrossRef CAS.
- T. Bhaskar, K. Murai, M. Brebu, T. Matsui, M. A. Uddin, A. Muto and Y. Sakata, Green Chem., 2002, 4, 603–606 RSC.
- S. H. Park, S. M. Jo, D. Y. Kim, W. S. Lee and B. C. Kim, Synth. Met., 2005, 150, 265–270 CrossRef CAS.
- X.-M. Liu, S.-Y. Fu, H.-M. Xiao and C.-J. Huang, J. Solid State Chem., 2005, 178, 2798–2803 CrossRef CAS.
- B. R. V. Narasimhan, S. Prabhakar, P. Manohar and F. D. Gnanam, Mater. Lett., 2002, 52, 295–300 CrossRef CAS.
- S. Lagergren, Zur theorie der sogenannten adsorption gelöster stoffe, Kungliga Svenska Vetenskapsakademiens, Handlingar, 1898, 24, 1–39 Search PubMed.
- Y. S. Ho, G. McKay, D. A. J. Wase and C. F. Forster, Adsorpt. Sci. Technol., 2000, 18, 639–650 CrossRef CAS.
- R. -S. Juang and M. -L. Chen, Ind. Eng. Chem. Res., 1997, 36, 813–820 CrossRef CAS.
- D. L. Sparks, ed., Kinetics of Reaction in Pure and Mixed Systems, in Soil Physical Chemistry, CRC press, Boca Raton, 1986 Search PubMed.
- S. K. Srivastava, R. Tyagi and N. Pant, Water Res., 1989, 23, 1161–1165 CrossRef CAS.
- Y. Li, B. Gao, T. Wu, D. Sun, X. Li, B. Wang and F. Lu, Water Res., 2009, 43, 3067–3075 CrossRef CAS.
- N. Ahmed El, J. Hazard. Mater., 2009, 161, 132–141 CrossRef.
- A. El-Sikaily, A. E. Nemr, A. Khaled and O. Abdelwehab, J. Hazard. Mater., 2007, 148, 216–228 CrossRef CAS.
- B. M. Weckhuysen and I. E. Wachs, Chem. Rev., 1996, 96, 3327–3349 CrossRef CAS.
- J. N. Butler, Ionic Equilibrium, 1967, Addison-Wesley, New York Search PubMed.
- W. Stumm and J. J. Morgan, Aquatic Chemistry: An Intrioduction Emphasizing Chemical Equilibria in Natural Waters, 1996, John Wiley & Sons, Inc., New York Search PubMed.
Footnote |
| † Electronic supplementary information (ESI) available. See DOI: 10.1039/c2ra01150f |
| This journal is © The Royal Society of Chemistry 2012 |