Controllably hierarchical growth of large-scale ZnO microrods
Qunwei
Tang
a,
Lin
Lin
b,
Zhengping
Mao
c,
Ziying
Tang
a and
Jihuai
Wu
*a
aInstitute of Materials Physical Chemistry, Huaqiao University, Quanzhou, 362021, P. R. China. E-mail: jhwu@hqu.edu.cn; Fax: +86 595-22692229; Tel: +86 595-22693899
bDepartment of Chemistry, Tongji University, Shanghai, 200092, China
cDepartment of Mechanical Engineering, University of South Carolina, Columbia SC 29208, U.S.A
First published on 1st February 2012
Abstract
Hierarchical ZnO microrods were successfully grown on the upward surface of a Si substrate by a low-temperature hydrothermal method. The morphology and size can be easily controlled by adjusting reaction temperature and reactant concentration. The photocatalytic activities were evaluated by the degradation of Rhodamine B (RB) dye under UV and visible irradiation. The resultant hierarchical ZnO microrods show better photocatalytic activities for the photodegradation of RB than traditional nanoparticles and aligned nanorods.
1. Introduction
The controlled growth of one-dimensional (1D) micro-or nano-materials is of great importance for the development of modern science and technology.1 During the past few decades, much effort has been devoted to preparing 1D nanomaterials owing to their wide application in optoelectronic, electronic, electrochemical, and electromechanical devices. More recently, hierarchical growth of 1D nanostructures has become the focus of nanotechnology because they combine the features of micro-and nano-scaled building blocks and exhibit unique properties different from those of traditional 1D nanostructures.2–7 Moreover, they can be used as building units in nanodevices, which is crucial for the development of future nanodevices.8,9 Among various 1D nanomaterials, the II–VI semiconductor zinc oxide (ZnO), with a wide band gap (3.37 eV) and high exciton binding energy (60 meV), is a key engineering material on its own merits. To date, ZnO nanostructures have attracted extensive attention owing to their great applications in solar cells, photocatalysts, light-emitting diodes, gas sensors, photodetectors, etc. 1D hierarchical ZnO nanostructures such as nanowires, nanorods, nanotubes, nanobelts, nanoneedles and even nanoforests have been widely reported. Chemical vapor deposition, thermal evaporation, and solvothermal methods have been carried out to prepare the ZnO nanostructures. However, the previous reported methods are generally performed under high temperatures and high pressure conditions, with extended treatments and ZnO seeds are necessary.10,11 Therefore, it is still a challenge to develop a facile, mild and rapid synthesis method to prepare hierarchical ZnO nanostructures in a large scale.In the current work, we report the hierarchical growth of 1D ZnO nano- and microstructures using a simple low-temperature hydrothermal method. The morphologies and sizes can be facilely controlled by adjusting the growth temperature and ionic strength. This novel approach does not require any extended treatment or seeds. Consequently, the design of thin films with hierarchical ZnO microstructures over a large surface area is faster, cleaner, and less expensive.
2. Experimental
2.1. Preparation of ZnO nanorods
The synthesis was conducted by the thermal decomposition of a ZnII amino complex. Laboratory pyrex glass bottles with polypropylene autoclavable screw caps were filled with 25 mL zinc nitrate [Zn(NO3)2] and 25 mL methenamine aqueous solutions. The Zn(NO3)2 and methenamine have the same molar concentration (1, 10 and 100 mM). Subsequently, cleaned Si/SiO2 wafers were leant against inside wall with the target surface upward and heated at temperature of 90 or 95 °C for 24 hours in a regular laboratory oven. Finally, the as-prepared thin films were thoroughly washed with MilliQ+ water to eliminate residual salts, and dried with nitrogen flow.2.2. Photocatalytic measurements
The photocatalytic activities were evaluated by the decomposition of Rhodamine B (RB) under ultraviolet light. The ultraviolet light illumination was performed in an XPA series reactor (Xu jiang technology Co., Nanjing) with a 300 W mercury lamp. Aqueous suspensions of RB (40 mL, 20 mg mL−1) were laced in a vessel, and the Si supported hierarchical ZnO microrods with an area of 1 × 1 cm2 was added. The solutions were kept under constant air-equilibrated conditions before and during illumination. At certain time intervals, 3 mL solutions were analyzed by recording variations in the maximum absorption band of RB (475 nm) using an Agilent 8453 UV-Vis spectrophotometer (Agilent Instruments). The visible light was from a 500 W xenon lamp with a 450 nm cutoff filter to ensure the desired wavelength of light. The measurement of photocatalytic activities were the same to that of the ultraviolet light test.2.3. Characterization
Information about the structures and morphologies of the hierarchical ZnO microrods were obtained from the images taken with a JSM-6799F cold field emission scanning electron microscope. To detect the crystal structures of the hierarchical ZnO microrods, X-ray diffraction (XRD) experiments were performed on a Bruker AXS, D8 Focus diffractometer equipped with graphite monochromatized Cu-Kα irradiation (λ = 1.54056 Å), employing a scanning rate of 0.02° s−1 ranging from 2θ = 30 to 65°. The ZnO sample dispersed in methanol was monitored by UV-vis absorption spectroscopy (Agilent 8453 UV-Vis spectrophotometer.3. Results and discussion
Fig. 1 shows typical FE-SEM images of the hierarchical ZnO microstructures grown at 95 °C for 24 h. Fig. 1a clearly shows small quantity of shuttle-like ZnO microrods with diameter of 0.7–1.2 μm and length of 2.5–10 μm when the concentration of zinc nitrate/methenamine is 1 mM. In the case of zinc nitrate/methenamine concentration of 10 mM (Fig. 1b), one can see large quantity of such microstructures, and the diameter decreases to 400–700 nm with similar length to that grown at 1 mM. With a further increase of concentration to 100 mM (Fig. 1c), the shuttle shape becomes clear with a diameter of 4 μm in the center and 2.5 μm on the top, and the length is still in the 10 μm scale. Vertically aligned ZnO nanorods grown on the downward surface of Si/SiO2 wafer are observed (Fig. 1d), which has been widely investigated.12,13 In the current work, we focus on the hierarchical ZnO microstructures grown on the upward surface.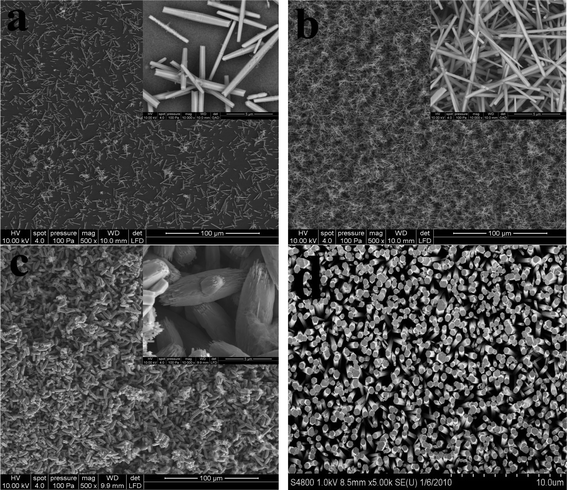 | ||
| Fig. 1 Field-emission scanning electron microscopy (FE-SEM) photographs of the as-prepared hierarchical ZnO microstructures grown in various zinc nitrate/methenamine concentrations at 95 °C for 24 h: (a) 1 mM, (b) 10 mM, and (c) 100 mM. Image (d) is the FE-SEM photograph of ZnO nanorod array grown on the downward surface of Si/SiO2 wafer at 100 mM. | ||
The crystal structures of the hierarchical ZnO microrods grown on the upward surface of a substrate were investigated by XRD analysis and shown in Fig. 2a. All the diffraction peaks can be indexed to a pure wurtzite hexagonal phase of bulk ZnO with the cell constants comparable to the already reported values (Joint Committee on Powder Diffraction Standards (JCPDS) Card No. 89-1397). In comparison with the standard XRD pattern for bulk ZnO, the strongest peak located at 36.2° may originate from the oriented growth of the resulting microrods along the c-axis in the (001) direction.4 The EDX composition analysis in Fig. 2b shows zinc and oxygen to be the only detected elements, without any carbon or nitrogen contamination.
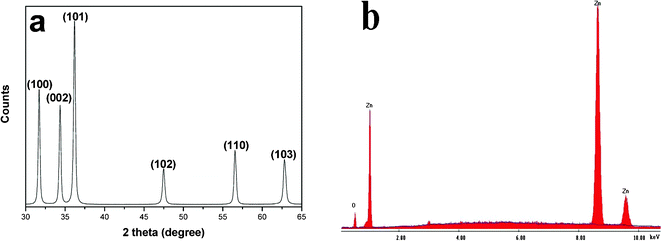 | ||
| Fig. 2 (a) X-Ray diffraction (XRD) pattern and (b) energy dispersive X-ray spectroscopy (EDX) analysis of the resultant ZnO microrods. | ||
To reveal the growth process, the FE-SEM photographs of the hierarchical ZnO microstructures at 3 h were recorded and are shown in Fig. 3. We can not find any remarkable differences between the ZnO structures at 3 h and 24 h in 1 mM (Fig. 3a) and 10 mM (Fig. 3b) zinc nitrate/methenamine except for the diminished sizes in diameter and length. However, the situation is completely different in 100 mM zinc nitrate/methenamine. A large amount of ZnO nanorods with diameter of ca. 400 nm and length of ca. 2 μm are observed. It is noteworthy to mention that the larger shuttle-like ZnO microrods that will grow into the microstructures in Fig. 1c are located on the top of the smaller nanorods and we cannot find the smaller nanorods in Fig. 1c, demonstrating the hierarchical growth on the upward surface of Si/SiO2 substrate.
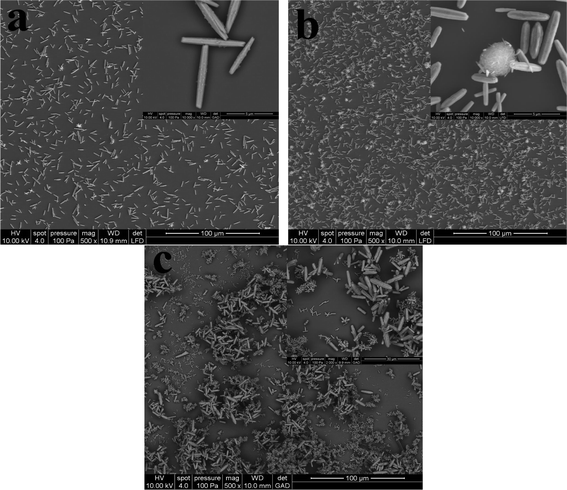 | ||
| Fig. 3 FE-SEM photographs of the as-prepared hierarchical ZnO microstructures grown in various zinc nitrate/methenamine concentrations at 95 °C for 3 h: (a) 1 mM, (b) 10 mM, and (c) 100 mM. | ||
To further reveal the hierarchical growth of ZnO microstructures, the FE-SEM images of the ZnO microstructures grown in 100 mM zinc nitrate/methenamine at 90 °C for 24 h by adding NaNO3 were shown in Fig. 4. In all the cases, we can obtain the hierarchical ZnO nano- and microstructures. By controlling the amount of NaNO3 added, the size of the ZnO nano- and microstructures can be adjusted. From the cross-sectional SEM images shown in Fig. 5b it can be seen that a layer of ZnO nanoparticle film with a thickness of ca. 1.3 μm was deposited on the Si/SiO2 surface, followed by the growth of hierarchical ZnO microstructures, however, only a ca. 500 nm thick ZnO nanoparicle film and ZnO microrods are obtained in Fig. 5a, which is consistent with the observations in Fig. 3a and Fig. 3b.
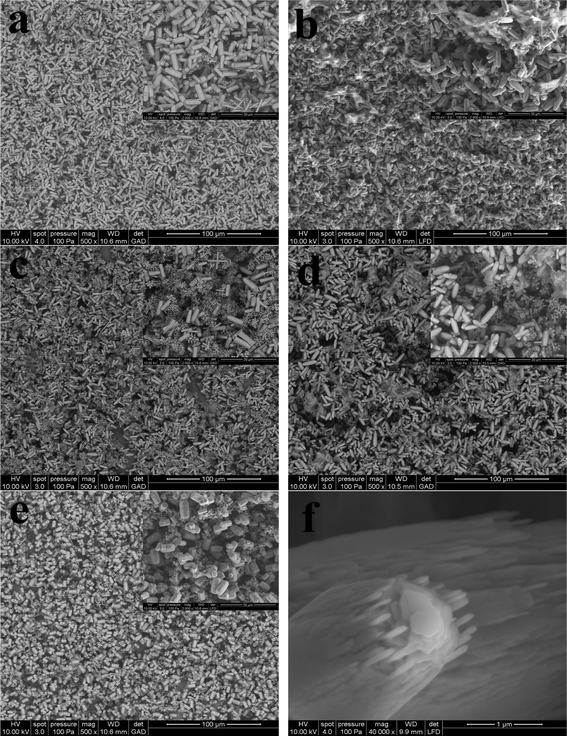 | ||
| Fig. 4 FE-SEM photographs of the as-prepared hierarchical ZnO microstructures grown in 100 mM zinc nitrate/mM methenamine and with the addition of 5 mL NaNO3 aqueous solution at 90 °C for 24 h: (a) without NaNO3, (b) 1 mM, (c) 10 mM, (d) 100 mM, and (e) 1 M. Image (f) is the high-resolution SEM photograph of the ZnO microrods grown in 100 mM zinc nitrate/mM methenamine at 95 °C for 24 h. | ||
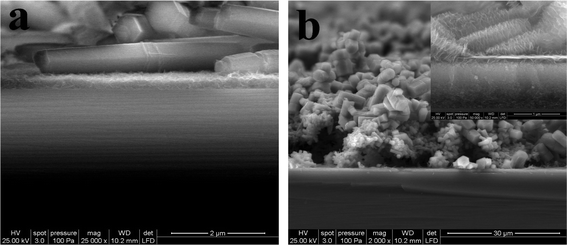 | ||
| Fig. 5 Cross-sectional FE-SEM photographs of the as-prepared hierarchical ZnO in (a) Fig. 1a and (b) Fig. 4e. | ||
On the basis of the above results, we propose a possible growth mechanism of hierarchical ZnO microrods. The whole evolution process can be described as follows: at the beginning of hydrothermal reaction, the interfacial energy between the ZnO crystals and Si/SiO2 substrate is smaller than that between the ZnO crystals and the solution, consequently, heteronucleation takes place on the Si/SiO2 wafer to form a nanoparticle film. Secondly, with the proceeding of reaction, the concentration of ZnII amino complex increases, the ZnO nuclei will self-assemble to form hexagonal nanorods based on an oriented attachment mechanism. It is well-known that the typical hexagonal wurtzite ZnO exhibits two polar planes (001) and (00![[1 with combining macron]](https://www.rsc.org/images/entities/char_0031_0304.gif) ). The two polar planes have higher surface energy and are metastable, which makes them absorb more ZnO nuclei than the nonpolar planes and allow the anisotropic growth along the (001) direction to form nanorods. It has been reported that the hexagonal nanorods were formed when the growth along the (001) direction was suppressed by chemical surface modification in solution. In our conditions, the growth rate of the (001) direction can be suppressed by the absorption of methenamine polar molecules. From the observed morphologies, particularly that in Fig. 4f, it can be seen that the surface of a single ZnO microrod is covered with a large quantity of nanorods, which are not developed as individuals but are conjoined. Considering the observed branches, we proposed a possible growth mechanism. Many defect sites, e.g., stacking faults and twins, are excited during the formation of main ZnO microrods.14 These defect sites will act as seeds for epitaxial growth of microstructured branches and conjoined nanorods depending on the hydrothermal conditions (concentration, temperature, and ionic strength).
). The two polar planes have higher surface energy and are metastable, which makes them absorb more ZnO nuclei than the nonpolar planes and allow the anisotropic growth along the (001) direction to form nanorods. It has been reported that the hexagonal nanorods were formed when the growth along the (001) direction was suppressed by chemical surface modification in solution. In our conditions, the growth rate of the (001) direction can be suppressed by the absorption of methenamine polar molecules. From the observed morphologies, particularly that in Fig. 4f, it can be seen that the surface of a single ZnO microrod is covered with a large quantity of nanorods, which are not developed as individuals but are conjoined. Considering the observed branches, we proposed a possible growth mechanism. Many defect sites, e.g., stacking faults and twins, are excited during the formation of main ZnO microrods.14 These defect sites will act as seeds for epitaxial growth of microstructured branches and conjoined nanorods depending on the hydrothermal conditions (concentration, temperature, and ionic strength).
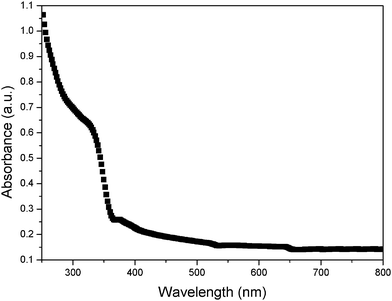
In this work, the photocatalytic activities of the ZnO samples were evaluated for the photocatalytic degradation of RB under ultraviolet and visible light irradiation. Fig. 6a shows the absorbance of RB as a plot of the irradiation time for resultant hierarchical ZnO microrods under ultraviolet and visible light irradiation. The photocatalytic activities of traditional ZnO nanoparticles and a aligned ZnO nanorod array were used as a photocatalytic references to evaluate the photoactivity of the hierarchical ZnO microrods. Under ultraviolet light irradiation, the presence of ZnO nanoparticles has no notable effect on the photodegradation of RB, whereas the hierarchical ZnO microrods in Fig. 4c and Fig. 1b exhibit higher photocatalytic activities than the ZnO nanoparticles and aligned ZnO nanorods. The major absorption peaks of RB at around 553 nm diminished gradually under ultraviolet light irradiation in the presence of ZnO samples. Meanwhile, the color of the suspension changed gradually, suggesting that the chromophoric structure of Rhodamine B had decomposed. The hierarchical ZnO microrods in Fig. 4c have the highest activity, which is increased about 3-fold compared to that for ZnO nanoparticles. Under visible light irradiation (Fig. 6c), all the ZnO samples exhibited notable but much lower degradation of RB than that under ultraviolet irradiation. The kinetics of the photodegradation of RB in the presence of ZnO nanoparticles, hierarchical ZnO microrods and aligned ZnO nanorods are also studied. The ln(A0/A) of these samples present good linear reaction with the irradiation time (shown in Fig. 6b and Fig. 6d), which means that the photodegradation of RB obeys the rules of a first-order reaction kinectics ln(C0/C) = kt. According to the Lambert–Beer law, the absorbency A is in direct proportion to concentration C, so, the absorbency A0 and A at original state and t are used to replace concentrations C0 and C, respectively. The larger the reaction rate constant k, the higher photocatalytic activity. It can be seen that k is extremely low for ZnO nanoparticles and aligned ZnO nanorods both under ultraviolet and visible light irradiation. The constant k is significantly enhanced in the case of hierarchical ZnO microrods for both ultraviolet and visible light irradiation. The significant enhancement of photocatalytic activities is believed to depend on the morphologies and size of the ZnO samples.15 The dense and smaller ZnO in Fig. 4c can provide a larger surface area and more positive conduction band, which facilitate the injection of electrons from the excited dye molecule to the ZnO conduction band and the formation of active oxygen species. The UV-vis spectrum of the ZnO in Fig. 4c is shown in Fig. 7. Absorptions at around 331 nm and 378 nm are observed. The presence of the broad absorption at 378 nm might explain the high photocatalytic efficiency for RB.
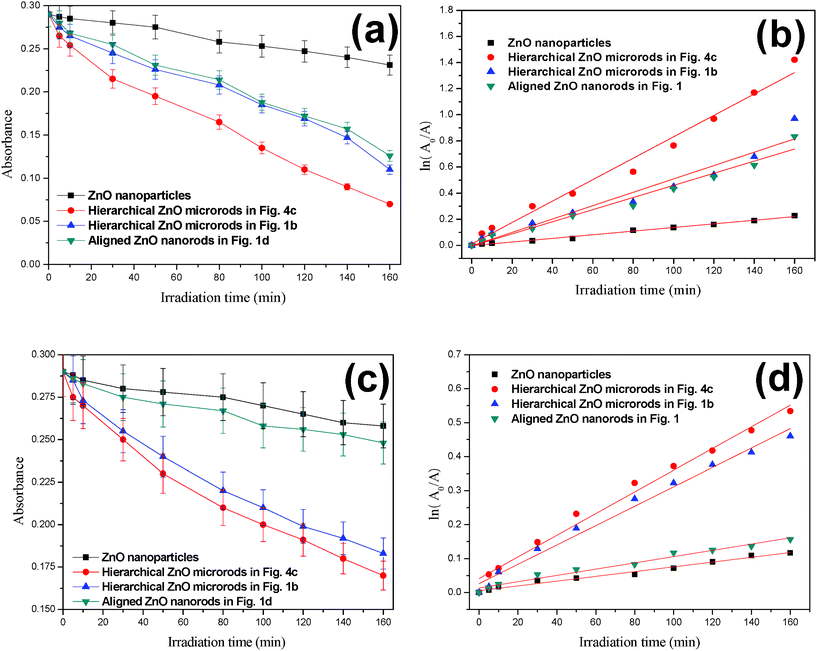 | ||
| Fig. 6 The photocatalytic degradation of RB under (a) ultraviolet and (c) visible light irradiations, and the ln(A0/A) versus irradiation time based on first-order reaction kinetics under (b) ultraviolet and (d) visible light irradiation in the presence of traditional ZnO nanoparticles, hierarchical ZnO microrods, and aligned ZnO nanorods. | ||
The mechanism of photocatalytic degradation of RB molecules under visible light excitation is different from the traditional mechanism under UV irradiation. In this work, the RB is subject to visible light excitation. The excited RB molecules than transfer electrons into the conduction band of the ZnO, leading to the formation of cationic radicals of RB. The injected electrons then react with the oxygen adsorbed on the surface of the ZnO and generate a series of reactive oxygen species. The subsequent radical chain reactions involving reactive oxygen species and the RB molecule lead to the degradation and mineralization of the RB.16,17 The data provide an excellent route to optimize the photocatalytic activity of the ZnO-based photocatalysts.
4. Conclusions
In summary, thin films of hierarchical ZnO microstructures over a large surface area are grown on the upward surface of a Si substrate by a low-temperature hydrothermal method. The morphology and size can be easily controlled by changing reaction conditions, such as temperature, concentration, and ionic strength. The hierarchical ZnO microstructures with multiple functions enable them to be potential candidates as building blocks for the development of novel optoelectronic devices and catalysts.Acknowledgements
The authors gratefully acknowledge the financial support of the Gutenberg foundation, National High Technology Research and Development Program of China (No. 2009AA03Z217), the National Natural Science Foundation of China (No. 90922028).References
- H. Zhou, T. X. Fan and D. Zhang, ChemSusChem, 2011, 4, 1344–1387 CrossRef CAS.
- H. M. Cheng and W. F. Hsieh, Energy Environ. Sci., 2010, 3, 442–447 CAS.
- Z. Chen and M. H. Cao, Mater. Res. Bull., 2011, 46, 555–562 CrossRef CAS.
- P. Jiang, J. J. Zhou, H. F. Fang, C. Y. Wang, Z. L. Wang and S. S. Xie, Adv. Funct. Mater., 2007, 17, 1303–1310 CrossRef CAS.
- H. Zhou, X. F. Li, T. X. Fan, F. E. Osterloh, J. Ding, E. M. Sabio, D. Zhang and Q. X. Guo, Adv. Mater., 2010, 22, 951–956 CAS.
- F. Lu, W. P. Cai and Y. G. Zhang, Adv. Funct. Mater., 2008, 18, 1047–1056 CrossRef CAS.
- H. Choi, A. C. Sofranko and D. D. Dionysiou, Adv. Funct. Mater., 2006, 16, 1067–1074 CrossRef CAS.
- X. F. Gao and L. Jiang, Nature, 2004, 432, 36 CrossRef CAS.
- Z. L. Wang and J. H. Song, Science, 2006, 312, 242–246 CrossRef CAS.
- G. Z. Shen, Y. Bando, B. D. Liu, D. Golberg and C. J. Lee, Adv. Funct. Mater., 2006, 16, 410–416 CrossRef CAS.
- B. H. Juarez, P. D. Garcia, D. Golmayo, A. Blanco and C. Lopez, Adv. Mater., 2005, 17, 2761–2765 CrossRef CAS.
- L. Vayssieres, K. Keis, S. E. Lindquist and A. Hagfeldt, J. Phys. Chem. B, 2001, 105, 3350–3352 CrossRef CAS.
- L. Vayssieres, Adv. Mater., 2003, 15, 464–466 CrossRef CAS.
- W. J. Li, E. W. Shi, W. Z. Zhong and Z. W. Yin, J. Cryst. Growth, 1999, 203, 186–196 CrossRef CAS.
- J. Becker, K. R. Raghupathi, J. S. Pierre, D. Zhao and R. T. Koodali, J. Phys. Chem. C, 2011, 115, 13844–13850 CAS.
- T. Wu, G. Liu, J. Zhao, H. Hidaka and N. Serpone, J. Phys. Chem. B, 1998, 102, 5845–5851 CrossRef CAS.
- F. Zhang, J. Zhao, T. Shen, H. Hidaka, E. Pelizzetti and N. Serpone, Appl. Catal., B, 1998, 15, 147–156 CrossRef CAS.
| This journal is © The Royal Society of Chemistry 2012 |

