Chemical-free growth of metal nanoparticles on graphene oxide sheets under visible light irradiation†
Gun-hee
Moon
a,
Hyoung-il
Kim
b,
Yongsoon
Shin
c and
Wonyong
Choi
*ab
aDepartment of Chemical Engineering, Pohang University of Science and Technology (POSTECH), Pohang, 790-784, Korea. E-mail: wchoi@postech.edu; Fax: +82-54-279-8299
bSchool of Environmental Science and Engineering, Pohang University of Science and Technology (POSTECH), Pohang, 790-784, Korea
cChemical and Materials Science Division, Pacific Northwestern National Laboratory, 902 Battelle Boulevard, P.O. Box 999, Richland, Washington
First published on 20th January 2012
Abstract
In the presence of silver or gold ions, visible light irradiation (> 420 nm) induces the formation of metal nanoparticles on graphene (GO) sheets without the need of any chemical reducing reagents. GO sheets serve as not only a good substrate for dispersion of metal nanoparticles but also a self-reactive material itself for the photo-induced reduction of metal ions.
Graphene oxide (GO), a monolayer of sp2 and sp3 bonded carbon atoms hexagonally arrayed into a two-dimensional (2D) honeycomb lattice, is a well-known precursor for the preparation of reduced graphene oxide (r-GO).1 GO can be easily synthesized on a large scale by the modified Hummer method and has attracted great attention due to its unique properties such as high specific surface area, high stability against aggregation, and acidic properties associated with a number of oxygen-containing functional groups.2 Furthermore, GO is known to be a good substrate for the dispersion of metal or semiconductor nanoparticles (NPs) because functional groups such as hydroxyl, carbonyl, and epoxy can act as nucleation sites.3 Accordingly, diverse methods including chemical reduction,4 photochemical reduction,5sonication,6 thermal reduction,7 UV irradiation,8 spontaneous reduction,9 and vacuum filtering10 have been reported for the preparation of graphene-based composites with various metal NPs. However, those methods require either toxic reducing agents and/or intensive energy consumption for the reduction of metal ions, which makes the processes less environment-friendly. The photochemical method is a favoured method since it is clean and easy to control. Even though the deposition of metal NPs on carbonaceous materials such as fullerene and carbon nanotube has been previously investigated, they have all been prepared under intensive radiation such as laser, UV, or electron beam.11 In this respect, the utilization of visible light in the preparation process is highly desirable because it is abundant in solar light, safe, less costly, and less damaging to materials. However, no study of visible light utilization has been reported for the deposition of metal NPs on GO or r-GO. Although Yeh et al. recently reported the visible light activity of graphite oxide for the photocatalytic water-splitting, the completely oxidized and monolayered GO is not semiconductor but insulator.12 Therefore, its chemical and physical properties are significantly different from those of partially oxidized graphite oxide.
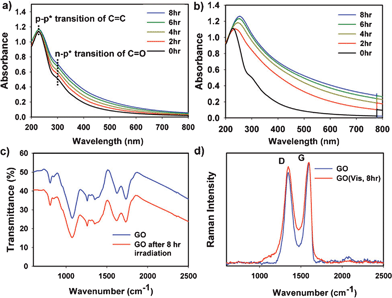
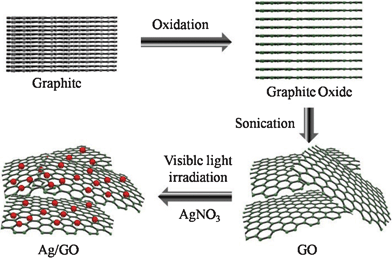
In this communication, we report a new and clean method for the photochemical loading of silver NPs on GO under visible light radiation (> 420 nm) without using any chemical reducing reagents (Scheme 1). The color of the GO solution became a little darker after visible light irradiation. The UV–Visible spectra of the GO solution (Fig. 1a) during visible light irradiation shows that two absorption peaks (attributed to the π–π* transition of carbon double bonds at near 228 nm and the n–π* transition of carbonyl groups at around 300 nm) remained the same but the absorbance background was raised.13 A similar observation has been previously reported when nano-sized GO (NGO) was treated with chloroacetic acid under strongly basic condition, where the darkening in VIS–near IR region was attributed to the structural changes of NGO induced by epoxy opening and hydrolysis of esters.14 As a control, the GO solution was chemically reduced to r-GO by hydrazine at high pH, the peak at 228 nm was shifted to 268 nm and the absorbance background significantly increased while changing the color of the solution from bright brown to black (Fig. S1, ESI†). Similarly, under UV light irradiation (> 295 nm), the reduction of GO was observed along with the spectral shift (Fig. 1b). On the other hand, the peak at 228 nm remained unchanged throughout the visible light irradiation (from 0 to 8 h), which indicates that visible light cannot recover sp2 carbons but induces minor structural changes (e.g., epoxy opening, hydrolysis of esters, or splitting GO sheets).
 | ||
| Fig. 1 UV/Visible absorption spectra of the GO solution and their change under (a) visible and (b) UV light irradiation. (c) FT-IR spectra of GO before and after visible light irradiation. (d) Raman spectra of GO films before and after visible light irradiation. | ||
 | ||
| Scheme 1 Illustration of the formation of silver nanoparticles on graphene oxide sheets under visible light irradiation. | ||
As shown Fig. 1c, most oxygen-containing functional groups on GO remained the same, but the intensities of C![[double bond, length as m-dash]](https://www.rsc.org/images/entities/char_e001.gif) O (νC
O (νC![[double bond, length as m-dash]](https://www.rsc.org/images/entities/char_e001.gif) O at 1734 cm−1) and C–O (epoxy or alkoxy, νC–O at 1075 cm−1) were slightly different before and after visible light irradiation.15Raman spectroscopy also supported that visible light irradiation did not bring about electronic and structural transformation of GO (Fig. 1d). While the G band (representing the degree of graphitization) was not changed, the D band (representing the disorder) slightly increased due to the introduction of a few defects.16 Although the 2D band is a finger print region, the intensity was quite low to be useful in this case. To further investigate the change of the functionality of GO, the solution containing GO or the visible light-irradiated GO was titrated with NaOH (see Fig. S2, ESI†). Interestingly, the visible light irradiated GO solution exhibited a slightly higher buffering capacity, which means that more acidic functional groups were presumably generated after irradiation. Therefore, the visible light irradiation can partially transform the structure of GO, but cannot reduce GO into r-GO ,unlike UV light irradiation. To verify specific structural changes of GO under visible light irradiation, further study is needed.
O at 1734 cm−1) and C–O (epoxy or alkoxy, νC–O at 1075 cm−1) were slightly different before and after visible light irradiation.15Raman spectroscopy also supported that visible light irradiation did not bring about electronic and structural transformation of GO (Fig. 1d). While the G band (representing the degree of graphitization) was not changed, the D band (representing the disorder) slightly increased due to the introduction of a few defects.16 Although the 2D band is a finger print region, the intensity was quite low to be useful in this case. To further investigate the change of the functionality of GO, the solution containing GO or the visible light-irradiated GO was titrated with NaOH (see Fig. S2, ESI†). Interestingly, the visible light irradiated GO solution exhibited a slightly higher buffering capacity, which means that more acidic functional groups were presumably generated after irradiation. Therefore, the visible light irradiation can partially transform the structure of GO, but cannot reduce GO into r-GO ,unlike UV light irradiation. To verify specific structural changes of GO under visible light irradiation, further study is needed.
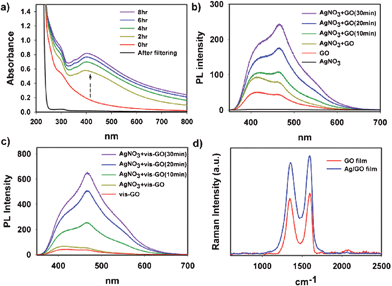
Herein, we also observed that the addition of silver ions into GO solution under visible light irradiation induced the formation of relatively symmetric surface plasmon resonance (SPR) band centered around 400 nm, which indicates the formation of spherical silver NPs on GO sheets (Fig. 2a).17 The SPR band disappeared when the Ag/GO solution was filtered by 0.45-μm PTFE syringe filter (Millipore), which means most of silver NPs are deposited on GO sheets. Similarly, the SPR band near 563 nm was also observed upon the addition of the gold precursor under the same condition (Fig. S3, ESI†).18 As a control experiment, only AgNO3 (without GO) was irradiated for 8 h under visible light, but did not show any appearance of the SPR band (Fig. S4, ESI†). Moreover, a thermal control experiment in which the mixture of AgNO3 and GO was heated at 50 °C for 8 h, but did not show any SPR band, either (Fig. S5, ESI†), meaning there is no possible thermal effect. Therefore, the generation of Ag NPs on GO should be mediated by visible light which induces electron transfer between the silver ions and GO (as an electron donor) or by the attractive interaction between Ag NPs and GO.
 | ||
| Fig. 2 (a) UV/Visible absorption spectra of (GO+Ag+) solution under visible light irradiation. (b, c) Photoluminescence emission spectra of (GO+Ag+) and (vis-GO+Ag+) solution under visible light, respectively. “vis-GO” indicates that the solution of GO was pre-irradiated for 8 h under visible light prior to adding AgNO3. The time in the parenthesis indicates the visible light irradiation time after adding AgNO3. (d) Raman spectra of GO and Ag/GO films. Ag/GO film was obtained after visible light irradiation in the presence of AgNO3 for 8 h. | ||
The mutual interaction was indirectly probed and confirmed by the PL measurement. The PL intensity of GO was significantly enhanced in the presence of silver ions as shown in Fig. 2b. This should be ascribed to the complexation between negatively charged functional groups (or sp2 domains on GO) and silver ions, which may generate more radiative centers.19 When the (GO+Ag+) solution was irradiated with visible light, the PL intensity further increased due to the formation of silver NPs. The enhancement of the PL intensity for Ag/GO or Ag/r-GO was already reported.20 However, the irradiated AgNO3 solution showed no PL. It is interesting to note that pre-irradiation of GO solution prior to adding silver ions induced higher PL intensity (Fig. 2c). This result is probably due to partial changes of functional groups on GO after visible light irradiation, and the structural changes increase the interaction between the GO sheets and silver ions.
The formation of silver NPs on GO sheets was also confirmed in various ways. Raman spectra show that local electromagnetic field enhancement induced by silver NPs increased the intensity of both the G and D bands (Fig. 2d). X-ray photoelectron spectroscopy (XPS) and X-ray powder diffraction (XRD) analysis also confirmed the existence of silver NPs on GO sheets (Fig. S6, ESI†). In the XRD spectrum, the peaks that can be assigned to (111), (200), (220), and (311) planes of metallic silver were clearly observed with Ag/GO (Fig. S6a, ESI†).4 Furthermore, the maximum peak of graphite oxide, near 11°, almost disappeared with the formation of Ag NPs on the GO (after sonication and irradiation in the presence of silver ions), which indicates that silver NPs were located between GO sheets and acted as spacers in the process of restacking of individual Ag/GO sheets. From XPS of C1s (Fig. S6b, ESI†), it is confirmed that the functional groups on GO still remained after loading Ag NPs. This implies that the composite would have a promising potential for the utilization as a carbocatalyst or base material for multifunctional composites.21 The binding energies of Ag 3d5/2 (368.3 eV) and 3d3/2 (374.3 eV) show that most of silver NPs have an Ag0 state (Fig. S6c, ESI†).22
The 3-dimensional AFM image (Fig. S7a†) shows that the silver NPs are well dispersed on single sheets of GO. The height profile indicates the thickness of GO is about 0.96 nm, which is consistent with the reported thickness of monolayer GO, and the size of silver NPs is below 10 nm. The intercalated Ag NPs between GO layers were also confirmed by the cross sectional FE-SEM (Fig. S7b, ESI†).
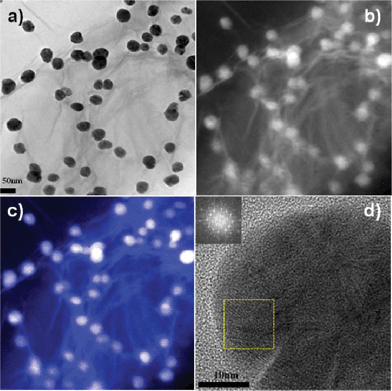
As shown in the bright field (Fig. 3a) and dark field (Fig. 3b) of the TEM images, the size of silver NPs was a little bigger than that in the AFM image. Unfortunately, it is hard to expect the burst-nucleation in this experimental condition. It could be explained that silver NPs have a relatively broad size distribution. Therefore, it is highly required to control the size of Ag NPs by changing some parameters including irradiation time, light intensity, and light source.23Carbon (blue) and silver NPs (white) within Ag/GO composites were clearly observed by EELS mapping (Fig. 3c), and the HRTEM and fast-Fourier-transform (FFT) image showed that the silver NP possessed high crystallinity in a localized region (Fig. 3d).
 | ||
| Fig. 3 (a) The bright field and (b) dark field of TEM images of silver NPs dispersed on GO sheets. (c) Electron energy-loss spectroscopy mapping showing the elemental distribution of carbon (blue) and silver (white) within Ag/GO composite. (d) High resolution TEM (HRTEM) image and selected area Fourier transform (FFT) analysis of a silver NP showing the crystalline silver in a localized region. | ||
In conclusion, we observed the change of properties of GO under visible light irradiation, and this behaviour was utilized for the deposition of metal NPs on GO. In the presence of silver or gold ions, the visible light irradiation of GO solution induced the appearance of the surface plasmon resonance band due to the formation of metal NPs on GO. A number of functional groups and high specific surface areas made GO suitable not only as a good substrate for the dispersion of metal NPs but also as a self-reactive material itself for the photoreduction of metal ions. Furthermore, the selective deposition of metal NPs on GO (without reducing it to r-GO and retaining most of the functional groups) will enable the preparation of metal/GO-based catalysts. The photochemical activation of GO by visible light will also provide an environmentally friendly way of preparing GO-based nano-composites. Incidentally, the present method of visible light-induced deposition of metal NPs may be applied to other carbon-based substrates with oxygen-containing functional groups (e.g., crystalline cellulose, carbon spheres), which can be subject of further investigation.
Acknowledgements
This work was supported by the Korea government (MEST through NRF) projects: KOSEF NRL program (No. R0A-2008-000-20068-0); the Global Frontier R&D Program on Center for Multiscale Energy System (2011-0031571); the Korea Center for Artificial Photosynthesis (KCAP: Sogang Univ.) (NRF-2011-C1AAA001-2011-0030278).References
- (a) A. K. Geim and K. S. Novoselov, Nat. Mater., 2007, 6, 183 CrossRef CAS; (b) G. Eda and M. Chhowalla, Adv. Mater., 2010, 22, 1 CrossRef; (c) M. J. Allen, V. C. Tung and R. B. Kaner, Chem. Rev., 2010, 110, 132 CrossRef CAS.
- (a) Y. Zhu, S. Murali, W. Cai, X. Li, J. W. Suk, J. R. Potts and R. S. Ruoff, Adv. Mater., 2010, 22, 3906 CrossRef CAS; (b) D. R. Dreyer, H. Jia and C. W. Bielawski, Angew. Chem., 2010, 122, 6965 CrossRef; (c) S. Park and R. S. Ruoff, Nat. Nanotechnol., 2009, 4, 217 CrossRef CAS.
- (a) H. Bai, C. Li and G. Shi, Adv. Mater., 2011, 23, 1089 CrossRef CAS; (b) C. Xu, X. Wang and J. Zhu, J. Phys. Chem. C, 2008, 112, 19841 CrossRef CAS; (c) G. Williams, B. Seger and P. V. Kamat, ACS Nano, 2008, 2, 1487 CrossRef CAS.
- C. Xu and X. Wang, Small, 2009, 5, 2212 CrossRef CAS.
- G. Moon, Y. Park, W. Kim and W. Choi, Carbon, 2011, 49, 3454 CrossRef CAS.
- K. Vinodgopal, B. Neppolian, I. V. Lightcap, F. Grieser, M. Ashokkumar and P. V. Kamat, J. Phys. Chem. Lett., 2010, 1, 1987 CrossRef CAS.
- X. Zhou, X. Huang, X. Qi, S. Wu, C. Xue, F. Y. C. Boey, Q. Yan, P. Chen and H. Zhang, J. Phys. Chem. C, 2009, 113, 10842 CAS.
- X. Huang, X. Zhou, S. Wu, Y. Wei, X. Qi, J. Zhang, F. Boey and H. Zhang, Small, 2010, 6, 513 CrossRef CAS.
- X. Chen, G. Wu, J. Chen, X. Chen, Z. Xie and X. Wang, J. Am. Chem. Soc., 2011, 133, 3693 CrossRef CAS.
- B.-S. Kang, J. Geng and H.-T. Jung, Chem. Commun., 2009, 2174 Search PubMed.
- (a) W. Song, C. Jeon, M. Kim, Y. T. Kwon, D. S. Jung, S. Y. Kim, W. S. Jung, Y. Kim, S. Y. Lee, W. C. Choi, Y. H. Hand, B. C. Lee and C.-Y. Park, Carbon, 2011, 49, 1692 CrossRef CAS; (b) N. Tanaka, H. Nishikiori, S. Kubota, M. Endo and T. Fujii, Carbon, 2009, 47, 2752 CrossRef CAS.
- T. Yeh, J. Syu, C. Cheng, T. Chang and H. Teng, Adv. Funct. Mater., 2010, 20, 2255 CrossRef CAS.
- D. Li, M. B. Muller, S. Gilje, R. B. Kaner and G. G. Wallace, Nat. Nanotechnol., 2008, 3, 101 CrossRef CAS.
- X. Sun, Z. Liu, K. Welsher, J. T. Robinson, A. Goodwin, S. Zaric and H. Dai, Nano Res., 2008, 1, 203 CrossRef CAS.
- (a) S. Stankovich, R. D. Piner, S. T. Nguyen and R. S. Ruoff, Carbon, 2006, 44, 3342 CrossRef CAS; (b) H. Guo, X. Wang, Q. Qian, F. Wang and X. Xia, ACS Nano, 2009, 3, 2653 CrossRef CAS.
- A. C. Ferrari, J. C. Meyer, V. Scardaci, C. Casiraghi, M. Lazzeri, F. Mauri, S. Piscanec, D. Jiang, K. S. Novoselov, S. Roth and A. K. Geim, Phys. Rev. Lett., 2006, 97, 187401 CrossRef CAS.
- I. Pastoriza-Santos and L. M. Liz-Marzan, Langmuir, 1999, 15, 948 CrossRef CAS.
- S. K. Ghosh and T. Pal, Chem. Rev., 2007, 107, 4797 CrossRef CAS.
- J.-L. Chen and C.-Q. Ahu, Anal. Chim. Acta, 2005, 546, 147 CrossRef CAS.
- R. Pasricha, S. Gupta and A. K. Srivastava, Small, 2009, 5, 2253 CrossRef CAS.
- S. Park, J. An, I. Jung, R. D. Piner, S. J. An, X. Li, A. Velamakanni and R. S. Ruoff, Nano Lett., 2009, 9, 1593 CrossRef CAS.
- H. Jiang, L. Zhu, K. Moon and C. P. Wong, Carbon, 2007, 45, 655 CrossRef CAS.
- M. Lanz, D. Schurch and G. Calzaferri, J. Photochem. Photobiol. A:Chem., 1999, 120, 105 CrossRef CAS.
Footnote |
| † Electronic supplementary information (ESI) available: Experimental details. UV/Vis absorbance, Titration, XRD, XPS, AFM and SEM image. See DOI: 10.1039/c2ra00875k |
| This journal is © The Royal Society of Chemistry 2012 |
