Luminescence functionalization of MCM-48 by YVO4:Eu3+ for controlled drug delivery
Shili
Gai
a,
Piaoping
Yang
*a,
Dong
Wang
a,
Chunxia
Li
b,
Na
Niu
a,
Fei
He
a,
Milin
Zhang
a and
Jun
Lin
*b
aKey Laboratory of Superlight Materials and Surface Technology, Ministry of Education, Harbin Engineering University, Harbin, China. E-mail: yangpiaoping@hrbeu.edu.cn
bState Key laboratory of Rare Earth Rare Resource Utilization, Changchun Institute of Applied Chemistry, Chinese Academy of Sciences, Changchun, China. E-mail: jlin@ciac.jl.cn
First published on 22nd February 2012
Abstract
A bifunctional (mesoporous, luminescent) composite was realized by depositing a YVO4:Eu3+ phosphor layer onto the surface of MCM-48 spheres via a simple sol–gel process. This composite was employed as a drug delivery/release carrier using captopril (CapH2) as a model drug. X-ray diffraction (XRD), transmission electron microscopy (TEM), Fourier transform infrared spectroscopy (FT-IR), N2 adsorption/desorption and photoluminescence spectra were employed to characterize the as-prepared materials. The results indicated that the bifunctional composite possesses an ordered mesoporous structure and strong red luminescence of Eu3+. A drug release test revealed that the composite has favorable drug release properties. Additionally, the CapH2-loaded composite still shows the red luminescence under UV irradiation. Also, the emission intensity of Eu3+ increases with an increase in the cumulative released amount of CapH2, making the extent of drug release easy to identify, track and monitor by the change of luminescence during the release process and disease therapy.
1. Introduction
Recently, luminescence-functionalized mesoporous composites have drawn much attention due to their multifunctional properties, such as a high pore volume, large surface area and luminescence properties. Thus, they are believed to have great potential applications in the fields of bioimaging, drug delivery, diagnosis, therapy, sensing, optical memories and light collectors in solar cells.1 Especially in controlled drug delivery systems, these composite materials not only maintain a constant drug release rate and minimize drug toxic effects throughout the dosage period,2 but also provide photoluminescence properties, which can be monitored to evaluate the efficiency of drug release.Among the various mesoporous structures, their non-toxic nature, good biocompatibility and suitable pore size make mesoporous silica materials excellent candidates for controlled drug delivery. Research has been extensively focused on MCM-41 with unconnected 2D hexagonal pores3 and SBA-15 with lateral connected pores.4 There are few papers about the cubic Ia3d mesostructural MCM-48 with 3D interconnected pores,5 which is probably due to the relative difficulty in producing this mesostructure, which consists of two interpenetrating continuous networks of chiral channels.6 This interesting 3D channel network is considered to offer a highly open mesoporous host, resulting in easy and direct access for guest species, thus facilitating incorporation or diffusion throughout the pore channels.6c
In addition, for the safe and efficient luminescent materials, rare earth (RE) doped oxide phosphor which can be used in biological applications is an attractive choice. Compared with organic dyes (which exhibit rapid photobleaching and a low fluorescence quantum yield (QY)7) and quantum dots (which are less chemically stable, potentially toxic with fluorescence intermittence8), RE-doped oxide nanophosphors possess many wonderful characteristics, including sharp emission lines, a long lifetime and high luminescence quantum yield (QY).9 In particular, Eu3+-activated yttrium vanadate (YVO4), which displays outstanding luminescent properties arising from the 4f electron configuration, is an important commercial red phosphor (5D0→7F2 of Eu3+ at 617 nm) used in optical devices, laser host materials, cathode ray tubes and high-pressure mercury lamp.10
Although self-activated luminescent hydroxyapatite-coated MCM-48 has been reported for drug release,6d their fluorescent efficiency and decay time should be much lower than those of the samples with RE-derived luminescence based on their luminescence mechanism.9e,10e,11 In particular, the PL intensity and color of RE-based composites can easily be tuned by doping with different kinds of RE ions. Therefore, the design of a bifunctional composite combining the mesoporous properties, spherical shape and RE-based luminescence should have high potential in drug delivery and biomedical fields.
Herein, spherical MCM-48-type mesoporous silica was synthesized through a simple and modified Stöber method, and luminescence functionalization was realized by depositing YVO4:Eu3+ onto the surface of MCM-48 via a Pechini sol–gel process,12 resulting in the formation of a luminescent and mesoporous material. The obtained composite was well characterized by means of XRD, TEM, FT-IR, N2 adsorption/desorption and luminescence spectra. In addition, water-soluble drug captopril (CapH2) with a molecule size of 9.0 × 5.7 × 3.3 Å was selected as a model drug to study the drug release properties of the composite in the release media of simulated body liquid. It is shown that the emission intensity of Eu3+ increases with increasing cumulative drug released in the system, making the extent of drug release easy to identify, track and monitor by the change of luminescence.
2. Experimental section
2.1. Synthesis of MCM-48@YVO4:Eu3+
In a modified process,13 2.6 g of cetyltrimethylammonium bromide (CTAB) was dissolved in a mixture of 50 mL of ethanol, 120 mL of deionized water and 12 mL of aqueous ammonia (32 wt%) by stirring. Then, 3.4 g of tetraethyl orthosilicate (TEOS) was added into the mixture and stirred for 2 h at room temperature. The resulting solid was collected by filtration, washed several times with distilled water and dried in air at ambient temperature. The as-synthesized material was calcined from room temperature to 550 °C with a heating rate of 1 °C min−1, and kept at 550 °C for 6 h to remove the templates, then the MCM-48-type mesoporous silica was obtained.Deposition of a YVO4:Eu3+ phosphor layer onto the surface of MCM-48 was prepared by a Pechini sol–gel process.12 The doping concentration of Eu3+ was 5 mol% of Y3+ in YVO4.10e Typically, stoichiometric weights of Y2O3 (99.99%, Sinopharm Chemical Reagent Co., Ltd), Eu2O3 (99.99%, Sinopharm Chemical Reagent Co., Ltd) and NH4VO3 (A. R., Tianjin Damao Chemical Instrument Company) were dissolved in dilute HNO3 and then added to a water–ethanol solution. Then, citric acid, with a molar ratio of 2![[thin space (1/6-em)]](https://www.rsc.org/images/entities/char_2009.gif) :
:![[thin space (1/6-em)]](https://www.rsc.org/images/entities/char_2009.gif) 1 to metal ions, and polyethylene glycol (PEG, Mw = 10
1 to metal ions, and polyethylene glycol (PEG, Mw = 10![[thin space (1/6-em)]](https://www.rsc.org/images/entities/char_2009.gif) 000), at a concentration of 0.04 g mL−1, were added. Subsequently, the mixture was stirred for 1 h to form a stable sol. Then, the desired amount of MCM-48 powder was added into the sol. This was further stirred for another 3 h and the resulting material was separated by centrifugation. After being dried at 100 °C, the sample was calcined from room temperature to 500 °C with a heating rate of 1 °C min−1 and maintained at 500 °C for 2 h for the crystallization of YVO4:Eu3+. The coating process was repeated three times. In this way, the luminescence functionalized MCM-48 materials were obtained (denoted as MCM-48@YVO4:Eu3+).
000), at a concentration of 0.04 g mL−1, were added. Subsequently, the mixture was stirred for 1 h to form a stable sol. Then, the desired amount of MCM-48 powder was added into the sol. This was further stirred for another 3 h and the resulting material was separated by centrifugation. After being dried at 100 °C, the sample was calcined from room temperature to 500 °C with a heating rate of 1 °C min−1 and maintained at 500 °C for 2 h for the crystallization of YVO4:Eu3+. The coating process was repeated three times. In this way, the luminescence functionalized MCM-48 materials were obtained (denoted as MCM-48@YVO4:Eu3+).
2.2. Preparation of the drug storage/release system
The CapH2 storage system was prepared according to the reported route with some modifications.14 Typically, 0.215 g of MCM-48@YVO4:Eu3+ (or MCM-48) was added to 10 mL of 0.1 M CapH2 solution by stirring for 2 h at room temperature. The CapH2-loaded sample was separated by centrifugation, dried at 60 °C for 12 h and denoted as CapH2–MCM-48@YVO4:Eu3+ (or CapH2–MCM-48).The in vitro delivery test was performed by immersing 0.15 g of the CapH2-loaded sample in 50 mL of the release media of simulated body fluid (SBF) under gentle stirring and the solution temperature was maintained at 37 °C. The ionic composition (Na+/K+/Ca2+/Mg2+/Cl−/HCO3−/HPO42−/SO42− = 142.0/5.0/2.5/1.5/147.8/4.2/1.0/0.5) of the SBF was similar to that of human body plasma (pH = 7.2–7.4).15 At selected time intervals, 0.5 mL of the solution was withdrawn and then centrifuged. The small amount of solid was immediately washed with an equal volume of fresh SBF and then added into the release media. The obtained clear solution was properly diluted and the amount of CapH2 was monitored at 200 nm using a UV-vis spectrophotometer.
The experimental process for the luminescence functionalization of MCM-48 by YVO4:Eu3+, and the subsequent loading and release of CapH2 are schematically depicted in Scheme 1.
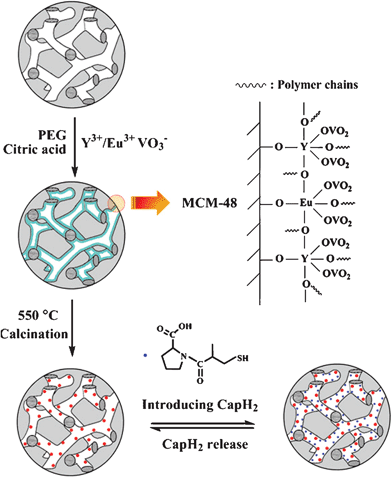 | ||
| Scheme 1 The experimental process for the luminescence functionalization of spherical MCM-48 by YVO4:Eu3+, and the subsequent loading and release of captopril. | ||
2.3. Characterization
X-ray diffraction (XRD) was carried out on a Rigaku-Dmax 2500 diffractometer using Cu-Kα radiation (λ = 0.15405 nm). Transmission electron microscopy (TEM) and high-resolution transmission electron microscopy (HRTEM) were performed on a FEI Tecnai G2 S-Twin transmission electron microscope with a field emission gun operating at 200 kV. Fourier transform IR (FT-IR) spectra were measured on a Perkin-Elmer 580B IR spectrophotometer using the KBr pellet technique. The exact loading level of YVO4:Eu3+ on MCM-48 was determined by inductively coupled plasma (ICP, Thermo Electron XSeries II). The N2 adsorption/desorption isotherm was obtained at 77 K using a Micromeritics ASAP 2010 instrument. The specific surface area was calculated by the Brunauer–Emmett–Teller (BET) method. The pore size distribution was measured using the Barret–Joner–Halenda (BJH) method. The excitation and emission spectra were obtained on a Hitachi F-4500 spectrofluorometer equipped with a 150 W xenon lamp as the excitation source. Luminescence decay curves were obtained from a Lecroy Wave Runner 6100 Digital Oscilloscope (1 GHz) using a 250 nm laser (pulse width = 4 ns, gate = 50 ns) as the excitation source (Continuum Sunlite OPO). The UV-vis absorption was performed on a Shimadzu UV-2450 spectrophotometer. All of the measurements were performed at room temperature.3. Results and discussion
3.1. Phase, structure and morphology
Fig. 1 shows the XRD patterns of MCM-48 and MCM-48@YVO4:Eu3+, respectively. In the low-angle XRD patterns (Fig. 1A), all of the samples exhibit three well-resolved diffraction peaks that can be indexed to (211), (220) and (420) reflections associated with the Ia3d cubic symmetry, confirming a well-ordered mesoporous structure in these materials. In addition, the results also indicate that the ordered cubic mesoporous structure of MCM-48 can be maintained after the deposition of the YVO4:Eu3+ phosphor layer. However, the intensity of these characteristic diffractions decreases apparently after the deposition of YVO4:Eu3+, indicating that the integrity of the mesoporous structure (short range order) is decreased due to the deposition of YVO4:Eu3+ onto the mesoporous framework of MCM-48.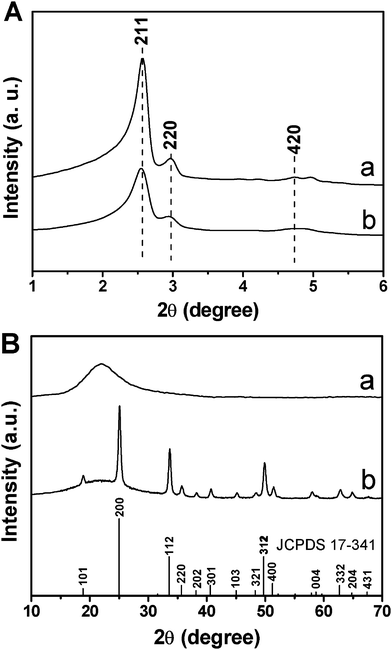 | ||
| Fig. 1 (A) Low-angle and (B) wide-angle XRD patterns of (a) MCM-48 and (b) MCM-48@YVO4:Eu3+. | ||
In the wide-angle XRD patterns (Fig. 1B), the broad band centered at 2θ = 22° for the MCM-48 sample can be assigned to amorphous SiO2 (JCPDS No. 29-0085). While for the YVO4:Eu3+@ MCM-48 sample, besides the broad peak assigned to amorphous silica, the main diffractions at 2θ = 18.82° (101), 24.99° (200), 33.56° (112), 35.63° (220), 38.15° (202), 40.65° (301) and 49.78° (312) can be indexed to a pure tetragonal phase for YVO4 (JCPDS No. 17-0341), indicating the successful crystallization of YVO4:Eu3+ on the surface of mesoporous MCM-48. Additionally, no other phase related to the doped Eu3+ can be detected, revealing the successful substitution of Eu3+ for Y3+ in the YVO4 host. The exact loading level of YVO4:Eu3+ on MCM-48 silica was determined to be 5.9 wt% by ICP measurement.
The morphology, size details, pore geometry and composition of the samples were investigated by TEM, which is exhibited in Fig. 2. The low-magnification TEM image (Fig. 2A) shows that MCM-48 silica consists of spherical particles with a diameter of 200–400 nm. The corresponding high-magnification TEM image (Fig. 2C) clearly shows the typical ordered mesostructure of MCM-48. For the MCM-48@YVO4:Eu3+ sample (Fig. 2B), the spherical morphology of MCM-48 was basically maintained. The high-magnification TEM image of MCM-48@YVO4:Eu3+ (Fig. 2D) also exhibits similar cubic ordered channels of MCM-48, indicating that the mesostructure of MCM-48 is well preserved. In the HRTEM image for the MCM-48@YVO4:Eu3+ sample (Fig. 2E), the distance (0.35 nm) between the adjacent lattice fringes corresponds well to the d(200) spacing (0.355 nm) of YVO4 (JCPDS No. 17-0341). These results further confirm the presence of crystalline YVO4:Eu3+ on the surface of MCM-48, agreeing well with the wide-angle XRD results (Fig. 1B). The EDS result (Fig. 2F) confirms the presence of silicon (Si), oxygen (O), yttrium (Y) and vanadium (V) in the MCM-48@YVO4:Eu3+ sample. The Eu element can't be detected clearly due to its low concentration, but it can be confirmed by the emission spectra in following section.
![Low-magnification TEM images of (A) MCM-48 and (B) MCM-48@YVO4:Eu3+, high-magnification TEM images of (C) MCM-48 and (D) YVO4:Eu3+@MCM-48 along the [110] direction (insets are the corresponding TEM images along the [111] direction), (E) HRTEM image and (F) EDS of MCM-48@YVO4:Eu3+.](/image/article/2012/RA/c2ra00862a/c2ra00862a-f2.gif) | ||
| Fig. 2 Low-magnification TEM images of (A) MCM-48 and (B) MCM-48@YVO4:Eu3+, high-magnification TEM images of (C) MCM-48 and (D) YVO4:Eu3+@MCM-48 along the [110] direction (insets are the corresponding TEM images along the [111] direction), (E) HRTEM image and (F) EDS of MCM-48@YVO4:Eu3+. | ||
The FT-IR spectra of MCM-48, MCM-48@YVO4:Eu3+, CapH2-MCM-48@YVO4:Eu3+ and pure CapH2 are shown in Fig. 3. For the MCM-48 sample (Fig. 3A), the characteristic bands of Si-O (δ, 462 cm−1), Si-OH (υs, 967 cm−1), Si-O-Si (υs, 1089 cm−1, υas, 798 cm−1), OH (3444 cm−1) and H2O (1639 cm−1) (where υs represents symmetric stretching, υas asymmetric stretching and δ bending) are present.16 For the MCM-48@YVO4:Eu3+ sample (Fig. 3B), all of the characteristic absorption bands of SiO2 can be obviously found. However, the absorption band of the V–O bond in the VO43− group at 833 cm−1 can't be detected due to its relatively low intensity with respect to that of Si-O-Si at 798 cm−1 (but it can be detected by XRD and emission spectra). The strong bands of OH and H2O reveal that a large amount of OH groups and H2O exist on the surface of MCM-48@YVO4:Eu3+, which play a key role in bonding CapH2 molecules from CapH2–water solution, as shown in the FT-IR spectrum of CapH2–MCM-48@YVO4:Eu3+ sample (Fig. 3C). Three new and strong bonds located at 1721 cm−1 (COO−), 1476 cm−1 and 1443 cm−1 (C–C) assigned to the introduced CapH2 (Fig. 3D) confirm the successful incorporation of CapH2 into the channels of MCM-48@YVO4:Eu3+ sample.17
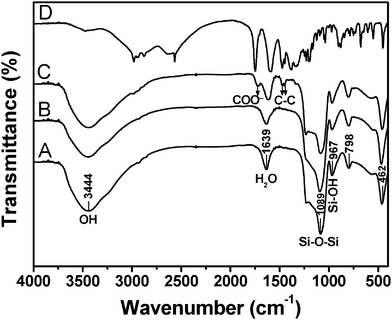 | ||
| Fig. 3 FT-IR spectra of (A) MCM-48, (B) MCM-48@YVO4:Eu3+, (C) CapH2–MCM-48@YVO4:Eu3+ and (D) pure CapH2. | ||
N2 adsorption/desorption isotherms of MCM-48, MCM-48@YVO4:Eu3+ and the corresponding CapH2-loaded samples are depicted in Fig. 4. As shown, all of the samples exhibit IV-type isotherms, indicating the typical mesoporous structure for all of the samples. It can also be deduced that the coating of YVO4:Eu3+ and further loading of CapH2 molecules doesn't change the basic pore structure of MCM-48, which coincides with the low-angle XRD result. The textural characteristics of above materials are summarized in Table 1. It can be seen from the table that MCM-48 possesses a very high BET surface area, large pore volume and suitable pore size for application as a drug carrier, even after coating of a YVO4:Eu3+ layer. As expected, the specific surface area, pore size and pore volume are markedly reduced after CapH2 loading. This result further proves that CapH2 molecules were successfully incorporated into the channels of mesoporous MCM-48.
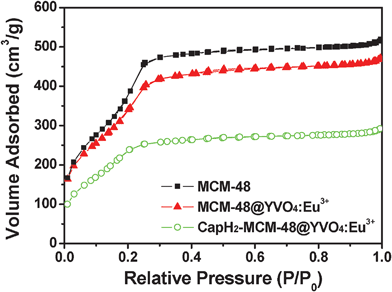 | ||
| Fig. 4 N2 adsorption/desorption isotherms of MCM-48, MCM-48@YVO4:Eu3+ and CapH2–MCM-48@YVO4:Eu3+. | ||
| Samples | D (nm) | S BET (m2 g−1) | V P (cm3 g−1) |
|---|---|---|---|
| MCM-48 | 2.50 | 1634 | 1.005 |
| MCM-48@YVO4:Eu3+ | 2.37 | 1321 | 0.775 |
| CapH2–MCM-48@YVO4:Eu3+ | 1.30 | 309 | 0.30 |
3.2. Luminescent properties
The photoluminescent (PL) properties of the samples were characterized by the excitation and emission spectra in Fig. 5. In the excitation spectra of MCM-48@YVO4:Eu3+ and CapH2–MCM-48@YVO4:Eu3+ (Fig. 5A), the strong band at 279 nm can be attributed to the VO43− group.16a,18 The general f–f transition lines of Eu3+ in the longer wavelength region can't be observed due to their weak intensity compared to that of the VO43−. Therefore, it can be deduced that the excitation of Eu3+ is mainly caused by the energy transfer from VO43− to Eu3+, which is consistent with the previous reports.16a,18 Upon excitation into VO43− at 279 nm, the characteristic transition lines from the excited 5D0 level of Eu3+ can be observed in the emission spectra (Fig. 5B). As shown, four main lines at 539, 593, 617, 649, and 698 nm are obvious, which are assigned to the 5D1→7F1 and 5D0→7FJ (J = 1, 2, 3, 4) transitions of Eu3+, respectively. Obviously, the emission spectra are dominated by the red 5D0→7F1 (593 nm) and 5D0→7F2 (617 nm) transitions of the Eu3+.19 It should be noted that no emission can be found from pure MCM-48 (Fig. 5B(c)). The luminescent intensity of CapH2–MCM-48@YVO4:Eu3+ sample is decreased to a half of MCM-48@YVO4:Eu3+, which may be related to the loading of a CapH2 molecule. However, this luminescent intensity is still strong enough to be easily tailored, tracked and monitored during the drug release process, suggesting its potential application in the biomedical field.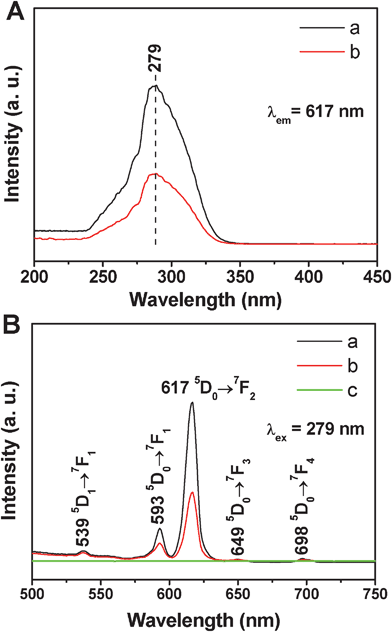 | ||
| Fig. 5 (A) Excitation spectra of (a) MCM-48@YVO4:Eu3+ and (b) CapH2–MCM-48@YVO4:Eu3+; (B) emission spectra of (a) MCM-48@YVO4:Eu3+, (b) CapH2–MCM-48@YVO4:Eu3+ and (c) pure MCM-48. | ||
The decay curves for the 5D0→7F2 (617 nm) of Eu3+ in MCM-48@YVO4:Eu3+ and CapH2–MCM-48@YVO4:Eu3+ samples are presented in Fig. 6. It can be seen that both decay curves can be fitted into a single-exponential function as I = I0 exp(−t/τ) (I0 is the initial emission intensity at t = 0 and τ is the 1/e lifetime of the emission center). The calculated average lifetimes are 0.78 ms and 0.49 ms for MCM-48@YVO4:Eu3+ and CapH2–MCM-48@YVO4:Eu3+, respectively, which basically agree with the reported lifetime values for Eu3+.10e,20
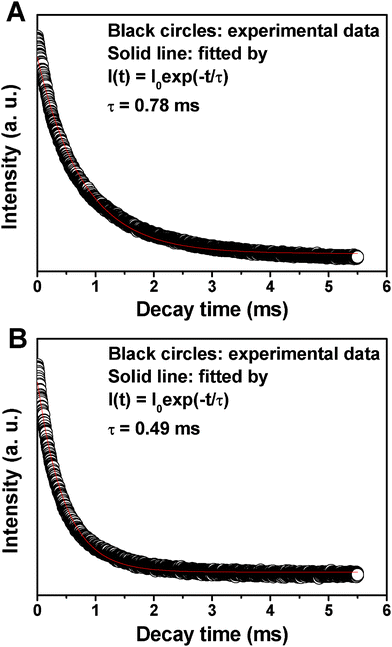 | ||
| Fig. 6 Decay times of (A) MCM-48@YVO4:Eu3+ and (B) CapH2–MCM-48@ YVO4:Eu3+. | ||
3.3. Drug storage/release properties
The CapH2 loading amounts for CapH2–MCM-48 and CapH2–MCM-48@YVO4:Eu3+ are 35.5 wt% and 28.6 wt%, as determined by TG analysis. Although the coating of the YVO4:Eu3+ layer occupies or decreases the pore size to a certain extent, the drug loading amount is only reduced by 6.9%. Therefore, it can be concluded that the CapH2–MCM-48@YVO4:Eu3+ system still shows a relatively high CapH2 storage capacity.During the in vitro CapH2 release study, the corrected concentration of released CapH2 was calculated based on the following equation:21
 | (1) |
Where Ctcorr is the corrected concentration at time t, Ct is the apparent concentration at time t, v is the volume of sample taken and V is the total volume of dissolution medium.
Fig. 7A shows the cumulative drug release profiles of CapH2–MCM-48@YVO4:Eu3+ and CapH2–MCM-48 systems. In the figure, both of the systems show a slow release of CapH2, which may be attributed to the interaction between CapH2 molecules and the mesopore surface, suggesting their potential application in the area of drug delivery. In comparison with the CapH2–MCM-48 system, the CapH2–MCM-48@YVO4:Eu3+ drug release system shows a relatively faster release profile over 72 h. This can be explained as the decrease of surface area and then reduction of the silanol and VO4 groups presented on the mesoporous composite surface, which should be the sites to form hydrogen bonds with the carboxyl groups in CapH2. However, for the CapH2–MCM-48@YVO4:Eu3+ system, 50% of the adsorbed CapH2 is released from the system within 10 h and almost 90% is released within 24 h, exhibiting an obvious sustained property.
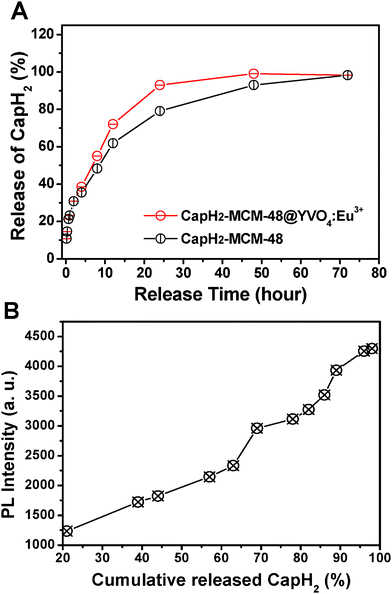 | ||
| Fig. 7 (A) Cumulative release of CapH2 from CapH2–MCM-48@YVO4:Eu3+ and CapH2–MCM-48 as a function of the release time; (B) PL intensity of CapH2–MCM-48@YVO4:Eu3+ as a function of cumulative release of CapH2. | ||
The PL emission intensity of the CapH2–MCM-48@YVO4:Eu3+ sample was investigated as a function of cumulative released amount of CapH2, as shown in Fig. 7B. It can be seen that the PL intensity increases with the cumulative released amount of CapH2 and reaches a maximum when CapH2 release is complete. It is well accepted that the emission of Eu3+ will be quenched to some extent in the environment, which contains a high phonon frequency.22 As for the CapH-loaded sample, the organic groups in CapH2 with tremendous vibration frequencies from 500–4000 cm−1 (shown in Fig. 3D) will greatly quench the emission of Eu3+, which was proved by the PL spectra (Fig. 5). However, with the release of CapH2, its quenching effect will be weakened, resulting in the recovery of the emission intensity. This correlation between the emission intensity and cumulative released amount of CapH2 can be potentially used as a probe for monitoring the drug release process and efficiency in the course of the disease therapy.
4. Conclusion
In summary, we synthesized a novel luminescent and mesoporous MCM-48@YVO4:Eu3+ composite as a carrier for controlled drug release by depositing a YVO4:Eu3+ phosphor layer into the channel surface of mesoporous MCM-48. This system possesses sustained release properties of a drug in an in vitro assay. In addition, the MCM-48@YVO4:Eu3+ system exhibits strong red luminescence, even after the loading of the drug molecules. It is important that the PL intensity increases with the cumulative released amount of drug molecules, which makes the functional drug carrier easy to identify, track and monitor during the drug release and disease therapy process.Acknowledgements
Financial support from National Natural Science Foundation of China (NSFC 20871035), Research Fund for the Doctoral Program of Higher Education of China (20112304110021) and the Fundamental Research Funds for the Central Universities of China (HEUCF201210009) are greatly acknowledged.References
- (a) R. Kumar, I. Roy, T. Y. Ohulchanskyy, L. N. Goswami, A. C. Bonoiu, E. J. Bergey, K. M. Tramposch, A. Maitra and P. N. Prasad, ACS Nano, 2008, 2, 449 CrossRef CAS; (b) L. D. Carlos, R. A. S. Ferreira, V. Z. Bermudez and S. J. L. Ribeiro, Adv. Mater., 2009, 21, 509 CrossRef CAS; (c) J. Sauer, F. Marlow, B. Spliethoff and F. Schüth, Chem. Mater., 2002, 14, 217 CrossRef CAS; (d) Y.-J. Li and B. Yan, Inorg. Chem., 2009, 48, 8276 CrossRef CAS; (e) L. N. Sun, H. J. Zhang, C. Y. Peng, J. B. Yu and Q. G. Meng, J. Phys. Chem. B, 2006, 110, 7249 CrossRef CAS; (f) H. Ow, D. R. Larson, M. Srivastava, B. A. Baird, W. W. Webb and U. Weisner, Nano Lett., 2005, 5, 113 CrossRef CAS.
- (a) B. Wang, T. Siahaan and R. Soltero, Drug Deliv., 2005, 4, 57 Search PubMed; (b) R. Langer, Nature, 1998, 392, 5 CAS.
- (a) M. Vallet-Regi, F. Balas and D. Arcos, Angew. Chem., Int. Ed., 2007, 46, 7548 CrossRef CAS; (b) B. G. Trewyn, S. Giri, I. I. Slowing and V. S. Y. Lin, Chem. Commun., 2007, 3236 RSC; (c) I. Slowing, B. G. Trewyn and V. S.-Y. Lin, J. Am. Chem. Soc., 2006, 128, 14792 CrossRef CAS; (d) B. G. Trewyn, C. M. Whitman and V. S. Y. Lin, Nano Lett., 2004, 4, 2139 CrossRef CAS; (e) F. Torney, B. G. Trewyn, V. S. Y. Lin and K. Wang, Nat. Nanotechnol., 2007, 2, 295 CrossRef CAS; (f) P. P. Yang, Z. W. Quan, L. L. Lu, S. S. Huang and J. Lin, Biomaterials, 2008, 29, 692 CrossRef CAS.
- (a) S. W. Song, K. Hidajat and S. Kawi, Langmuir, 2005, 21, 9568 CrossRef CAS; (b) P. P. Yang, S. S. Huang, D. Y. Kong, J. Lin and H. G. Fu, Inorg. Chem., 2007, 46, 3203 CrossRef CAS.
- (a) M. V. Regı, F. Balas and D. Arcos, Angew. Chem., Int. Ed., 2007, 46, 7548 CrossRef; (b) J. S. Beck, J. C. Vartuli, W. J. Roth, M. E. Leonowicz, C. T. Kresge, K. D. Schmitt, C. T.-W. Chu, D. H. Olson, E. W. Sheppard, S. B. McCullen, J. B. Higgins and J. L. Schlenker, J. Am. Chem. Soc., 1992, 114, 10834 CrossRef CAS.
- (a) T.-W. Kim, F. Kleitz, B. Paul and R. Ryoo, J. Am. Chem. Soc., 2005, 127, 7601 CrossRef CAS; (b) C. T. Kresge, M. E. Leonowicz, W. J. Roth, J. C. Vartuli and J. S. Beck, Nature, 1992, 359, 710 CrossRef CAS; (c) A. Monnier, F. Schuth, Q. Huo, D. Kumar, D. Margolese, R. S. Maxwell, G. D. Stucky, M. Krishnamurty, P. Petroff, A. Firouzi, M. Janicke and B. F. Chmelka, Science, 1993, 261, 1299 CAS; (d) P. P. Yang, P. Yang, X. Teng, J. Lin and L. Huang, J. Mater. Chem., 2011, 21, 5505 RSC.
- K. F. Schrum, J. M. Lancaster, S. E. Johnston and S. D. Gilman, Anal. Chem., 2000, 72, 4317 CrossRef CAS.
- X. Brokmann, J. P. Hermier, G. Messin, P. Desbiolles, J. P. Bouchaud and M. Dahan, Phys. Rev. Lett., 2003, 90 Search PubMed.
- (a) R. A. Fields, M. Birnbaum and C. L. Fincher, Appl. Phys. Lett., 1987, 51, 1885 CrossRef CAS; (b) K. W. Kramer, D. Biner, G. Frei, H. U. Gudel, M. P. Hehlen and S. R. Luthi, Chem. Mater., 2004, 16, 1244 CrossRef; (c) J. Shen, L. D. Sun and C. H. Yan, Dalton Trans., 2008,(42), 5687 RSC; (d) G. C. Li, K. Chao, H. R. Peng and K. Z. Chen, J. Phys. Chem. C, 2008, 112, 6228 CrossRef CAS; (e) C. K. Lin, D. Y. Kong, X. M. Liu, H. Wang, M. Yu and J. Lin, Inorg. Chem., 2007, 46, 2674 CrossRef CAS.
- (a) A. K. Levine and F. C. Palilla, Appl. Phys. Lett., 1964, 5, 118 CrossRef CAS; (b) M. V. Martínez-Huerta, J. M. Coronado, M. Fernandez-García, A. Iglesias-Juez, G. Deo, J. L. G. Fierro and M. A. Banres, J. Catal., 2004, 225, 240 CrossRef; (c) Y. Terada, K. Shimamura, V. V. Kochurikhin, L. V. Barashov, M. A. Ivanov and T. Fukuda, J. Cryst. Growth, 1996, 167, 369 CrossRef CAS; (d) H. Zimer, K. Albers and U. Wittrock, Opt. Lett., 2004, 29, 2761 CrossRef CAS; (e) M. Yu, J. Lin and J. Fang, Chem. Mater., 2005, 17, 1783 CrossRef CAS.
- C. M. Zhang, C. X. Li, S. S. Huang, Z. Y. Hou, Z. Y. Cheng, P. P. Yang, C. Peng and J. Lin, Biomaterials, 2010, 31, 3374 CrossRef CAS.
- (a) M. P. U. S. Pechini, Patent 3330697, 1967 Search PubMed; (b) M. Kakihana and K. Domen, MRS Bull., 2000, 25, 27 CrossRef CAS; (c) M. Kakihana and M. Yoshimura, Bull. Chem. Soc. Jpn., 1999, 72, 1427 CrossRef CAS.
- K. Schumacher, M. Grün and K. K. Unger, Microporous Mesoporous Mater., 1999, 27, 201 CrossRef CAS.
- (a) F. Qu, G. Zhu, S. Huang and S. Q. Li, ChemPhysChem, 2006, 4, 400 CrossRef; (b) F. Qu, G. Zhu, S. Huang, S. Li, J. Sun, D. Zhang and S. Qiu, Microporous Mesoporous Mater., 2006, 92, 1 CrossRef CAS.
- (a) T. Kokubo, H. Kushitani, S. Sakka, T. Kitsugi and T. Yamamuro, J. Biomed. Mater. Res., 1990, 24, 721 CrossRef CAS; (b) Z. Wu, P. A. Webley and D. Zhao, Langmuir, 2010, 26, 10277 CrossRef CAS.
- (a) M. Yu, J. Lin, Z. Wang, J. Fu, S. Wang, H. J. Zhang and Y. C. Han, Chem. Mater., 2002, 14, 2224 CrossRef CAS; (b) S. Kook Mah and I. J. Chung, J. Non-Cryst. Solids, 1995, 183, 252 CrossRef.
- L. J. Bellamy, The Infrared Spectra of Complex Molecules, 1975, 3rd edn, vol. 2, London, Chapman and Hall Search PubMed.
- C. Hsu and R. C. Powell, J. Lumin., 1975, 10, 273 CrossRef CAS.
- (a) D. L. Shi, J. Lian, W. Wang, G. K. Liu, P. He, Z. Y. Dong, L. M. Wang and R. C. Ewing, Adv. Mater., 2006, 18, 189 CrossRef CAS; (b) K. S. Sohn, N. Shin, Y. C. Kim and Y. R. Do, Appl. Phys. Lett., 2004, 85, 55 CrossRef CAS; (c) L. Chen, K. J. Chen, C. C. Lin, C. Chu, S. F. Hu, M. H. Lee and R. S. Liu, J. Comb. Chem., 2010, 12, 587 CrossRef CAS; (d) T. S. Chan, C. C. Kang, R. S. Liu, L. Chen, X. N. Liu, J. J. Ding, J. Bao and C. Gao, J. Comb. Chem., 2007, 9, 343 CrossRef CAS; (e) C. Y. Chen, W. Zhao, R. E. Cook and G. K. Liu, Phys. Rev. B, 2004, 70, 205122 CrossRef; (f) W. Wang, D. L. Shi, J. Lian, Y. Guo, G. K. Liu, L. M. Wang and R. C. Ewing, Appl. Phys. Lett., 2006, 89, 183106 CrossRef; (g) H. Wang, C.-K. Duan and P. A. Tanner, J. Phys. Chem. C, 2008, 112, 16651 CrossRef CAS; (h) P. A. Tanner, L. S. Fu and B. M. Cheng, J. Phys. Chem. C, 2009, 113, 10773 CrossRef CAS; (i) P. A. Tanner and K. L. Wong, J. Phys. Chem. B, 2004, 108, 136 CrossRef CAS.
- H. Wang, M. Yu, C. Lin, X. Liu and J. Lin, J. Phys. Chem. C, 2007, 111, 11223 CAS.
- H. Hata, S. Saeki, T. Kimura, Y. Sugahara and K. Kuroda, Chem. Mater., 1999, 11, 1110 CrossRef CAS.
- G. Blasse and B. C. Grabmaier, Luminescent materials, Springer-Verlag, chapter 4, 1994 Search PubMed.
| This journal is © The Royal Society of Chemistry 2012 |
