Biomimetic synthesis of silica hollow spheres using poly (L-lysine) and mechanism research†
Na
Li
a,
Xin
Zhang
*a,
Qinrong
Wang
a,
Fangfang
Wang
a and
Peikang
Shen
*b
aDepartment of Chemistry, Science Faculty, Shantou University, Shantou, 515063, China. E-mail: xzhang@stu.edu.cn
bThe Key Laboratory of Low-carbon Chemistry & Energy Conservation of Guangdong Province, The State Key Laboratory of Optoelectronic Materials and Technologies, Sun Yat-sen University, Guangzhou, 510275, China. E-mail: stsspk@mail.sysu.edu.cn
First published on 22nd February 2012
Abstract
The biomimetic synthesis of silica hollow spheres induced by poly (L-lysine) (PLL) under mild conditions is reported in this paper. A number of analytical techniques, such as scanning electron microscopy, energy dispersive spectroscopy, circular dichroism analysis, thermogravimetric analysis, fourier transform infrared spectroscopy, laser scanning confocal microscopy, and liquid atomic force microscopy, were used to investigate the synthesis and characterization of the materials. While the PLL peptide backbone interacted with the silicate species in the solution via electrostatic interactions and hydrogen bonding, the surfaces of PLL served as catalytic sites for the hydrolysis and condensation of tetraethoxysilane. The continuous process of biomineralization from nucleation to the formation of hollow spheres was observed, providing direct proof of biosilica in situ mineralization. A three-step mechanism was proposed. PLL directed the nucleation of the silica precursor and crystalline growth. Silica nanoparticles aggregated and self-assembled to form hollow spheres. The results obtained suggest that it is possible to control the synthesis of silica biomimetic materials under mild chemical and physical conditions.
1. Introduction
The design and fabrication of various inorganic porous materials, such as mesoporous and hollow microspheres, have attracted intense research interest because of their wide potential applications in the therapeutic, storage, molecular recognition, catalysis, and biomedical fields.1–9 Traditional chemical methods of preparing silica-based materials have yielded great success.10 However, these chemical synthesis approaches typically require unfavorable synthetic conditions, such as long synthesis times, high costs, and increased likelihood of being environmentally unfriendly. Biomimetic synthesis strategies have some distinctive advantages over traditional chemical synthesis methods. The formation of solid silica structures with precisely controlled morphologies in biological applications is directed by proteins and polysaccharides under mild conditions.11–13 These new approaches can overcome the limitations of chemical methods and provide a powerful paradigm for the construction of complex biological nanostructures.12–14 Thus, exploration and development of a biomimetic synthesis for the preparation of inorganic hollow microspheres by biomimetic design and self-assembly is important.15–20Poly (L-lysine) (PLL) has been widely used as a template for directing the biomimetic synthesis of silica structures. For instance, Patwardhan et al. investigated the formation of silica spheres from an aqueous silica precursor as facilitated by PLL under ambient conditions, suggesting that lysine may be an important amino acid in the primary sequence of proteins that catalyze the formation of silica structures in vivo.21 They also later demonstrated that the secondary structure of PLL can be used to tune silica morphologies, and α-helix conformations of PLL are a prerequisite to form regular silica hexagonal plates.22 Most recently, Xia and co-workers studied the biomineralization of silica using two poly (L-lysine·HBr) homopolypeptides, along with phosphate buffer, as organic templates and found that the mixing sequence of the reaction species, together with the concentration of phosphate ions, was important in controlling silica morphologies.23 The previous studies focused on the development of synthetic methodologies. However, the design and synthesis (or fabrication) of nanoscale materials with controlled properties remain a significant and continuing challenge for researchers.24
Understanding the mechanism of biomimetic and molecular self-assembly processes is a crucial factor for improving synthetic approaches and designing nanoscale materials at ambient conditions.19,25,26 Although studies on the mechanism of biosilification are ongoing,27–30 detailed understanding of the mechanisms behind the production of silica structures of controlled morphologies remains hypothetical.31–34 It is difficult to investigate the bio-inspired synthesis of inorganic materials controlled by organic templates because of the rapid rate of biomimetic nucleation of inorganic materials by biological processes. Previous reports on mechanism investigation only gave assumptions and lacked direct evidence. Tracking the dynamic biomimetic process is an important step in exploring the precise mechanism of biosilica formation.23
The morphologies of biosilica are dependent on the chemical (e.g., template, concentration, ratio of reactant, pH, temperature, and additives) and physical conditions (e.g., electrostatic field and hydrodynamic fields) in the in vitro silicification reaction.35,36 Through careful adjustment of different factors, such as pH, molecular weight and concentration, we found that regular hollow spheres could be obtained under ambient conditions (Supporting Information, Fig. S1–S3†). In the current study, synthesized PLL, with a relatively small molecular weight (MW = 4![[thin space (1/6-em)]](https://www.rsc.org/images/entities/char_2009.gif) 000–15
000–15![[thin space (1/6-em)]](https://www.rsc.org/images/entities/char_2009.gif) 000), was selected to guide the self-assembly of SiO2 nanoparticles (NPs) at pH 7.6. Tetraethoxysilane (TEOS) was used as a silicon precursor to mimic the state of biomineralization under mild conditions. The interaction of the functional group of peptide molecules with TEOS was investigated and combined with scanning electron microcopy (SEM), energy dispersal spectroscopy (EDS), Fourier transform infrared spectroscopy (FTIR), circular dichroism analysis (CD), and thermogravimetric analysis (TGA) results. In particular, the formation action of biosilica mediated by peptide molecules was tracked in situ by laser scanning confocal microscopy (LSCM) and liquid atomic force microscopy (liquid-AFM), providing direct evidence of biosilica in situ mineralization, such as nucleation and growth in the liquid phase at molecular length scales.37 The current study provides new results and a better understanding of the biomineralization and biomimetic synthesis of silica hollow spheres. A biosilification and self-assembly system for biomimetic silica synthesizing materials with precise control over the silica nanostructure and morphology is also developed.
000), was selected to guide the self-assembly of SiO2 nanoparticles (NPs) at pH 7.6. Tetraethoxysilane (TEOS) was used as a silicon precursor to mimic the state of biomineralization under mild conditions. The interaction of the functional group of peptide molecules with TEOS was investigated and combined with scanning electron microcopy (SEM), energy dispersal spectroscopy (EDS), Fourier transform infrared spectroscopy (FTIR), circular dichroism analysis (CD), and thermogravimetric analysis (TGA) results. In particular, the formation action of biosilica mediated by peptide molecules was tracked in situ by laser scanning confocal microscopy (LSCM) and liquid atomic force microscopy (liquid-AFM), providing direct evidence of biosilica in situ mineralization, such as nucleation and growth in the liquid phase at molecular length scales.37 The current study provides new results and a better understanding of the biomineralization and biomimetic synthesis of silica hollow spheres. A biosilification and self-assembly system for biomimetic silica synthesizing materials with precise control over the silica nanostructure and morphology is also developed.
2. Experimental
2.1. Materials
Tetraethoxysilane (TEOS, 99+%), Poly (L-lysine hydrobromide) and FITC-tagged poly (L-lysine hydrobromide) (MW = 4 000–15![[thin space (1/6-em)]](https://www.rsc.org/images/entities/char_2009.gif) 000) were purchased from Sigma-Aldrich Chemical Company (USA), used without any further purification. All other chemicals from commercial source were of analytical grade, and doubly distilled water was used in all experiments. 0.1 M phosphate buffer solution (PBS, pH 7.6), which was made from Na2HPO4 and NaH2PO4, was employed to keep the pH of the solution at neutral.
000) were purchased from Sigma-Aldrich Chemical Company (USA), used without any further purification. All other chemicals from commercial source were of analytical grade, and doubly distilled water was used in all experiments. 0.1 M phosphate buffer solution (PBS, pH 7.6), which was made from Na2HPO4 and NaH2PO4, was employed to keep the pH of the solution at neutral.
2.2. Preparation of biosilica
Details of the experimental procedure have been reported previously.38,39 Silicic acid was prepared by ultrasonication of 200 μL of TEOS in 1.5 mL HCl (1 mM) for 30 min. 10 μL of PLL solution (6 mg mL−1) was premixed with 30 μL phosphate-buffered saline (PBS) (0.1 M, pH 7.6) before the addition of the silicic acid precursor solution. Over the course of the silicification reaction, the pH of the reaction mixture remained fairly constant (Supporting Information, Fig. S4†). All the reactions and experiments were carried out at neutral pH. After the desired reaction time had elapsed, the samples were centrifuged at 14![[thin space (1/6-em)]](https://www.rsc.org/images/entities/char_2009.gif) 000 rpm for 10 min. It was observed that a white solid precipitated in the tubes. The liquid was removed, and the precipitate was re-dispersed in the distilled water three times to remove unreacted TEOS and unconsumed polypeptides. This dispersion was further diluted, and a few drops of solution were placed on SEM sample holders and then left to dry under ambient conditions.
000 rpm for 10 min. It was observed that a white solid precipitated in the tubes. The liquid was removed, and the precipitate was re-dispersed in the distilled water three times to remove unreacted TEOS and unconsumed polypeptides. This dispersion was further diluted, and a few drops of solution were placed on SEM sample holders and then left to dry under ambient conditions.
2.3. Sample characterization
The dried samples were either coated with palladium and gold via evaporation or sputter-coated with gold. Imaging of the samples was performed by a JEOS JSM-6306 LA SEM, which was also equipped with EDS analysis capability.PLL was covalently conjugated to FITC through the ε-amino group. Confocal images were captured with a Carl Zeiss LSM 510 inverted confocal microscope equipped with a 100 × oil-immersion objective (NA = 1.4). A laser excitation wavelength of 488 nm was chosen for FITC (λEx = 494.5 nm, λEm = 519 nm). Care was taken to ensure that the polypeptide was not exposed to unnecessary room light and that excessive time was not taken between the steps of the experiment. Samples were mounted on conventional glass slides and sealed under a cover slip to prevent drying.
AFM measurements were carried out on a Multimode Nanoscope IIIa AFM (America Digital Instrument Co.), equipped with normal NP probes. The spring constant of the cantilever was 0.36 N m−1 and the typical imaging resonance frequency in the fluid was chosen at 4–6 kHz. All the samples were imaged in Fluid Tapping Mode AFM via a liquid cell with an O-ring to realize the liquid environment (Supporting Information, Fig. S5†). Samples were prepared as follows: first, 10 μL of 6 mg mL−1 PLL solution in PBS solution (0.1 M, pH 7.6) was dropped on the mica substrate and incubated for 5 min at room temperature, then washed with distilled water.
Infrared spectroscopy measurements were conducted on an Avatar 360 FTIR spectrometer, using thin KBr as the sample holder. The resolution in the spectrum collection was set at 4 cm−1, and the scanning range was set from 4000–400 cm−1.
Circular dichroic spectra were recorded on an MOS 450 spectrophotometer (Biologic, France) in a 1 mm path length quartz cuvette in a single-cell mount setup. Background scans of buffer (0.1 M phosphate, pH 7.6) and hydrolyzed TEOS solution (0.05 M TEOS in 1 mM HCl) were recorded and manually subtracted from the sample scans. PLL solutions were made at a concentration of 0.6 mg mL−1 in 0.1 M phosphate buffer (pH 7.6) and mixed with hydrolyzed 0.1 M TEOS solution. The samples (200 μL) were loaded into a 1 mm path length quartz cuvette to record CD data. Data points for the wavelength-dependent CD spectra were recorded from 250–190 nm (speed 50 nm min−1) at every nanometre with a 1 nm bandwidth.
The TGA analysis was conducted using a TGA 2050 analyzer from TA instruments. The samples were heated from 30–800 °C at 5 °C min−1 under air.
3. Results and discussion
3.1. Hollow microsphere formation
Fig. 1a shows a typical SEM image of silica spheres obtained after the addition of silicic acid to the PLL/PBS mixture, resulting in hollow spheres with outer diameters of 1.47–1.88 μm. Fig. 1b presents an LSCM image of silica spheres. The spheres had hollow structures with diameters approximating those observed by SEM. These results provide a novel and easy bio-inspired synthetic procedure for the formation of silica hollow spheres under mild conditions. Although the side distribution of hollow spheres is broad, the diameter of the spheres can be controlled by adjusting the chemical and physical conditions of the system, including the ratio of TEOS to peptide, pH, and reaction time. The surface of the resulting hollow spheres was rough because the shell wall was formed through surface deposition of silica particles induced by polypeptides.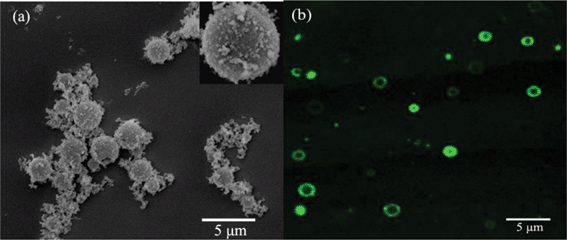 | ||
| Fig. 1 (a) SEM image and (b) LSCM image of the typical silica hollow spheres mediated by PLL. | ||
As shown in Fig. 2, SEM as a function of time was used to explore the evolution of the silica structure during different biomineralization stages. Fig. 2a–2e indicate the nucleation of silica acid precursor induced by PLL at different times from 10 min to 1 h. Tiny NPs formed during the initial stages of mineralization, and the particle nuclei depended on both the nucleating site number of PLL and concentration of silica acid. Nuclei and tiny NPs approximately 180 nm in diameter formed upon the addition of silicic acid to the PLL/phosphate mixture during the first 10 min of the mineralization (Fig. 2a). The tiny NPs then aggregated and grew into larger particles with diameters of 200–500 nm after aging for 20 min (Fig. 2b). When the reaction time was further extended to 30 min, the structures of the particles noticeably changed, presenting diameters of about 1.02 μm (Fig. 2c). Induced by the polypeptide molecules, the microspheres were transformed to larger hollow spheres and further assembled on the surface of hollow spheres with diameters of 1.77–3.23 μm over the next 40 and 50 min (Fig. 2d and 2e, respectively). The nucleation and growth of silica acid to form NPs and small spheres was directed by the polypeptides, thus indicating that they can be used as basic building blocks to obtain new materials by self-assembly.19,24,40,41 However, these larger aggregates did not undergo significant changes in size as the reaction further proceeded. The primary reason for the reactions observed is that the surface PLL residues provided most of the catalytic sites for the nucleation reaction. Once these charges on the template surface were completely neutralized or embedded by the adsorbed silica anions with increasing silicification time, further increases in reaction time could only lead to the formation of random silica precipitates. This phenomenon indicates that the particle size is not only influenced by the reaction time but also by other chemical and physical factors. Thus, the diameter of hollow spheres can be controlled by chemical and physical conditions. These results are in good agreement with a previous report, wherein the self-assembly of CaCO3 NPs was guided by a polyaspartic acid sodium.42
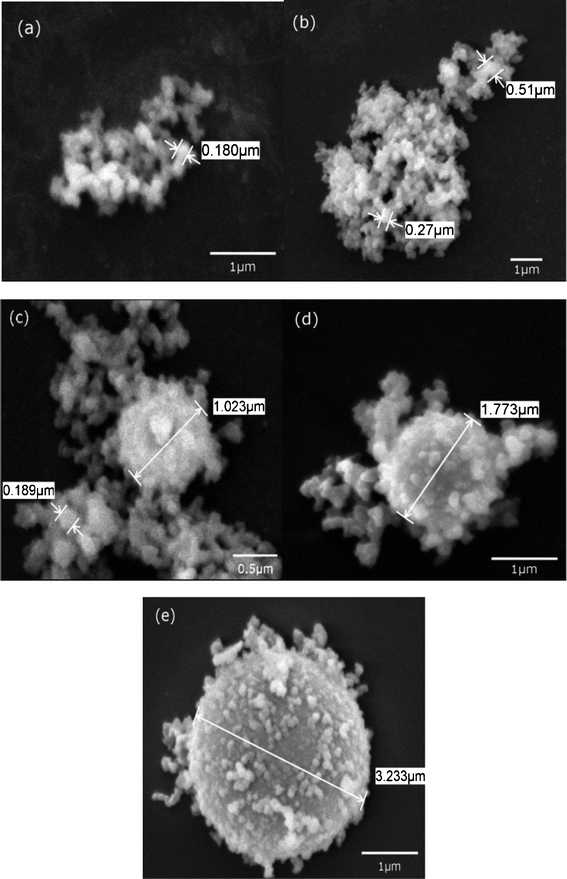 | ||
| Fig. 2 SEM images of biosilica produced by PLL with the reaction time of (a) 10 min, (b) 20 min, (c) 30 min, (d) 45 min, (e) 1 h. | ||
To investigate the formation mechanism of biomimetic synthesis of silica induced by PLL, the use of LSCM was maintained to further explore the role of polypeptide in biomineralization. PLL to which dye molecules were attached was used (Fig. 3). Fig. 3a shows the confocal image of a homogeneous aqueous solution of PLL, in which some visible random aggregates in the solution are observed. The conformation of PLL in aqueous solution depended on the degree of protonation of the ε-amino group of the side chain, and its pKa is close to 11.1. The amino acid residues of PLL are cationically charged at neutral pH, which is proposed to be key to residues in the proteins being responsible for facilitating biosilicification.43 The observed ring structure (Fig. 3b) demonstrated the formation of silica hollow spheres after the addition of fresh TEOS solution for 1 h, and indeed, a distinct size difference, was observed in the resultant hollow spheres. The inset in Fig. 3c clearly demonstrated that PLL is entrapped within the silica shell. The core region of the hollow spheres exhibited weak but non-zero fluorescence, which was verified through line intensity profile analysis (Fig. 3d). The hollow sphere interior contained PLL, but apparently at a lower concentration than that in the shell wall, suggesting that PLL is mostly located within the silica shell wall.
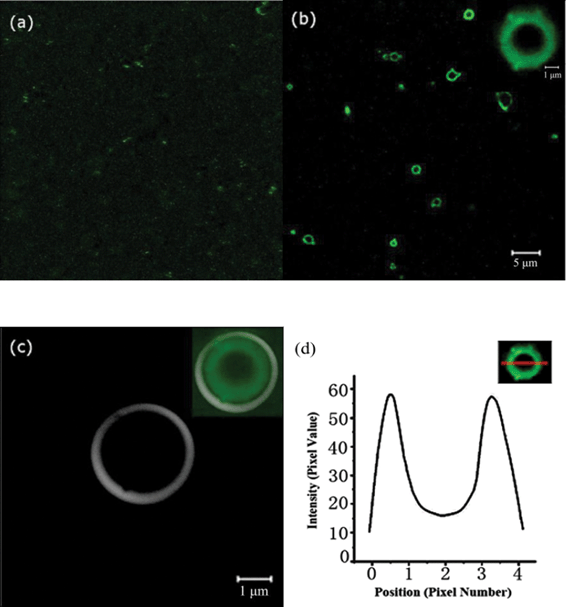 | ||
| Fig. 3 LSCM images of silica hollow spheres mediated by PLL. (a) PLL (conjugated to FITC dye) in solution. (b) PLL and silicic acid reacted for 1 h. The highlighted area is shown at higher magnification in the inset. (c) Bright-field micrographs of silica. Combined confocal/bright-field images are shown in the inset. (d) Line intensity profile across a microsphere showing the core-shell structure. | ||
The constant growth process of silica hollow spheres was investigated by LSCM and time-resolved SEM, thus providing better understanding of the formation of the hollow spheres (Fig. 4). Indeed, a progressive increase in silica hollow sphere size was observed by LSCM. The reaction process was tracked in situ in real time; pictures were taken at 3 min intervals, allowing the formation process of the hollow spheres to be seen in detail (i.e., A1–A6 and B1–B6, indicated by arrows in Fig. 4). Fig. 4 clearly shows the movement and self-assembly of silica microspheres induced by PLL. The microspheres moved towards the surface of the hollow spheres in a step-by-step manner (i.e., A1–A5 and B1–B5, indicated by arrows in Fig. 4a–e). Upon arrival at the surface of the spheres, the microspheres self-assembled on the vacant sites of the hollow spheres to form shells (i.e., A6 and B6, indicated by arrows in Fig. 4f). Meanwhile, the SEM images show the sequential growth of silica hollow spheres with reaction time (Fig. 5a–5c). During the initial stages of silica growth, it was evident that some holes remained on the template surface (Fig. 5a). The silica microspheres then gradually self-assembled into the directional empty positions induced by PLL, and the number of empty holes decreased, resulting in smooth spheres (Fig. 5b). The positively charged groups at the surface of the spheres provided a driving force that absorbed negatively charged silica groups transferring to the surface of the template, causing hydrolysis and condensation to form silica shells. The positively charged groups on the surface of the spheres were neutralized by the negatively charged groups of silica during the biomineralization process. The empty sites on the hollow spheres showed a higher local concentration of positive charges, indicating that the positively charged groups still had not reacted with the negatively charged groups. As a result, the positively charged groups on the empty surface sites could induce negatively charged silica particles to change directional positions and self-assemble, leading to the formation of silica shell walls. However, as shown in Fig. 5c, once the silica shells were completely integrated, further increases in time only led to the formation of random silica precipitates on the outer surface of the spheres. Thus, only irregular spheres were obtained. Cross-sectional SEM images confirm that the silica spheres obtained were hollow (Fig. 5d). These results are broadly consistent with a previous conclusion.22,44
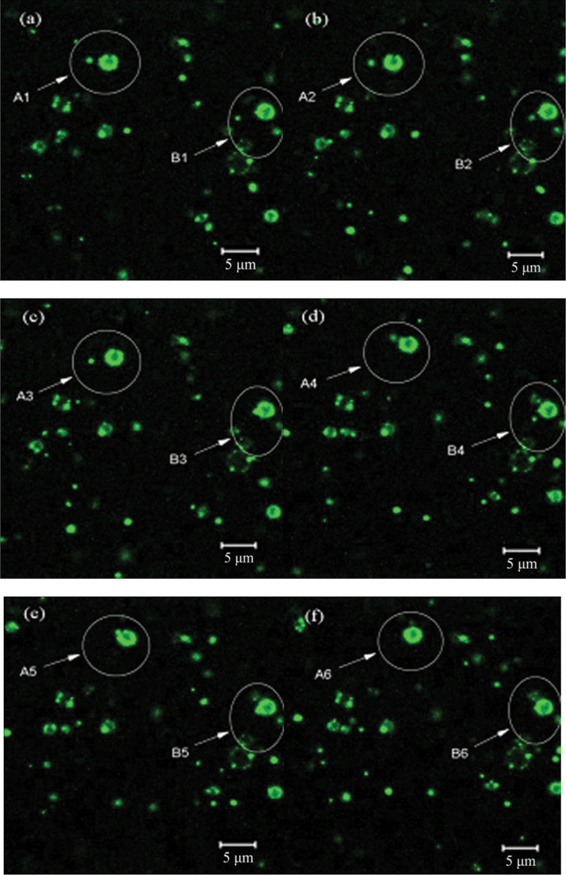 | ||
| Fig. 4 Live confocal imaging to follow the synthesis of sample. The first picture is of PLL-phosphate aggregates after 30 min aging. After the addition of silicic acid to the PLL/phosphate mixture, pictures were taken at 3 min intervals. | ||
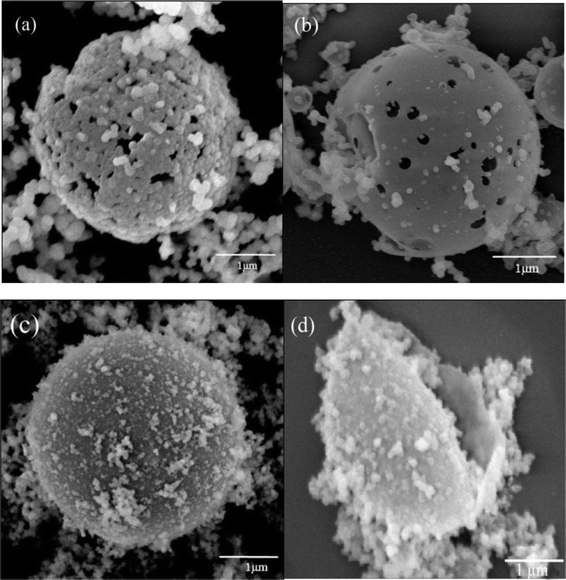 | ||
| Fig. 5 SEM images of silica hollow spheres. (a) Framework of silica hollow sphere. (b) Silica hollow sphere with holes. (c) Integrated silica hollow sphere. (d) Cross section of silica hollow sphere. | ||
To investigate the role of amino side groups at different positions on the PLL chains, the amino groups of polypeptide chair at the middle and terminal positions, were tagged with FITC. (Chemical structures are shown in Fig. S6†, Supporting Information.) The FITC-terminal-tagged system (Fig. 6a) was compared with the FITC-middle-tagged system (Fig. 6b). Some black spots were inserted in the ring structure upon the addition of silicic acid to the PLL/phosphate mixture (Fig. 6b), indicating that FITC fluorescence quenching and amino-tagged FITC are favorable for silica formation. Immediately upon the addition of silicic acid to the PLL/phosphate mixture, a complete fluorescence ring was observed by the FITC-terminal-tagged system (Fig. 6a). Electrostatic interactions between positively charged amino groups and negatively charged silica oligomers depend on the NH3+–SiO− distance. In the FITC-middle-tagged PLL, when the effects of the large volume of the side chains are ignored, the distribution of charged NH3+ groups along the peptide chain can bring more negatively charged silica oligomers close enough for condensation to occur, similar to previously published reports.45,46
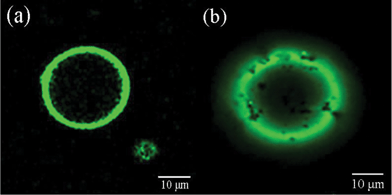 | ||
| Fig. 6 LSCM images of silica hollow spheres mediated by (a) FITC-terminal-tagged PLL and (b) FITC-middle-tagged PLL. | ||
To obtain more insights into the above process, liquid-AFM was used to track the in situ reaction process of PLL-directed silica biomineralization in real time. After the addition of silicic acid to the PLL-phosphate mixture, pictures were taken at 10 min intervals (Fig. 7), thus providing the first direct evidence of biosilica in situ mineralization. Fig. 7a shows (only) the presence of peptide molecules without the addition of silicic acid solution. After injection of fresh silicic acid solution into the chamber, a number of extremely small NPs distributed uniformly onto the surface of the assembled PLL within a short period of time (Fig. 7b). The inset in Fig. 7b shows the NPs more clearly (indicated by circles); these NPs were about 1–2 nm in size. The NPs observed are speculated to be stable nuclei, possessing an anhydrous SiO2 core and surface silanol groups (Si–OH). Fig. 7c shows PLL with silica particles assembled into larger mineralized aggregates of approximately 200 nm. AFM observation results demonstrated that the aggregation of NPs and the formation of new silica nuclei (indicated by black circles) induced by PLL can occur simultaneously. A comparison experiment was performed to investigate the influences of PLL. When PLL was absent, no NPs were observed in the silicic acid solution. The number of particles also decreased with decreasing concentration of PLL in the silicic acid solution (Fig. 7d), indicating that PLL provides nucleation sites leading to silica precipitation. Compact/dense NPs have been generated by the condensation of SiO2 or the dehydration process, or a combination of both.7,47,48 It is thus reasonable to assume that, after injection of TEOS, silicic acid ions with negatively charged groups can react with positively charged groups of PLL to form stable nuclei by static electric absorption, which is also consistent with previous reports.49,50 Such a direct visual process was also observed in previous research on NPs assembly or biomimetic mineralization in situ AFM.17
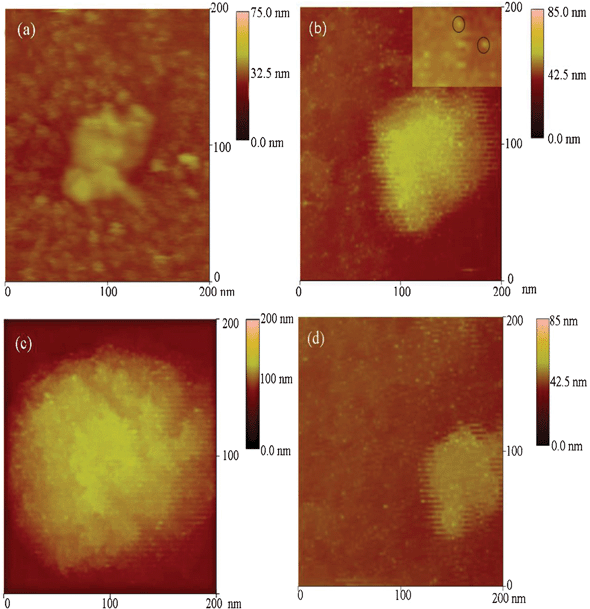 | ||
| Fig. 7 In situ AFM images of silica in presence of PLL (6 mg mL−1) with the reaction time of (a) 0 min, (b) 10 min, (c) 30 min. (d) The concentration of PLL was 1 mg mL−1 and reacted with silicic acid for 10 min. | ||
3.2. Analysis of silica-PLL composites
Polypeptides and other silica-templating peptides have been previously shown to be entrapped within the silica matrix.23,51,52 EDS results showed that the sample includes nitrogen, silicon, and oxygen elements (Supporting Information, Fig. S7†), which suggests that PLL is entrapped within the silica matrix.To further investigate the entrapment of PLL molecules within silica, FTIR analysis of the samples was performed. Fig. 8 shows overlaid spectra from 4000 to 400 cm−1. The predominant peak regions arising from PLL and silica were highlighted in the plot and are as follows: 3434 cm−1, attributed to OH stretching modes from adsorbed water and silanol groups, and 1647 and 1541 cm−1, attributed to amide I and II bands from the polypeptide. The hybrid silica (i.e., polypeptide silica composite) displayed three characteristic peaks of silica: –Si–O–Si asymmetric stretching at 1086 cm−1, symmetric stretching at 770 cm−1, and –Si–OH stretching at 962 cm−1.
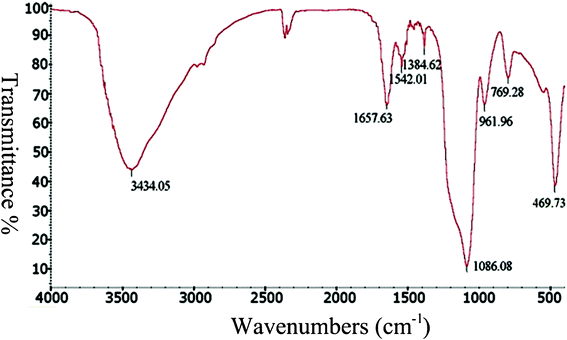 | ||
| Fig. 8 Representative FTIR spectrum of silica precipitated by PLL. | ||
Considering the important roles of PLL secondary structures in producing ordered silica, CD spectroscopy was used to characterize the conformation of PLL chains. Fig. 9 shows the CD spectra of PLL in phosphate buffer solution (pH 7.6) in the absence and the presence of silicic acid, in which a CD spectrum with a minimum at approximately 198 nm was determined to belong to a typical random coil conformation (curve 1). Under identical solution conditions, the CD spectra did not change after the addition of silicic acid (curve 2). This result indicates that PLL does not undergo significant secondary structure transformation. In other words, the secondary conformation of PLL does not change with the variation in pH. This experimental result is consistent with previous reports, 51,52 which showed that low-molecular-weight PLL produces only irregular silica spheres without coil-helix transitions. The short chains were unstable and failed to adopt a helical structure because the number of intramolecular hydrogen bonds may not be sufficient to stabilize the structure. This observation is also in agreement with previous reports on the formation of silica plates with PLL of chain lengths of <100 amino acid residues.22,51
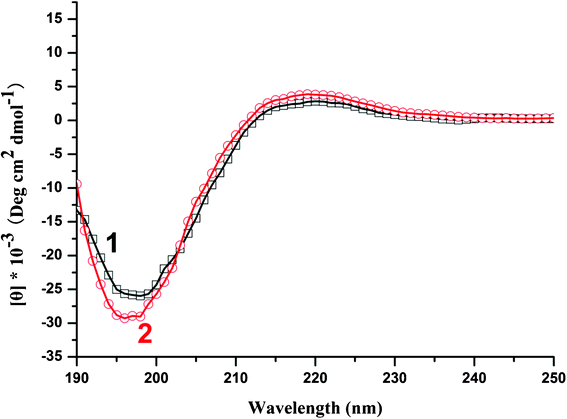 | ||
| Fig. 9 CD spectra of PLL in the absence (curve 1) or in the presence (curve 2) of silicic acid in 0.1 mM phosphate buffer solutions pH 7.6. | ||
TGA was conducted on the above hybrid silica sample in air at a heating rate of 5 °C min−1. As shown in Fig. S8† (Supporting Information), there was ∼5% weight loss at 200 °C in the TGA curve, which was attributed to the initial vaporization of superficial water. The main temperature region for weight loss occurred between 250 and 600 °C, confirming the loss of entrapped peptides. Taken together, the observations indicate the entrapment of PLL nanostructures into silica precipitates via templating.
3.3. Mechanisms underpinning the formation of biosilicas
There are two key steps in the formation of hollow spheres induced by polypeptides. One is the nucleation of silica acid to form silica NPs. The second is self-assembly of these particles to form the hollow spheres. In this experiment, the PLL drives the induction of the condensation of silicate species by electrostatic interactions between the positively charged groups of the PLL molecules and the negatively charged groups of silica molecules.53–55 PLL further promotes the aggregation and self-assembly of nucleation particles. Generally, spherical aggregation is favored in terms of energy because the formation of microspheres can greatly reduce the interfacial energy of nanospheres.40,56According to the results presented above, a three-step formation mechanism that accounts for the dynamic growth of silica/PLL NPs is proposed, as illustrated in Fig. 10. In the first step, PLL provides nucleating sites for silica at the early stage of biomineralization and induces the nucleation of silica to form NPs by electrostatic attractions between positively charged PLL and negatively charged silica. In the second step, crystalline growth changes NPs into small particles, which then aggregate into larger microspheres. In the third step, small PLL fragments self-assemble into spherical aggregation, and then these polypeptide aggregates template silica microspheres transferring to surface of the aggregate, where NPs and microspheres self-assemble to form shell walls of hollow spheres. The silica particles then further self-assemble into the empty sites of the hollow spheres to form larger and more-integrated hollow spheres. Interestingly, once the functional primary amine groups in the template surface were completely neutralized, or embedded, or the silica shells had become completely integrated, further increases in time led to the formation of random silica precipitates on the outer surface. Thus, only irregular spheres were obtained without the peptide template. It is thus reasonable to assume that careful adjustment of the reaction time, together with other factors (i.e., concentration, pH, and temperature), could afford good control of the morphological and nanostructures of silica hollow spheres.
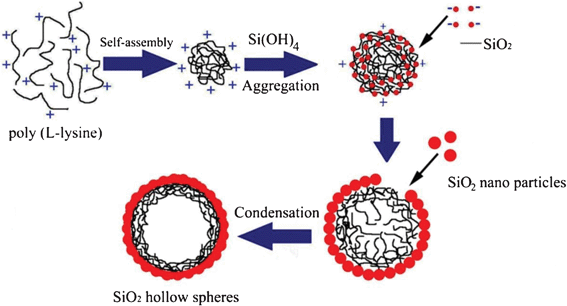 | ||
| Fig. 10 Schematic illustration of the hierarchically silica particles formed with PLL. | ||
4. Conclusions
The current work demonstrated a simple and easily-controlled approach for the biomimetic synthesis of silica hollow spheres under ambient conditions. The diameter of hollow spheres prepared can be controlled by various chemical and physical conditions, including the ratio of TEOS to peptide, pH, and reaction time. SEM, LSCM, and liquid-AFM were performed to track the morphologies and structures of silica hollow spheres, as well the continuous process of biomineralization from nucleation to formation of the hollow spheres, providing direct evidence of biosilica in situ mineralization. Polypeptides in this research provided nucleating sites for silica biomineralization, induced silica particle transfer to the surface by electrostatic driving forces, and assembled into silica shells of hollow spheres. Thus, a three-step mechanism for the formation of silica hollow spheres directed by PLL was proposed. Peptide self-assembly was found to form stable templates under mild conditions, thus contributing to our understanding of such mechanisms. The findings in this work are helpful for the production of nanostructured inorganic materials and provide important insights into silica biomineralization templates by polypeptides.Acknowledgements
This research project was supported by the Natural Science Foundation of China (20871080).References
- K. J. C. van Bommel, J. H. Jung and S. Shinkai, Adv. Mater., 2001, 13, 1472–1476 CrossRef CAS.
- R. K. Pai and S. Pillai, Cryst. Growth Des., 2007, 7, 215–217 CAS.
- W. Q. Cai, J. G. Yu, B. Cheng, B. L. Su and M. Jaroniec, J. Phys. Chem. C, 2009, 113, 14739–14746 CAS.
- Y. F. Zhang, H. Wu, J. Li, L. Li, Y. J. Jiang, Y. Jiang and Z. Y. Jiang, Chem. Mater., 2008, 20, 1041–1048 CrossRef CAS.
- M. Yamanaka, Y. Miyake, S. Akita and K. Nakano, Chem. Mater., 2008, 20, 2072–2074 CrossRef CAS.
- M. C. Zhang, W. Q. Zhang and S. N. Wang, J. Phys. Chem. C, 2010, 114, 15640–15644 CAS.
- H. Xu, Y. M. Wang, X. Ge, S. Y. Han, S. Wang, P. Zhou, H. H. Shan, X. B. Zhao and J. R. Lu, Chem. Mater., 2010, 22, 5165–5173 CrossRef CAS.
- X. F. Yang, H. Tang, K. S. Cao, H. J. Song, W. C. Sheng and Q. Wu, J. Mater. Chem., 2011, 21, 6122–6135 RSC.
- M. S. Toprak, B. J. McKenna, M. Mikhaylova, J. H. Waite and G. D. Stucky, Adv. Mater., 2007, 19, 1362–1368 CrossRef CAS.
- R. Schiller, C. K. Weiss, J. Geserick, N. Husing and K. Landfeser, Chem. Mater., 2009, 21, 5088–5098 CrossRef CAS.
- N. Kroger and R. Deutzmann, Science, 1999, 286, 1129–1132 CrossRef CAS.
- X. Q. Li, T. T. Yang, Q. Gao, J. J. Yuan and S. Y. Cheng, J. Colloid Interface Sci., 2009, 338, 99–104 CrossRef CAS.
- J. N. Cha, G. D. Stucky, D. E. Morse and T. J. Deming, Nature, 2000, 403, 289–292 CrossRef CAS.
- H. Acar, R. Garifullin and M. O. Guler, Langmuir, 2011, 27, 1079–1084 CrossRef CAS.
- M. Fujiwara, K. Shiokawa, I. Sakakura and Y. Nakahara, Nano Lett., 2006, 6, 2925–2928 CrossRef CAS.
- T. Shiomi, T. Tsunoda, A. Kawai, F. Mizukami and K. Sakaguchi, Chem. Mater., 2007, 19, 4486–4493 CrossRef CAS.
- R. K. Pai and S. Pillai, J. Am. Chem. Soc., 2008, 130, 13074–13078 CrossRef CAS.
- R. K. Pai and M. Cotlet, J. Phys. Chem. C, 2011, 115, 1674–1681 CAS.
- A. Altunbas, N. Sharma, M. S. Lamm, C. Yan, R. P. Nagarkar, J. P. Schneider and D. J. Pochan, ACS Nano, 2010, 4, 181–188 CrossRef CAS.
- K. Tao, J. Q. Wang, P. Zhou, C. D. Wang, H. Xu, X. B. Zhao and J. R. Lu, Langmuir, 2011, 27, 2723–2730 CrossRef CAS.
- S. V. Patwardhan and S. J. Clarson, Mater. Sci. Eng., C, 2003, 23, 495–499 CrossRef.
- S. V. Patwardhan, R. Maheshwari, N. Mukherjee, K. L. Kiick and S. J. Clarson, Biomacromolecules, 2006, 7, 491–497 CrossRef CAS.
- L. Xia and Z. B. Li, Langmuir, 2011, 27, 1116–1122 CrossRef CAS.
- J. A. Dahl, B. L. S. Maddux and J. E. Hutchison, Chem. Rev., 2007, 107, 2228–2269 CrossRef CAS.
- N. Kroger, S. Lorenz, E. Brunner and M. Sumper, Science, 2002, 298, 584–586 CrossRef.
- S. V. Patwardhan, Chem. Commun., 2011, 47, 7567–7582 RSC.
- C. Gröger, K. Lutz and E. Brunner, Cell Biochem. Biophys., 2008, 50, 23–39 CrossRef.
- A. Heredia, H. J. Van der Strate, I. Delgadillo, V. A. Basiuk and E. G. Vrieling, ChemBioChem, 2008, 9, 573–584 CrossRef CAS.
- V. V. Annenkov, E. N. Danilovtseva, Y. V. Likhoshway, S. V. Patwardhan and C. C. Perry, J. Mater. Chem., 2008, 18, 553–559 RSC.
- E. Bonucci, J. Bone Miner. Metab., 2009, 27, 255–264 CrossRef.
- P. X. Zhu and R. H. Jin, J. Mater. Chem., 2008, 18, 313–318 RSC.
- K. D. Demadis, A. Ketsetzi, K. Pachis and V. M. Ramos, Biomacromolecules, 2008, 9, 3288–3293 CrossRef CAS.
- A. Heredia, H. J. Van der Strate, I. Delgadillo, V. A. Basiuk and E. G. Vrieling, ChemBioChem, 2008, 9, 573–584 CrossRef CAS.
- H. Ehrlich, K. D. Demadis, O. S. Pokrovsky and P. G. Koutsoukos, Chem. Rev., 2010, 110, 4656–4689 CrossRef CAS.
- F. Rodríguez, D. D. Glawe, R. R. Naik, K. P. Hallinan and M. O. Stone, Biomacromolecules, 2004, 5, 261–265 CrossRef.
- B. Leng, X. Chen, Z. Shao and W. Ming, Small, 2008, 4, 755–758 CrossRef CAS.
- J. E. Verity, N. Chhabra, K. Sinnathamby and C. M. Yip, Biophys. J., 2009, 97, 1225–1231 CrossRef CAS.
- S. V. Patwardhan, N. Mukherjee and S. J. Clarson, J. Inorg. Organomet. Polym., 2001, 11, 193–198 CrossRef CAS.
- W. D. Marner, A. S. Shaikh and S. J. Muller, Biomacromolecules, 2008, 9, 1–5 CrossRef CAS.
- L. Y. Li, J. G. Wang, P. C. Sun, X. H. Liu, D. T. Ding and T. H. Chen, Acta Phys.-Chim. Sin., 2008, 24, 359–363 CrossRef CAS.
- J. S. Jan and D. F. Shantz, Adv. Mater., 2007, 19, 2951–2956 CrossRef CAS.
- Z. P. Zhang, D. M. Gao, H. Zhao, C. G. Xie, G. J. Guan, D. P. Wang and S. H. Yu, J. Phys. Chem. B, 2006, 110, 8613–8618 CrossRef CAS.
- S. V. Patwardhan, N. Mukherjee, M. Steinitz-Kannan and S. J. Clarson, Chem. Commun., 2003, 1122–1123 RSC.
- V. S. Murthy, J. N. Cha, G. D. Stucky and M. S. Wong, J. Am. Chem. Soc., 2004, 126, 5292–5299 CrossRef CAS.
- T. Coradin and J. Livage, Colloids Surf., B, 2001, 21, 329–336 CrossRef CAS.
- T. Coradin, O. Durupthy and J. Livage, Langmuir, 2002, 18, 2331–2336 CrossRef CAS.
- S. E. C. Dale, S. J. Bending and L. M. Peter, Langmuir, 2009, 25, 11228–11231 CrossRef CAS.
- H. X. Zhao, H. Jin, J. Y. Cai and S. Ding, Ultramicroscopy, 2010, 6, 1–6 Search PubMed.
- J. D. Hartgerink, E. Beniash and S. I. Stupp, Science, 2001, 294, 1684–1688 CrossRef CAS.
- S. V. Patwardhan and S. J. Clarson, J. Inorg. Organomet. Polym., 2003, 13, 49–53 CrossRef CAS.
- M. M. Tomczak, C. Lawrence, L. F. Drummy, L. A. Sowards, D. C. Glawe, M. O. Stone, C. C. Perry, D. J. Pochan, T. J. Deming and R. R. Naik, J. Am. Chem. Soc., 2005, 127, 12577–12582 CrossRef CAS.
- L. Xia, Y. Liu and Z. Li, Macromol. Biosci., 2010, 10, 1566–1575 CrossRef CAS.
- D. D. Glawe, F. Rodriguez, M. O. Stone and R. R. Naik, Langmuir, 2005, 21, 717–720 CrossRef CAS.
- B. L. Yuan, M. Pham and T. H. Nguyen, Environ. Sci. Technol., 2008, 42, 7628–7633 CrossRef CAS.
- S. J. Wang, X. Ge, J. Y. Xue, H. M. Fan, L. J. Mu, Y. P. Li, H. Xu and J. R. Lu, Chem. Mater., 2011, 23, 2466–2474 CrossRef CAS.
- M. Trilla, X. Cattoën, C. Blanc, M. W. C. Man and R. Pleixats, J. Mater. Chem., 2011, 21, 1058–1063 RSC.
Footnote |
| † Electronic supplementary information (ESI) available. See DOI: 10.1039/c2ra00019a |
| This journal is © The Royal Society of Chemistry 2012 |
