DOI:
10.1039/C2RA00788F
(Paper)
RSC Adv., 2012,
2, 3714-3721
A highly selective and dual responsive test paper sensor of Hg2+/Cr3+ for naked eye detection in neutral water†
Received
24th September 2011
, Accepted 18th January 2012
First published on 2nd March 2012
Abstract
A highly selective and sensitive colorimetric and fluorogenic sensor (L1) for Hg2+/Cr3+ is reported. This reagent (L1) was synthesized by reacting 4-((4 (dimethylamino)phenyl)diazenyl)benzene-1-sulfonyl chloride, which has a dimethylaminophenyldiazenyl fragment as a photoactive signalling unit, with 2,2′-(3,3′-azanediylbis(propane-3,1-diyl))diisoindoline-1,3-dione as the receptor fragment. The reagent was characterized by standard analytical and spectroscopic techniques. Electronic spectral studies revealed that the reagent was selective for Hg2+ and Cr3+ in the presence of all other metal ions of Group 1A, IIA and all other common transition metal ions. On binding of L1 to the Hg2+ or Cr3+ centres, a new intense absorption band with a λmax of 509 nm appeared with associated changes in the visually detectable solution colour from yellow to red. Fluorescence spectral studies revealed a significant enhancement in the emission intensities upon coordination to Hg2+ or Cr3+ without any change in the emission wavelength. This could be explained by the efficient interruption of the photo induced electron transfer signalling mechanism involving an unshared pair of electrons from the central tertiary amine centre. An easy to prepare paper test kit, which was obtained by soaking the filter paper in a dichloromethane solution of L1, presents an approach that could be successfully used in the detection of Hg2+ or Cr3+ ions present in neutral aqueous media. This indicates the potential application of this dip strip type sensor for the detection of Hg2+ and Cr3+ in neutral aqueous environments without any spectroscopic instrumentation. Importantly, this reagent binds specifically to Cr3+ in the presence of an excess of iodide ions, which act as a masking agent for Hg2+. To the best of our knowledge, there are very few examples of detection limits lower than the present test strip for Hg2+ in the literature, while, for Cr3+, no such report is available.
Introduction
Certain transition metal ions are of grave concern not only for chemists, biologists and environmentalists, but also for the general population due to their deleterious influences on living systems, human heath and the environment.1 Thus, considerable efforts have been devoted to the development of easy-to-use methodologies for the detection and sensing of these specific transition metal ions in aqueous environments.2 Unfortunately, many industrial detection methods rely on time consuming and sophisticated analytical techniques, such as atomic absorption spectroscopy, inductively coupled plasma mass spectroscopy, ion chromatography, etc., which are generally not very conducive for an “in-field” application.3 Thus, it is almost essential to develop sensitive, rapid and simple to use methodologies for the recognition and estimation of these toxic transition metal ions present in trace amounts.
Among various toxic transition metal ions, Cr3+ and Hg2+ are important due to their biological significance as well as their adverse influence on various living organisms.4 The trivalent form of chromium is an essential nutrient for humans and its deficiency causes disturbances in glucose levels and lipid metabolism.5 On the other hand, a build up of Cr3+ beyond the threshold value in any living organism has a detrimental influence. Various industrial or/and agricultural activities that add to the build up of Cr3+ in the environment is a matter of concern.5 Among other transition metal ions, the toxic influences of Hg2+ on the human population is well documented.6–8 Hg2+ is known to be involved in biological processes, such as the transmission of nerve impulses and the regulation of critical cell activities.6 Furthermore, Hg2+ present in water and soil is known to bioaccumulate in the human body and other higher organisms through propagation in the food chain.7 These accumulations and exposure to an excess of Hg2+ leads to DNA damage, mitosis impairment and nervous system defects.8 These collectively have led to an urgency for the development of an efficient and appropriate chemosensor for Cr3+ and Hg2+ ions that are capable of detecting these ions in biological and environmental samples in the presence of other interfering cations. Over the last few decades considerable attention have been paid to the development of reversible optical chemosensors that are able to detect the presence of these ions.9 In this regards, three different approaches have generally been adopted to convert the binding event into a measurable feedback signal. These involve use of either a fluorescent/colorimetric group as a reporter functionality that responds through changes in its emission/optical spectral pattern, or a reagent that allows the binding process to be probed through changes in the NMR spectral pattern or redox active groups that allow monitoring through changes in the redox potentials. Among these approaches, reagents that allow the binding process to be probed by monitoring changes in the optical feedback through a “turn-on” response, rather than a turn-off response are preferred for the design of an efficient sensor for practical in the field applications. The Cr3+ ion, through its paramagnetic influence and the Hg2+ ion, through its efficient spin–orbit coupling, are commonly known to effectively quench the receptor fluorescence. To date, reports on fluorescence-based sensors with a turn-on response for Cr3+ are very limited in the literature due to the lack of availability of an appropriate selective ligand system. More importantly, there are very few examples of receptor molecules that are able to convert the binding event into more than one type of read-out signal, e.g. fluorescence and optical spectral changes. Among these, colorimetric receptors that allow the visual detection of Cr3+ and Hg2+ are of special significance.10 For simplicity, convenience and to achieve a low-cost alternative, the development of a colorimetric test kit that allows the semi-quantitative detection of target cations using a standard colour comparator is in high demand.
In this article we have presented a rational strategy for the development of a selective chromo-sensor (L1) for the detection of Cr3+ and Hg2+ with a remarkable colour variation in a CH3CN medium along with a turn-on response for all other common alkali and transition metal ions. More importantly, this reagent could be used for the development of an easy-to-use paper test strip for the semi-quantitative colorimetric detection of these two ions present in neutral aqueous media with concentrations as low as 10 ppm. Notably, this reagent binds specifically to Cr3+ in the presence of an excess of iodide ions, which act as a masking agent for Hg2+.
Results and discussion
Synthesis
Intermediate ligand L (Scheme 1) was synthesized following a reported procedure by reacting bis(3-aminopropyl)amine and phthalic anhydride in an appropriate ratio and was achieved in a reasonably good yield.11 Isolated compound L was further allowed to react with 4-(dimethylamino)phenyl)diazenyl)benzene-1-sulfonyl chloride to obtain the desired compound, L1.11 These receptors were characterised using various analytical and spectroscopic techniques and the data thus obtained matched well with that reported earlier for these two ligands.11
 |
| | Scheme 1 | |
![[double bond, length as m-dash]](https://www.rsc.org/images/entities/char_e001.gif) N functionality as the acceptor. The appreciably higher extinction coefficient (8.3 × 10⁴ mol−1 L cm−1) for L1, as compared to that of L (5.7 × 10³ mol−1 L cm−1) is presumably due to the higher value of the transition dipole moment associated with this CT transition for L1.11
N functionality as the acceptor. The appreciably higher extinction coefficient (8.3 × 10⁴ mol−1 L cm−1) for L1, as compared to that of L (5.7 × 10³ mol−1 L cm−1) is presumably due to the higher value of the transition dipole moment associated with this CT transition for L1.11
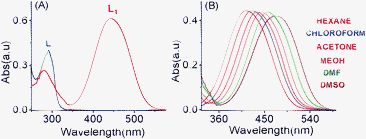 |
| | Fig. 1 (A) The absorbance spectra of L and L1 (2.0 × 10⁻⁵ M) in a CH3CN medium; (B) the absorbance spectra of L1 (2.0 × 10⁻⁵ M) in different solvents with varying polarities. | |
The ICT nature of this characteristic band of L1 was further confirmed by the bathochromic shifts of this absorption band with a gradual increase in the solvent polarity (Fig. 1B). The energies of the electronic transitions, which are associated with the ICT absorption band, are known to be appreciably affected by a change in the medium polarity and the acceptor number present in the solvent.12 It is generally argued that this effect grossly depends on the extent to which the lone pair of electrons at the terminus of the N,N-dimethylamine group can actually interact with the Lewis acidity of the solvent molecules, which is generally determined by the respective acceptor numbers of the solvent.12 This results in a red-shifted absorption band maxima with an increase in the solvent polarity.
A detailed analysis of the UV–vis absorption spectra of L1 in the absence and presence of group IA, group IIA and all other common transition metal ions revealed that this reagent binds preferentially to Cr3+ and Hg2+. The binding is associated with a significant change in the absorption spectral pattern and a visually detectable colour change in acetonitrile (Fig. 2C). This reagent was also found to bind to Nd3+, among other lanthanide ions in acetonitrile, and this result has been reported in our previous article.11 No change in the electronic spectral pattern could be detected in the presence of externally added Li+, Na+, K+, Cs+, Mg2+, Ca2+, Ba2+, Sr2+, Co3+, Ni2+, Cu2+, Fe2+, Fe3+, Cd2+, Al3+ and Ag+. For Zn2+ (Fig. 2), an insignificant shift in the absorption spectra was observed. This tends to suggest a preferential and appreciable binding of L1 to Cr3+ and Hg2+ and a weak binding to Zn2+ (Fig. 2). However, one cannot rule out the possibility of a very weak binding to any one of the other metal ions, where the binding may be too weak to perturb the energies of the frontier orbitals and, thus, the energies for the spectral transition. The complexation ability of L1 with Cr3+ and Hg2+ was investigated by systematic UV–vis absorption titrations for varying concentrations of Cr3+ and Hg2+ as their perchlorate salts. During the titration process, the effective concentration of L1 remained unaltered. Notably, upon addition of increasing amounts of Cr3+ or Hg2+, the characteristic strong absorption band at 440 nm for L1 was found to decrease with a simultaneous growth of an absorption band with a maxima at 509 nm along with an isosbestic point at 464 nm (Fig. 3). Spectral changes were associated with a visually detectable colour change from yellow to red (Fig. 2C). However, no apparent visual colour change occurred for L upon addition of Cr3+ and Hg2+ in CH3CN as the red-shifted absorption band for L upon binding to Cr3+ or Hg2+ is in the UV region (Electronic Supplementary information, ESI†). The red-shift of the absorption band for L confirmed the binding of Cr3+ and Hg2+ to the N-tertiary amine of the propyl chain, together with the carbonyl group of the phthalimide ring. Such a binding mode is consistent with a previous literature report.13 Presumably, L1 binds to Cr3+ and Hg2+ using the same binding site as that of L and this was confirmed by detailed 1H NMR studies and is discussed later.
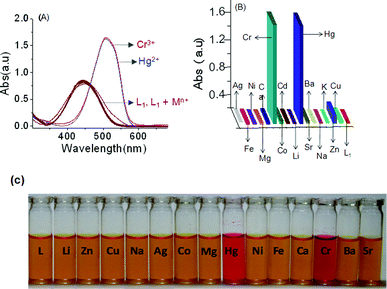 |
| | Fig. 2 (A) The absorbance spectra of the chemosensor (L1) (2.0 × 10⁻⁵ M) in the absence and presence of 10 mole equivalent of various metal ions, such as Cr3+ , Hg2+, Zn2+, Cu2+, Cd2+, Ni2+, Co3+, Ca2+, Fe2+, Al3+ Mg2+, Na+, Ag+, Sr2+, Ba2+, Sr2+, Li+ and Cs+ in CH3CN; (B) a bar diagram showing the change in the absorbance for L1 (2.0 × 10⁻⁵ M) in the presence of the above mentioned metal ions (2 × 10⁻⁴ M) in CH3CN at a λmax of 509 nm; (C) the colour variation of L1 (20 μM) in the presence of different metal ion (0.4 mM) in CH3CN. | |
![The electronic spectra of L1 (2.0 × 10⁻⁵ M) in the presence of varying concentrations of (A) Cr3+ (0 − 5.56 × 10⁻⁴ M) and (B) Hg2+ (0 − 4.60 × 10⁻⁴ M). Insets: the corresponding titration profiles for varying [Cr3+] or [Hg2+] (the ΔA at 509 nm vs. [Cr3+] or [Hg2+]) confirms the 1 : 1 binding stoichiometry.](/image/article/2012/RA/c2ra00788f/c2ra00788f-f3.gif) |
| | Fig. 3 The electronic spectra of L1 (2.0 × 10⁻⁵ M) in the presence of varying concentrations of (A) Cr3+ (0 − 5.56 × 10⁻⁴ M) and (B) Hg2+ (0 − 4.60 × 10⁻⁴ M). Insets: the corresponding titration profiles for varying [Cr3+] or [Hg2+] (the ΔA at 509 nm vs. [Cr3+] or [Hg2+]) confirms the 1![[thin space (1/6-em)]](https://www.rsc.org/images/entities/char_2009.gif) :1 binding stoichiometry. :1 binding stoichiometry. | |
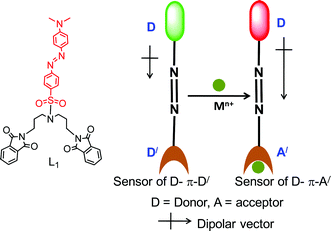
The spectrophotometric titrations with varying [Cr3+] and [Hg2+] are shown in Fig. 3A and 3B. The sigmodal curves were obtained by plotting the change in the absorbance intensity at 509 nm as a function of [Mn+] (where Mn+ is Hg2+ or Cr3+) and confirmed the 1:1 binding stoichiometry of L1·Cr3+ and L1·Hg2+. The binding stoichiometry was further confirmed by a non-linear least squares plot (ESI†) using eqn (4).14 The respective association constants (Ka) for the binding of L1 to Cr3+ and Hg2+ were 6.54 × 10⁴ M−1 and 4.31 × 10⁴ M−1, respectively, at 25 °C in CH3CN. The N,N'-dimethylamine functionality in L1 acts as a donor group, while the diazo and the phthalimide fragment act as acceptor groups with poor donating abilities. The addition of metal ions (Cr3+ and Hg2+) may result in the binding of the respective metal ion to the central tertiary amine along with the carbonyl “OPhthalimide” atom and this consequently results in the transformation of the donor-π-donor structure to a donor-π-acceptor structure (Scheme 2). This is expected to favour the photoinduced intramolecular charge transfer process with an associated red-shift (70 nm) in the absorption maxima of L1.
 |
| | Scheme 2 | |
Luminescence study
The emission spectrum of L1 (2.0 × 10⁻⁵ M) was recorded in CH3CN in the absence and presence of various metal ions upon excitation at 464 nm. However, the emission spectrum of compound L1 does not exhibit any obvious emission signal when excited at 464 nm. In the absence of any emission band, the quenching process was ascribe to the photo induced electron transfer (PET) process involving the lone pair of electrons from the tertiary amine functionality coupled with a photoactive signalling unit in L1.11 However, a significant enhancement in the emission intensity (a 22 fold increase for Cr3+ and a 20 fold increase for Hg2+) at 575 nm was observed upon binding of the reagent, L1, with Cr3+ or Hg2+ in a CH3CN solution (Fig. 4A). For all other cations, such as Li+, Na+, K+, Cs+, Ca2+, Mg2+, Sr2+, Ba2+, Zn2+, Cu2+, Cd2+, Ni2+, Co3+, Fe2+ and Ag+, no detectable increase in the emission intensity for L1 in the CH3CN was observed. Generally, receptors that show a “switch-on” rather than a “switch-off ” fluorescence response upon binding to an analyte is more advantageous, as this adds to the ease of the detection process, as well as permitting a lower detection limit with an improved signal-to-noise ratio. The enhancement in the emission intensity without any change in the excitation and emission wavelength suggests a potential PET-based process as the signal transduction mechanism.
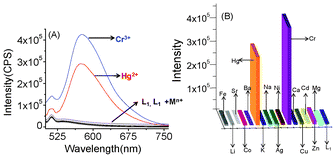 |
| | Fig. 4 (A) The emission spectra for the chemosensor (L1) (2.0 × 10⁻⁵ M) in the absence and presence of 10 mole equivalent of various metal ions, such as Cr3+ , Hg2+, Zn2+, Cu2+, Cd2+, Ni2+, Co3+, Ca2+, Fe2+, Al3+ Mg2+, Na+, Ag+, Sr2+, Ba2+, Sr2+, Li+ and Cs+ in CH3CN; (B) the luminescence response of L1 (2.0 × 10⁻⁵ M) to the above representative metal ions (2 × 10⁻⁴ M) in CH3CN. The emission intensity was monitored at 575 nm. | |
On binding to Cr3+ or Hg2+, the lone pair of electrons on the tertiary Namine atom becomes involved in the coordination and effectively interrupts the PET-based luminescence quenching process. This results in a switch-on luminescence response. Furthermore, the rigidity imparted to the receptor, L1, on coordination to the Cr3+ or Hg2+ may also contribute to its fluorescence enhancement by inhibiting non-radiative decay pathways through the restriction of vibrational and rotational relaxation deactivation processes. A systematic analysis (Benesi–Hilbebrand plot) of the luminescent titration profiles (Fig. 5) supports the formation of a 1:1 molecular assembly, while the association constant values (Ka) of 5.71 × 10⁴ M−1 (for Cr3+) and 3.88 × 10⁴ M−1 (for Hg2+) were obtained. These values are in close proximity to the values obtained from the spectrophotometric titrations.
![The changes in the emission spectra of L1 (2.0 × 10⁻⁵ M) in the presence of varying (A) [Cr3+] (0–4.0 × 10⁻⁴ M) and (B) [Hg2+] (0–5.0 × 10⁻⁴ M). Insets: Benesi–Hildebrand plots for the respective titrations with Cr3+ and Hg2+ showing a 1 : 1 binding stoichiometry.](/image/article/2012/RA/c2ra00788f/c2ra00788f-f5.gif) |
| | Fig. 5 The changes in the emission spectra of L1 (2.0 × 10⁻⁵ M) in the presence of varying (A) [Cr3+] (0–4.0 × 10⁻⁴ M) and (B) [Hg2+] (0–5.0 × 10⁻⁴ M). Insets: Benesi–Hildebrand plots for the respective titrations with Cr3+ and Hg2+ showing a 1:1 binding stoichiometry. | |
In the presence of excess of [Bu4N]I, the characteristic red colour of the L1·Hg2+ solution or the electronic spectra, with an absorbance maxima at 509 nm, was found to disappear, while the spectra of the free receptor (L1) with λmax at 440 nm was restored (Fig. 6A). The luminescence intensity of the L1·Hg2+ solution with λmax at 575 nm was also found to decrease with an increasing [I−] and, eventually, the emission band disappeared (Fig. 6D). These collectively show that Hg2+ sensing by L1 is a reversible process. However, L1·Cr3+ in solution did not exhibit any significant change in colour or luminescence intensity in the presence of externally added excesses of [Bu4N]I. This is further supported by the fact that the addition of Cr(ClO4)3 to the solution with L1·Hg2+ + excess [Bu4N]I induced a visually detectable change in the solution colour from yellow to red and a simultaneous new absorption spectral band for L1·Hg2+ at 509 nm with a concomitant decrease in the absorbance at 440 nm (Fig. 3 and 6A). A separate study also confirmed that the presence of [Bu4N]I had no effect on the absorption and emission profile of the free dye. Changes in both the absorption and emission spectral pattern of L1·Hg2+ in the presence of excess iodide suggest the formation of a stable iodide complex of Hg2+, for example HgI42−.9f,15
![(A) The absorbance spectra of (i) L1 (20 μM) + Hg2+ (80 μM) (ii) L1 + Hg2+ in the presence of [Bu4N]I (5 mM) and (iii) L1 + Hg2+ in the presence of [Bu4N]I (5 mM) + Cr3+ (80 μM) in an acetonitrile solution; (B) the bar diagram represents the absorbance intensities at 509 nm of the respective solutions containing (1) L1 + Hg2+, (2) L1 + Hg2+ + [Bu4N]I, (3) L1 + Hg2+ + [Bu4N]I + Cr3+ and (4) L1 + Cr3+ + [Bu4N]I; (C) shows the colour variation of the solution of L1 in the presence of different ions and reagent: (1) L1 (20 μM) only, (2) L1 in the presence of Hg2+ (80 μM), (3) L1 in the presence of Hg2+ and [Bu4N]I (5 mM), (4) L1 in the presence of Hg2+, [Bu4N]I and Cr3+ (80 μM); (D) the bar diagram represents the emission intensity of the solution containing (1) only L1, (2) L1 + Hg2+, (3) L1 + Cr3+ , (4) L1 + Hg2+ [Bu4N]I and (5) L1 + [Bu4N]I + Cr3+ at 575 nm in acetonitrile.](/image/article/2012/RA/c2ra00788f/c2ra00788f-f6.gif) |
| | Fig. 6 (A) The absorbance spectra of (i) L1 (20 μM) + Hg2+ (80 μM) (ii) L1 + Hg2+ in the presence of [Bu4N]I (5 mM) and (iii) L1 + Hg2+ in the presence of [Bu4N]I (5 mM) + Cr3+ (80 μM) in an acetonitrile solution; (B) the bar diagram represents the absorbance intensities at 509 nm of the respective solutions containing (1) L1 + Hg2+, (2) L1 + Hg2+ + [Bu4N]I, (3) L1 + Hg2+ + [Bu4N]I + Cr3+ and (4) L1 + Cr3+ + [Bu4N]I; (C) shows the colour variation of the solution of L1 in the presence of different ions and reagent: (1) L1 (20 μM) only, (2) L1 in the presence of Hg2+ (80 μM), (3) L1 in the presence of Hg2+ and [Bu4N]I (5 mM), (4) L1 in the presence of Hg2+, [Bu4N]I and Cr3+ (80 μM); (D) the bar diagram represents the emission intensity of the solution containing (1) only L1, (2) L1 + Hg2+, (3) L1 + Cr3+ , (4) L1 + Hg2+ [Bu4N]I and (5) L1 + [Bu4N]I + Cr3+ at 575 nm in acetonitrile. | |
The receptor, L1, failed to bind Cr3+ and Hg2+ in the aqueous medium due to the high and deleterious solvation energies of the respective cations. Thus, to avoid the competing solvation effect of water, we explored the possibility of using this reagent for the development of a paper test strip, which could be used for the semi-quantitative colorimetric detection of Cr3+ and Hg2+ present in neutral aqueous environments by the naked eye and, thus, appropriate for practical in the field applications.
Test paper detection
The possibility of using chemosensor L1 in the development of paper test strips was examined. Paper test strips were prepared by immersing the filter papers (Whatman filter paper No. 42) in a dichloromethane solution of L1 (0.002 M), which was then air dried. These test strips, containing L1, were then immersed in neutral aqueous solutions of the respective metal ions with varying concentrations (400 ppm to 10 ppm) for about 2–3 min and then air dried. The colour of these test strips was compared with one that was dipped only in a dichloromethane solution of L1. The colour of these strips turned red when dipped either in Cr3+ or Hg2+ solutions (Fig. 7) and the colour of the respective strip became lighter as the concentration of the respective metal ion in the aqueous solution decreased. This clearly revealed that these strips containing L1 could distinguish a concentration gradient of Cr3+ or Hg2+ in an aqueous solution through gradual changes in the visually detectable colour of the strips. The lowest concentration limit of the metal ions that could be detected from neutral aqueous solutions using these strips is 10 ppm. The change in colour seems to be more prominent for Hg2+. This can be rationalized if one considers the higher solvation energy of the Cr3+ ion (Hhyd = 4639 kJ mol−1) over that of the Hg2+ ion (Hhyd = 1824 kJ mol−1) in an aqueous medium. Thus, these test strips can be utilized for semi-quantitative in the field detection of these two ions present in neutral aqueous environments through a simple colour comparison performed by the naked eye using a dip-stick type test strip containing L1 and different standard solutions of the respective metal ions. Such examples of test strips for Hg2+ are very limited in the contemporary literature.16 To the best of our knowledge, the example of a test strip with such a detection limit is rare. However, for the Cr3+ ion, no such report is available in the literature.
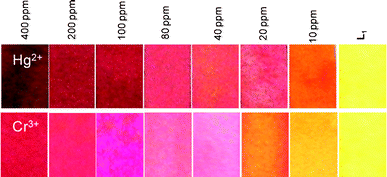 |
| | Fig. 7 The variation in the colour of the test strip for L1 after dipping in aqueous solutions with varying concentrations of Hg2+ and Cr3+. A solution of L1 with a concentration of 0.002 M was used to develop the strip. | |
The preferential formation of HgI42− in the presence of an excess of KI was successfully exploited for the development of a specific test paper sensor for Cr3+ in a pure aqueous medium.
The red coulored test strip, containing L1·Hg2+ (80 ppm of Hg2+) was developed following the procedure mentioned above and air dried. This was then dipped into an aqueous solution of KI (10.0 mM). The red colour of the strip disappeared and the original yellow colour of the test strip was restored (Fig. 8). However, a similar experiment with the red coloured test strip containing L1·Cr3+ (prepared using 100 ppm of Cr3+) did not show any visually detectable change in colour when dipped in an aqueous solution of KI (10.0 mM) and the colour remained comparable to the one shown in Fig. 7 for 100 ppm of Cr3+.
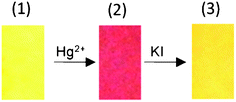 |
| | Fig. 8 The variation in the colour of the test strip for L1 only (1), L1 after dipping in an aqueous solution of Hg2+ (100 ppm) (2), and after dipping in an aqueous solution of KI (10 mM) (3). | |
1HNMR analysis
The metal ion binding affinity of the receptor, L1, was examined by detailed 1H NMR spectroscopy. The relative affinity of Hg2+ for L1 was also evident in the observed spectral shift of the 1H NMR spectra for L1 in the absence and presence of comparable concentrations of Hg2+ (Fig. 9). An upfield shift in the 1H NMR signals for most of the protons of L1 was observed. Such an upfield shift for most of the proton signals is not an unusual phenomenon and not very uncommon in the literature.9a,14 For L1, upfield shifts of 0.0395 ppm (for H2), 0.0613 ppm (for H1) and 0.045 ppm (for H3) were observed, while a downfield shift of 0.36 ppm was noted for H6 upon binding to Hg2+. Noticeable upfield shifts in the 1H NMR signals were also observed for most of the aromatic protons, except H7. An upfield shift of 0.0631 ppm was observed for H8 and H10 on binding to Hg2+. The signals for H4 and H5 became broad upon binding of the CO group to Hg2+ with an associated upfield shift of ∼0.1 ppm, while for H7, a downfield shift of 0.376 ppm was noticed. The 1H NMR spectra of the two model receptors, L and L2, were also recorded in the absence and presence of Hg2+ for the unambiguous assignment of the probable binding mode between L1 and Hg2+ (ESI†). Prominent upfield shifts for the aliphatic, as well as the aromatic protons for L, were observed when the spectra were recorded in the presence of Hg2+. Thus, the nature of the shifts in the 1H NMR spectra for L and L1 is similar, which signifies a similar binding mode for L and L1 towards Hg2+, which proceeds through one NAmine and two OPhthalimide centres. The shifts for the 1H NMR signals of H3/, H4/ and H5/ of L2 upon addition of an excess (25 mole equivalents) of Hg2+ were only within ∼0.0004 ppm, a value that is within the limit of experimental error; while that for H2/ was 0.0032 ppm. The shift in the Δδ value for H6/ is 0.008 ppm. These minor shifts in the δ values for L2 (ESI†), as compared to the shift observed for L and L1 upon binding to Hg2+, tend to nullify the possibilty of coordination either through the aromatic part or the –NMe2 fragment of L2. The similarities in the chemical shift patterns for L and L1 confirm that the NAmine and the two OPhthalimide centres of L and L1 are actually involved in the coordination to the Hg2+ centre. As expected, no significant 1H NMR spectral change for L1 was observed in the presence of Cr3+.
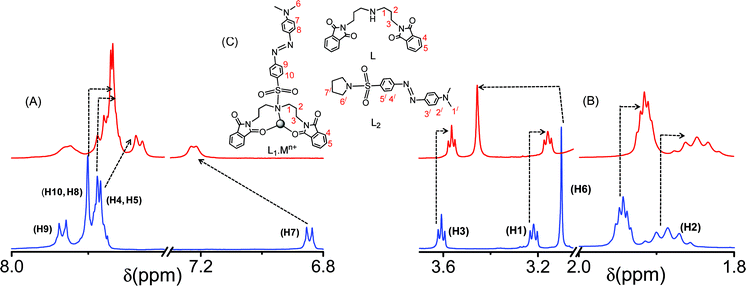 |
| | Fig. 9 The 1H NMR spectra of L1 in the absence and presence of Hg2+ in CD3CN, (A) the change in the aromatic region, (B) the change in the aliphatic region, and (C) represents the probable binding mode of L1 with the metal ions (Hg2+, Cr3+) and the molecular structures for L and L2. | |
Experimental section
Materials and methods
Phthalic anhydride, bis(3-aminopropyl)amine-1,4′-sulfonyl chloride, 4-(dimethylaminobenzene)azo benzene, the percholarate salts of the different cations (Cr3+, Hg2+, Zn2+, Cu2+, Cd2+, Ni2+, Co3+, Ca2+, Fe2+, Al3+ Mg2+, Na+, Ag+, Sr2+, Ba2+, Sr2+, Li+, Cs+etc) were obtained from Sigma–Aldrich and used as received. All the other reagents used were procured from S. D Fine Chemicals, India. Acetonitrile was procured from Merck, India and all solvents were dried and distilled prior to use.
Instrumentation
The electronic spectra were recorded using a Cary 500 Scan UV–vis–NIR spectrometer, while the steady-state luminescence spectra were recorded on a HORIBA JOBIN YVON spectrofluorometer . 1H-NMR spectra were recorded on a Bruker 200 MHz, 500 MHz FT NMR (Model: Avance-DPX 200) using CD3CN as the solvent and tetramethylsilane (TMS) as an internal standard. The FTIR spectra were recorded using a Perkin--Elmer Spectra GX 2000 spectrometer.
Synthesis of bis(phthalimidylpropyl)amine (L).
The known procedure was adopted for the synthesis of L.11 Phthalic anhydride (4.74 g, 32 mmol) was added to a solution of bis(3-aminopropyl)amine-1 (2.0 g, 15.24 mmol) in 150 ml of acetonitrile as the solvent. The reaction mixture was stirred under reflux for 2 days. Then, the solvent was evaporated off and 200 ml of ethanol was added to the solid residue. After stirring for 5 h, the white precipitates were filtered, collected and dried over P2O5 to give the desired compound in pure form and was used for reaction without any further purification (Yield: 4.15 g; 70%). 1H NMR (200 MHz, CDCl3, 25 °C, TMS); δ (ppm): 7.82–7.78 (m, 4H, ArH), 7.71–7.66 (m, 4H, ArH) , 3.77 (t, J = 6.6 Hz, 4H, nCH2), 2.78 (t, J = 6.6 Hz, 4H, –CH2), 1.99–1.92 (m, 4H, –CH2). IR (KBr): νmax/cm−1 = 3461, 3031, 2936, 2816, 1771, 1711, 1640, 1398, 1364, 1044, 719, 530. ESI-MS (m+/z): 392.16 [M + H]+ (90%). Elemental analysis for C22H21N3O4 (391.15): calculated, C 61.51, H 5.41, N 10.74%; found, C 61.6, H 5.3, N 10.7%.
Synthesis of L1.
This reagent was also synthesized following the reported procedure with slight modification in the methodology for the purification process.11 Bis(phthalimidylpropyl)amine (L; 0.5 g, 1.278 mmol) and K2CO3 (0.265 g; 1.917 mmol) were added to 100 ml dry acetonitrile. The reaction mixture was refluxed for 2 h and then 4-(dimethylamino)phenyl)diazenyl)benzene-1-sulfonyl chloride (0.516 g; 1.6 mmol), dissolved in 40 ml dry acetonitrile, was added in a dropwise manner to the reaction mixture. After the complete addition, the mixture was refluxed for 24 h under nitrogen gas and the solution colour changed from red to orange. The reaction mixture was filtered and the solvent from the filtrate was removed under reduced pressure. Then, the desired compound was extracted thrice in chloroform (3 × 40 ml), while the undesired impurities in the aqueous layer were discarded. The organic phase was collected and dried over anhydrous sodium sulphate and a light orange oily residue was obtained upon removal of the solvent under vacuum. This oily residue was sonicated for 10 min with n-hexane, while an orange solid precipitated. This was collected by filtration and dried to give L1 (Yield: 0.55 g; 63%) in pure form. 1H NMR (500 MHz, CD3CN, 25 °C, TMS); δ (ppm): 7.86 (d, J = 9 Hz, 2H; ArH), 7.79 (m, 4H, ArH), 7.77–7.77 (m, 8H, ArH), 6.83 (d, J = 9 Hz, 2H, ArH), 3.60 (t, J = 7 Hz, 4H, –CH2), 3.23 (t, J = 7 Hz, 4H, –CH2), 3.09 (s, 6H, –CH3), 1.91–1.85 (m, 4H, –CH2), IR (KBr); νmax/cm−1: 3460, 3069, 2926, 1770, 1711, 1601, 1521, 1366, 1332, 1132, 712, 594. ESI-MS (m+/z): 679.09 (M + H)+ (5%), 701.03 (M + Na)+ (100%), C36H34N6O6S (678.23). Elemental analysis: calculated, C 63.70, H 5.05, N 12.38%; found, C 63.8, H 5.1, N 12.3%.
Synthesis of L2.
4-(4-dimethylamino-phenylazo)benzene sulphonyl chloride (100 mg, 0.31 mM) was added to 15 ml of pyrrolidine (in excess) under an inert atmosphere and heated to reflux for 24 h. Then, the reaction mixture was evaporated to obtain the dry solid. To get L2 in a pure form the crude product was recrystallised from methanol in 85% yield. 1H NMR (500 MHz, CD3OD, 25 °C, TMS); δ (ppm): 7.93 (d, J = 8.4 Hz, Ar–H5/; ArH), 7.87–7.8 (m, 4H, Ar–H3/, H4/) 6.83 (d, J = 9 Hz, ArH2/), 3.32–3.27 (t, 4H, H6/(–CH2)), 3.1 (s, H1/ (–NMe2) 2.03–1.96 (m, 4H, H7/); νmax/cm−1: 3454, 3062, 2920, 1771, 1711, 1601, 1521, 1366, 1332, 1128, 710, 594. ESI-MS (m+/z): 359.18 (M + H)+ (10%), Elemental analysis: calculated, C 60.3, H 6.2, N 15.6%; found, C 60.4, H 6.1, N 15.5%.
Spectrophotometric titration
A 1.00 × 10⁻⁴ M solution of L1 in acetonitrile was prepared and stored in the dark. This solution was used for all spectroscopic studies after appropriate dilution. 1.0 × 10⁻⁴ M solutions of the perchlorate salt of the respective cations were prepared in pre-dried and distilled acetonitrile and were stored under an inert atmosphere. Solutions of L1 were further diluted for spectroscopic titrations and the effective final concentration was adjusted to 2.0 × 10⁻⁵ M, while the final analyte (cation) concentration for titration was varied from 0 to 6.0 × 10⁻⁴ M.
The equilibrium of complexation between L1 and Mn+ was evaluated using the non-linear least squares method (eqn (4)–(6)) for the following reaction:
The stability constant of the complex could be define as:
where, M
n+ stands for Cr
3+ and Hg
2+. Neither
L1, Cr
3+ or Hg
2+ has an absorption maxima above 440 nm. Thus, the new absorbance maxima that developed at around 509 nm upon addition of Cr
3+ or Hg
2+ was attributed to the formation of a coordination complex (
eqn (a)). We have selected these two wavelengths for our studies. Respective molar extinction coefficient of
L1 at 440 and 509 nm are
ε{L1}440 and
ε{L1}509:
| | | A440 = ε{L1}440 × l ×[L1] + ε{MnL1}440 × l × [ML1] | (2) |
| | | A508 = ε{L1}509 × l × [L1] + ε{MnL1}509 × l × [ML1] | (3) |
ε{ML1}440 and
ε{ML1}509 are the molar extinction coefficients of [M
n+]L
1 at 440 and 509 nm, respectively. For an optical path length (
l) of 1 cm, as used in the present study, the ratio
A440/
A509 can be expressed by
eqn (4):
| | | A440/A509= (Knε{MnL1}440[M]n+ + ε{L1}440)/(Knε{MnL1}509[M]n+ + ε{L1}509) | (4) |
The overall concentration of the cation is CM and thus:
| | | Thus, [M] = CM − n[MnL1] = (CM − nA440)/ε{MnL1}440 | (6) |
The absorbance data were analysed using a non-linear least squares method.17 Appropriate substitutions and approximations were used for the evaluation of the stoichiometry and affinity constant (n and Kn, respectively). The analysis provided the binding stoichiometry of the complex formed between L1 and Cr3+ or Hg2+ (ESI†) and the association constant for the respective metal ion.
A stock solution of L1 with an initial concentration of 1.0 × 10⁻⁴ M in CH3CN was prepared and stored in the dark. For all measurements, a λExt = 464 nm was used (with excitation and emission slit widths of 5 nm). This stock solution was used for recording the changes in the emission spectral pattern for L1 in the presence of various externally added cations (Cr3+, Hg2+, Zn2+, Cu2+, Cd2+, Ni2+, Co3+, Ca2+, Fe2+, Al3+ Mg2+, Na+, Ag+, Sr2+, Ba2+, Sr2+, Li+ and Cs+) and the effective concentration of L1 was maintained at 2.0 × 10⁻⁵ M. Two different luminescence titrations were carried out using L1 with varying concentrations of the perchlorate salt of Cr3+ (0–4.0 × 10⁻⁴ M) and Hg2+ (0–5.0 × 10⁻⁴ M) in CH3CN. The affinity constant and 1:1 binding stoichiometry for the respective metal ions were calculated using the Benesi–Hildebrand method and related expression as shown in eqn (7).10e,18
| |
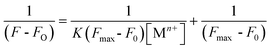
| (7) |
where
F0 is the emission intensity of
L1 ,
F is the emission intensity obtained with externally added metal ions,
K is the association constant (M
−1) and [M
n+] is the concentration of the externally added metal ion. As shown in
Fig. 5 (C) and (D), the plot of 1/(
F −
F0) against 1/[M
n+] shows a linear relationship, indicating that
L1 indeed associates with M
n+ (Cr
3+ or Hg
2+) in a 1
:
1 stoichiometry.
Conclusions
Experimental studies revealed that a molecular receptor, L1, binds only to Cr3+ and Hg2+ among other biologically relevant common alkali and transition metal ions in acetonitrile. The binding of Cr3+ and Hg2+ to L1 gave rise to the visually detectable change in colour from yellow to red. The receptor, L1, was also found to act as a “turn-on” fluorescence sensor for these two ions upon formation of L1·Cr3+ or L1·Hg2+ in CH3CN. This chelation enhanced fluorescence response was attributed to the interruption of the PET process, which was otherwise operational for the free receptor molecule (L1). The probable binding mode for the receptor (L1) to the metal ions was established through detailed 1H NMR studies of L1 and the related model receptors (L and L2). A test strip from readily available filter papers was developed using the reagent, L1. This reagent was used for the semi-quantitative in the field visual detection of these two ions present in neutral aqueous medium. The lowest concentration limit of the metal ions that could be detected using these test strips was 10 ppm. More interestingly, in the presence of an excess of KI, these paper test strips could be used for the specific recognition of Cr3+ in an aqueous solution that contained both Hg2+ and Cr3+. Preferential binding of Hg2+ to I− allowed the specific binding of the reagent, L1, to Cr3+. To the best of our knowledge, for Hg2+, there are only a few previous examples where detection limits lower than the present test strip are reported, while for the Cr3+ ion no such report is available in the literature.
Acknowledgements
DST and CSIR (India) have supported this work. P. D and A. G. Acknowledge CSIR, New Delhi for Sr. research fellowship.
References
-
(a) For selected examples, see: J. J. R. Frausto da Silva and R. J. P. Williams, The Biological chemistry of elements: The Inorganic Chemistry of Life, Oxford University Press, Oxford, 1993 Search PubMed;
(b) M. Olivares and M. Gonzalez, Am. J. Clin, Nutr, 1998, 67, 952S CAS;
(c) M. C. Linder and M. Hazegh-Azam, Am. J. Clin. Nutr., 1996, 63, 797S CAS;
(d)
Bioinorganic chemistry, ed. I. Bertini, H. B. Gray, S. J. Lippard and J. S. Valentine, University science book, Mill Valley, CA. 1994 Search PubMed;
(e)
Functional Synthetic Receptors ed. T. Schraderr and A. D. Hamilton, Wiley-VCH: Weinheim, Germany, 2005 Search PubMed;
(f) J. P. Desergne and A. W. Czarnik, Chemosensors of ion and molecule recognition; Kluwer: Dordrecht, 1997 Search PubMed.
-
(a) E. M. Nolan and S. J. Lippard, Chem. Rev., 2008, 108, 3443 CrossRef CAS;
(b) Z. Yang, C. Yan, Y. Chen, C. Zhu, C. Zhu, C. Zhang, X. Dong, W. Yang, Z. Guo, Y. Lu and W. He, Dalton Trans, 2011, 40, 2173 RSC;
(c) D. W. Domaille, E. L. Que and C. J. Chang, Nat. Chem. Biol., 2008, 4, 168 CrossRef CAS;
(d) B. Valeur and I. Leary, Coord. Chem. Rev., 2000, 205, 3 CrossRef;
(e) J. W. Lee, H. S. Jung, P. S. Kwon, J. W. Kim, R. A. Bartsch, Y. Kim, S. J. Kim and J. S. Kim, Org. Lett., 2008, 10, 3801 CrossRef CAS;
(f) A. P. De Silva, H. Q. N. Gunaratne, T. Gunnlaugsson, A. J. M. Huxley, C. P. McCoy, J. T. Rademacher and T. E. Rice, Chem. Rev., 1997, 97, 1515 CrossRef;
(g) T. W. Bell and N. M. Hext, Chem. Soc. Rev., 2004, 33, 589 RSC;
(h) M. Suresh, S. Mishra, S. K. Mishra, E. Suresh, A. K. Mondal, A. Shrivastav and A. Das, Org. Lett., 2009, 11, 2740 CrossRef CAS.
-
(a) P. M. Kopittke, C. J. Asher and N. W. Menizes, Plant Soil, 2007, 292, 283 Search PubMed;
(b) M. B. Jones and T. C. Hutchinson, New Phytol., 1988, 108, 451 Search PubMed;
(c)
B. J. Alloway, E.Steinnes, Cadmium in Soils and Plant, Kluwer Academic Publishers, Boston, 1999 Search PubMed;
(d)
G. F. Nordberg, R. F. M. Herber and L. Alessio, Cadmium in the Human Environment, Oxford University Press, Oxford, 1992 Search PubMed.
-
(a) O. Malm, Environ. Res., 1998, 77, 73 CrossRef CAS;
(b) Mercury Update Impact of Fish Advisories: EPA Fact Sheet, EPA-823-F-01-011, EPA Office of Water, Washington, DC, 2001;
(c) P. Chu and D. B. Porcella, Water, Air, Soil Pollut., 1995, 80, 135 CrossRef CAS;
(d) A. Renzoni, F. Zino and E. Fraanchi, Environ. Res., 1998, 77, 68 CrossRef CAS;
(e) T. W. Clarkson, L. Magoos and G. J. N. Myers, N. Engl. J. Med., 2003, 349, 1731 CrossRef CAS;
(f) M. Suresh, A. K. Mondal, S. Saha, E. Suresh, A. Mondali, R. D. Liddo, P. P. Parnigotto and A. Das, Org. Lett., 2010, 12, 5406 CrossRef CAS.
- M. Zayed and T. Norman, Plant Soil, 2003, 249, 139 CrossRef.
-
(a) H. H. Harris, I. J. Pickering and G. N. George, Science, 2003, 301, 1203 CrossRef CAS;
(b) M. Harada, Crit. Rev. Toxicol., 1995, 25, 1 CrossRef CAS;
(c) G. E. McKeown- Eyssen, J. Ruedy and A. Neims, Am. J. Epidemol., 1983, 118, 470 Search PubMed;
(d) P. Grandjean, P. Weihe, R. F. White and F. Debes, Environ. Res., 1998, 77, 165 CrossRef CAS.
- M. Nendza, T. Herbst, C. Kussatz and A. Gies, Chemosphere, 1997, 35, 1875 CrossRef CAS.
-
(a) P. B. Tchounwou, W. K. Ayensu, N. Ninashvili and D. Sutton, Environ. Toxicol., 2003, 18, 149 CrossRef CAS;
(b) M. Farina, F. A. Soares, A. Feoli, C. Roehring, A. M. Brusque, L. Rotta, M. L. Perry, D.O. Souja and J. B. T. Rocha, Nutrition, 2003, 19, 531 Search PubMed.
-
(a) P. Mahato, A. Ghosh, S. Saha, S. Mishra, S. K. Mishra and A. Das, Inorg. Chem., 2010, 49, 11485 CrossRef CAS;
(b) M. Suresh, A. Shrivastava, S. Mishra, E. Suresh and A. Das, Org. Lett., 2008, 10, 3013 CrossRef CAS;
(c) M. Suresh, S. K. Mishra, S. Mishra and A. Das, Chem. Commun., 2009, 2496 RSC;
(d) J. Li, J. Yao and W. Zhong, Chem. Commun., 2009, 4962 RSC;
(e) D. Wu, A. B. Descalzo, F. Weik, F. Emmerling, Z. Shen, X. Z. You and K. Rurack, Angew. Chem., Int. Ed., 2008, 47, 193 CrossRef CAS;
(f) H. Zheng, Z-H. Qian, L. Xu, F-F. Yuan, L-D. Lan and J-G. Xu, Org. Lett., 2006, 8, 859 CrossRef CAS;
(g) X. Guo, X. Qian and L. Jia, J. Am. Chem. Soc., 2004, 126, 2272 CrossRef CAS;
(h) J. Mao, L. Wang, W. Dou, X. Tang, Y. Yan and W. Liu, Org. Lett., 2007, 9, 4567 CrossRef CAS;
(i) M. Sarkar, S. Banthia and A. Samanta, Tetrahedron Lett., 2006, 47, 7575 CrossRef CAS;
(j) Z. Zhou, M. Yu, H. Yang, K. Huang, F. Li, T. Yi and C. Huang, Chem. Commun., 2008, 3387 RSC;
(k) C. S. Lim, D. W. Kang, Y. S. Tian, J. H. Han, H. L. Hwang and B. R. Cho, Chem. Commun., 2010, 46, 2388 RSC.
-
(a) M. Suresh, A. Ghosh and A. Das, Chem. Commun., 2008, 3906 RSC;
(b) I-T. Ho, G. H. Lee and W. S. Chung, J. Org. Chem., 2007, 72, 2434 CrossRef CAS;
(c) Y. F. Cheng, D. T. Zhao, M. Zhang, Z-Q. Liu, Y. F. Zhou, T. M. Shu, F. Y. Li, T. Yi and C-H. Haung, Tetrahedron Lett., 2006, 47, 6413 CrossRef CAS;
(d) J. Huang, Y. Xu and X. Qian, J. Org. Chem., 2009, 74, 2167 CrossRef CAS;
(e) Y. Shiraishi, S. Sumiya, Y. Kohono and T. Hirai, J. Org. Chem., 2008, 73, 8571 CrossRef CAS;
(f) B. N. Ahamed, M. Arunachalam and P. Ghosh, Inorg. Chem., 2010, 49, 4447 CrossRef CAS;
(g) B. N. Ahamed and P. Ghosh, Inorg. Chim. Acta, 2011, 372, 100 Search PubMed.
- P. Das, A. Ghosh and A. Das, Inorg. Chem., 2010, 49, 6909 CrossRef CAS.
-
(a) P. Kar, S. Verma, A. Sen, A. Das, B. Ganguly and H. N. Ghosh, Inorg. Chem., 2010, 49, 4167 CrossRef CAS;
(b) N. R. M. Simpson, M. D. Ward, A. F. Morales and F. Barigelletti, J. Chem. Soc., Dalton Trans., 2002, 2449 RSC;
(c) M. D. Ward, Coord. Chem. Rev., 2006, 250, 3128 CrossRef CAS.
-
(a) Y. Lingappa, S. Rao, S. R. V. Ravikumar and P. A. Rao, Radiat. Eff. Defects Solids, 2007, 162, 11 Search PubMed;
(b) G. Narain and P. Kla, Aust. J. Chem., 1967, 20, 227 Search PubMed.
-
(a) Z. Liu, L. Jiang, Z. Lianga and Y. Gaoa, Tetrahedron, 2006, 62, 3214 CrossRef CAS;
(b) B. Valeur, J. Pouget and J. Bouson, J. Phys. Chem., 1992, 96, 6545 CrossRef CAS.
- S. K. Ko, Y.K. Yang, J. S. Tae and I. J. Sin, J. Am. Chem. Soc., 2006, 128, 14150 CrossRef CAS.
-
(a) M. H. Lee, S. J. Lee, J. H. Jung, H. Lim and J. S. Kim, Tett. Lett., 2007, 120, 87 Search PubMed;
(b) E. Coronado, J. R. Galán-Mascaro, C. M. Gastaldo, E. Palomares, J. R. Durrant, R. Viler, M. Gratzel and M. K. Nazeeruddin, J. Am. Chem. Soc., 2005, 127, 12351 CrossRef CAS;
(c) D. Wu, W. Huang, Z. Lin, C. Duan, C. He, S. Wu and D. Wang, Inorg. Chem., 2008, 47, 7190 CrossRef CAS;
(d) R. Shunmugam, G. J. Gabriel, C. E. Smith, K. A. Aamer and G. N. Tew, Chem.–Eur. J., 2008, 14, 3904 CrossRef CAS.
-
(a) Y. Shraishi, H. Maehara, K. Ishizumi and T. Hirai, Org. Lett., 2007, 9, 3125 CrossRef CAS;
(b) A. K. Mondal, M. Suresh, E. Suresh, S. K. Mishra, S. Mishra and A. Das, Sens. Actuators, B, 2010, 145, 32 Search PubMed.
-
(a) H. A. Benesi and J. H. Hildebrand, J. Am. Chem. Soc., 1949, 71, 2703 CrossRef CAS;
(b) C. Yang, L. Liu, T. W. Mu and Q.-X. Guo, Anal. Sci., 2000, 16, 537 CrossRef CAS;
(c) M. I. Rodriguez-Caceres, R. A. Agbaria and I. M. Warner, J. Fluoresc., 2005, 15, 185 CrossRef CAS.
Footnote |
| † Electronic Supplementary Information (ESI) available: characterisation of L, L1 and L2, 1H NMR scanning of L and L2 with Hg2+ , non-linear least squares method from UV–vis titration UV spectra of L in the presence of Cr3+ and Hg2+]. See DOI: 10.1039/c2ra00788f/ |
|
| This journal is © The Royal Society of Chemistry 2012 |
Click here to see how this site uses Cookies. View our privacy policy here.