Electro-optical properties of copper phthalocyanines (CuPc) vacuum deposited thin films
Sawanta S.
Mali
a,
D. S.
Dalavi
a,
P. N.
Bhosale
a,
C. A.
Betty
b,
A. K.
Chauhan
c and
P. S.
Patil
*a
aThin Film Materials Laboratory, Department of Physics, Shivaji University, Kolhapur-416 004, India. E-mail: psp_phy@unishivaji.ac.in; malisawantasubhash@gmail.com; sawantamali@yahoo.co.in; Fax: +91-231-2691533; Tel: +91-231-2609229
bChemistry Division, Bhabha Atomic Research Centre (BARC), Mumbai-85, India
cTechnical Physics Division, Bhabha Atomic Research Centre (BARC), Mumbai-85, India
First published on 18th January 2012
Abstract
Copper phthalocyanine (CuPc) thin films grown on glass substrates by the vacuum deposition method were investigated using photo absorption–transmission as well as photoreflectance spectroscopy with respect to different thickness. The surface morphology was investigated using scanning electron microscopy (SEM). Structural properties were studied by grazing angle XRD diffraction. The vibrational studies were carried out using Fourier transform infrared spectroscopy (FT-IR). The wettability was studied using a contact angle meter.
1. Introduction
Metal-free (H2Pc) and metal-substituted (MPc) phthalocyanines are planar conjugated aromatic macrocycles forming molecular crystals with conductivities ranging from 10−12 up to 10−4 S m2, showing a rich absorption spectrum in the ultraviolet and visible ranges as well as effective catalytic properties. During the past decades, a great deal of interest has been focused on the synthesis of metallophthalocyanine (MPCs) and its derivatives due to their applications in many fields such as liquid crystals,1 chemical sensors,2 semiconductors,3 photoconductors,4 electrochromic displays,5 functional dyes,6 optical recording materials,7 photodynamic therapy,8 gas sensors9 and solar cells.10 Since their unexpected discovery in 1907 by Braun and Tcherniac,11phthalocyanines (Pcs) have become a major pigment in the dye industry because of their unique color, low manufacturing cost, high stability, and non-toxicity. Metallophthalocyanines (MPc) are a class of macrocyclic compounds possessing a system of conjugated π-electrons. These coloured macrocycles which exhibit fascinating physical properties are versatile building blocks for fabricating materials at the nanometre scale. Their strong Q-band absorption (600–800 nm) and excellent photoinduced charge generation efficiency facilitate their application in the xerographic photoreceptors of laser printers.12 In addition, this class of functional materials also has potential applications in the treatment of a range of cancers, infectious diseases, eye, and neurodegenerative diseases. One of the most studied metallophthalocyanines is copper phthalocyanine (CuPc). Because of the interesting electronic properties of copper phthalocyanine (CuPc), we here describe its synthesis and spectroscopic properties. In applications CuPc is mainly used as thin films, which can be easily deposited by high vacuum evaporation. The CuPc film shows different crystallographic phases, depending on deposition conditions. Generally, the powder phase shows the so-called “α-phase” (a = 519.407 Å, b = 54.79 Å, c = 514.628 Å, b = 5120°). If the substrate, during deposition, is kept at room temperature, the deposited film grows in the α phase (a = 525.92 Å, b = 53.79 Å, and c = 523.92 Å, b590.4°), whereas the β phase is observed if the substrate is kept at high temperature ∼210 °C. The α→β transition can be also observed through an annealing procedure in N2 at 350 °C.13In the present study, CuPc thin films were deposited by vacuum deposition and their optical properties were studied.
2. Experimental
In a typical experiment, >98% pure copper phthalocyanine (CuPc) polymorphic was used as the starting material. The additional impurities in all the samples are likely to be largely inorganic salts incorporated during the preparation. Removal of this is extremely difficult and will not interfere with the resonant spectra obtained from the organic species. Thin films of CuPc were deposited by vacuum evaporation on glass substrates using 97% pure (Aldrich) powder. Prior to the deposition, glass substrates were successively cleaned in detergent, acetone and ethanol and dried in an oven. The substrate was located about 15 cm from the source and kept at room temperature. The evaporation process is performed within a vacuum chamber under 5 × 10⁻⁵ mbar with a deposition rate 0.3–0.5 Å s−1. The electric current was adjusted slowly from 0.0 up to 2.2 A (10 V) to heat the molybdenum (Mo) boat, then the CuPc starts evaporating and films of ∼20 nm thickness were deposited at room temperature. The film thicknesses were controlled by evaporation time and the resulting film thicknesses were measured using a surface profiler (Ambios XP-1).The optical absorption–transmission studies were carried out using UV-Vis spectrophotometer (Shimadzu, model UV-1800, Japan) in the wavelength range 300–1100 nm with 0.01 nm resolutions. The optical reflection spectra were recorded using a StellerNet Inc. USA Reflectometer in the wavelength range 190–850 nm, with 0.01 nm resolutions. Fourier transform infrared (FT-IR) spectroscopy was also used to confirm the CuPc phase, in which the powdered material collected from the deposited film was characterized by infrared spectrometer (PerkinElmer, model 783, USA) in the spectral range 450–4000 cm−1 with a resolution of 1 cm−1. To record the IR spectrograms, a pellet was prepared by mixing KBr with collected powders of respective films in 300![[thin space (1/6-em)]](https://www.rsc.org/images/entities/char_2009.gif) :
:![[thin space (1/6-em)]](https://www.rsc.org/images/entities/char_2009.gif) 1 proportion. The surface morphological features of the films were analyzed from scanning electron microscopy (SEM), which were recorded using a scanning electron microscope (Model JEOL-JSM-6360, Japan), operated at 20 kV. Structure of the films was determined by grazing angle (angle fixed at 0.1°) X-ray diffraction measurements (Rigaku, Model RINT 2000 Tmax) carried out using Cu K-alpha radiation.
1 proportion. The surface morphological features of the films were analyzed from scanning electron microscopy (SEM), which were recorded using a scanning electron microscope (Model JEOL-JSM-6360, Japan), operated at 20 kV. Structure of the films was determined by grazing angle (angle fixed at 0.1°) X-ray diffraction measurements (Rigaku, Model RINT 2000 Tmax) carried out using Cu K-alpha radiation.
3. Results and discussion
Copper phthalocyanine (CuPc) molecules (Fig. 1) have two main absorption bands in the visible/near-UV region of the spectrum. The lower energy band, occurring at around 650 nm, is generally known as the Q band (Fig. 2). In the solid state, these bands are broadened and overlap so that phthalocyanines absorb light throughout the entire visible region of the electromagnetic spectrum.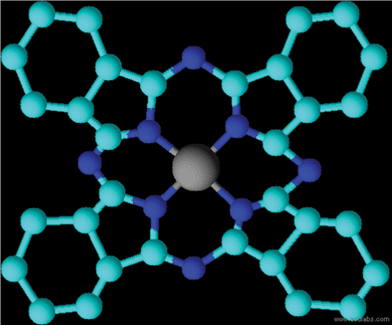 | ||
| Fig. 1 Molecular structure of copper phthalocyanine (CuPc). | ||
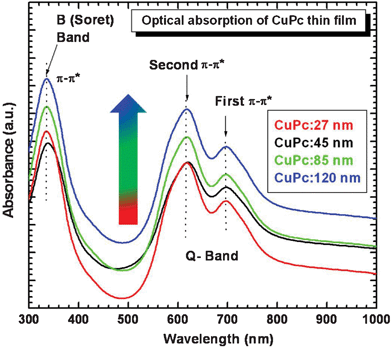 | ||
| Fig. 2 Optical absorbance of the CuPc thin-films deposited at different thickness. | ||
Fig. 2 shows the optical absorption spectra of CuPc thin films deposited at different film thicknesses. It has been suggested that the UV-Vis spectrum of MPcs originates from the molecular orbitals within the aromatic 18 π-electron system and from overlapping orbitals on the central metal. Two absorption bands, centered at 770 nm (1.61 eV) and 552 nm (2.24 eV), respectively, are observed in the band-to-band transitions region, which correspond to the known Q band.14,15 It has a doublet due to Davydov splitting (ΔQ). These representing the first and second π–π* transition appear at 770 and 552 nm respectively.16,17 For the Q-band of the CuPc film, the intensity of the higher energy maximum peak (∼553 nm) is larger than that of the lower energy peak (∼676 nm). This behavior represents the typical features of the α-phase of CuPc.18 The transmittance spectra of the CuPc thin films are shown in Fig. 3.
 | ||
| Fig. 3 Optical transmittance of the CuPc thin-films deposited at different thickness. | ||
The optical band gap of the CuPc samples has been estimated by performing a fit to the exponential part of the spectra using the equation for allowed direct transitions:19,20
| α(hv) = A·(hυ − Eg)2 | (1) |
 | ||
| Fig. 4 Plot of (αhν)2versus energy (hν) and calculation of the optical gap for samples deposited at different thicknesses. | ||
The photoreflectance spectra of a thin CuPc films deposited on a glass substrate is presented in Fig. 5. It is clearly seen that observed Q-band transitions, which are weakly visible in the reflection spectrum, are strongly enhanced in the case of the photoreflectance spectrum (PR). This PR spectrum has two distinct features at about 769–802 nm (1.61–1.55 eV) and 674–672 nm (1.85–1.84 eV), and an additional transition at about 552–548 nm (2.28–2.24 eV). The reflectance spectrum additionally exhibits interference oscillations for energies below 1.6 eV. These oscillations are probably responsible for the so-called low energy interference oscillations (LEIOs), which Michał et al.21 and Ganzha et al. have also observed.22 Knupfer et al. investigated these four transitions in the Q-band range using electron energy loss spectroscopy.23 They showed that the spectral weight of the electronic excitations at about 1.63 eV has a maximum at finite momentum transfer, which indicates the presence of charge transfer excitations at the excitation onset. The three components at higher excitation energy (1.75, 1.98, 2.17 eV) were decreased monotonically with momentum transfer and attributed to the intramolecular excitations. In our case the, the absorption spectra reveal the three components at 1.61, 1.85 and 2.05 eV, which suggest intramolecular excitations. The electronic transition from π–π* orbitals results in the intense band 335 nm (3.70 eV) called the Soret or B-band in the UV spectral region.
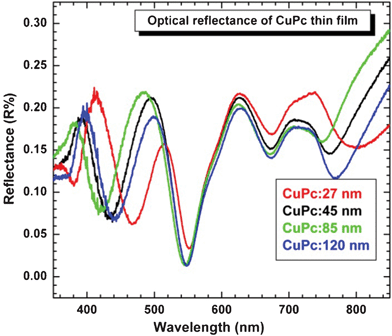 | ||
| Fig. 5 Optical reflectance as a function of film thickness. | ||
Fig. 6 shows the IR spectra of all the deposited CuPc thin films. The IR characteristic peaks due to the vibration mode of Cu–N bonding and the C![[double bond, length as m-dash]](https://www.rsc.org/images/entities/char_e001.gif) N–C at bridge sites are observed at 1166 and 1287 (and 1334) cm−1,24 respectively. The spectra show the characteristic IR bands of CuPc (such as those at 722, 750, 900, 1080 and 1330 cm−1).25,26Fig. 6 shows that peaks of a C–H (CH3– and –CH2–) stretching vibrations are at 2850 and 2917 cm−1. It is well-known that the CuPcα and β polymorphs are characterized by some selected IR peaks related to the short-range neighbor interactions. Here, the two peaks at 773 and 780 cm−1 overlap; another peak is centered at 875 cm−1 instead of either 870 (α) or 877 cm−1 (β), and the peak at 949 cm−1 exhibits a weak shoulder at 957 cm−1 (β). On the other hand, the β features at 1100 and 1174 cm−1 cannot be identified. Taking into account, the FT-IR features of the vacuum deposited thin films, the position of the α phase and the appearance of the α(C–H) peak at 726 cm−1. However, the presence of bigger α crystallites cannot be ruled out, since the α(C–H) peak at 726 cm−1 can also arise from the overlapping of two peaks centered at 730 and 722 cm−1.27
N–C at bridge sites are observed at 1166 and 1287 (and 1334) cm−1,24 respectively. The spectra show the characteristic IR bands of CuPc (such as those at 722, 750, 900, 1080 and 1330 cm−1).25,26Fig. 6 shows that peaks of a C–H (CH3– and –CH2–) stretching vibrations are at 2850 and 2917 cm−1. It is well-known that the CuPcα and β polymorphs are characterized by some selected IR peaks related to the short-range neighbor interactions. Here, the two peaks at 773 and 780 cm−1 overlap; another peak is centered at 875 cm−1 instead of either 870 (α) or 877 cm−1 (β), and the peak at 949 cm−1 exhibits a weak shoulder at 957 cm−1 (β). On the other hand, the β features at 1100 and 1174 cm−1 cannot be identified. Taking into account, the FT-IR features of the vacuum deposited thin films, the position of the α phase and the appearance of the α(C–H) peak at 726 cm−1. However, the presence of bigger α crystallites cannot be ruled out, since the α(C–H) peak at 726 cm−1 can also arise from the overlapping of two peaks centered at 730 and 722 cm−1.27
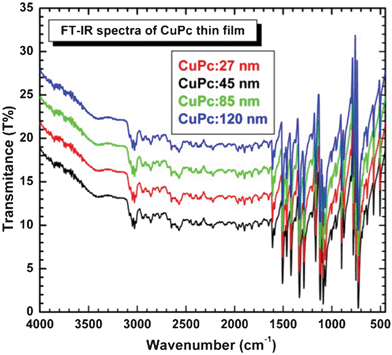 | ||
| Fig. 6 FT-IR spectra of the all CuPc samples. | ||
According to Sidorov and Kotlyar,28 the peculiar IR features of CuPcα and β polymorphs are (i) the out-of-plane hydrogen bending mode (γ(C–H)) peak at 722 (α) and 730 cm−1 (β); (ii) the peak at 770 cm−1 (α) and at 780 cm−1 (β), which has been ascribed to a vibrational mode of the central part of the CuPc cycle;29 (iii) the unresolved peaks at 864 and 870 cm−1 and the peak at 940 cm−1 (α) against the peaks at 877 and 957 cm−1 (β); and (iv) a peak at 1100 and a shoulder at 1174 cm−1, which are characteristic of the β polymorph. The main differences (Fig. 6) are that the γ(C–H) peak is centered at 725 instead of 722 cm−1 and only one peak appears at 773 cm−1; moreover, the α peak at 864 cm−1 disappears. Considering that optical analysis of this sample points out the presence of only α phase, the findings of FT-IR analysis are partially unexpected and some doubts about the correlation between the position of the γ(C–H) peak and the crystalline structure arise.
Fig. 7 shows SEM micrographs of CuPc thin films deposited at different film thicknesses. The SEM micrographs reveal uniform and smooth featureless surfaces with no clear crystal grain structure. Fig. 8 shows its wettability properties. It is clear that all films show hydrophilic nature. The measured contact angle is ∼55°.
 | ||
| Fig. 7 SEM micrographs of different film thicknesses. | ||
 | ||
| Fig. 8 Contact angle as a function of film thickness. | ||
The phthalocyanine molecules in thin films are usually stacked, forming columns with the ring tilted in relation to the column vertical axis. The most common polymorphic forms are the metastable α and the stable β. The interplanar distance for both forms is coincident (3.4 Å). The differences are in the angle of the molecule in relation to the column vertical axis being 26.5° for the α-form and 250° for the β-form and in the lattice parameters being a = 23.9 and b = 3.8 Å for the α-form and a = 19.4 and b = 4.79 Å for the β-form.
Fig. 9 presents the grazing angle X-ray diffractograms for the CuPc thin films onto a glass substrate deposited at room temperature. The standard diffraction data (JCPDS:00-037-1846) are represented by vertical lines. The X-ray measurements were also taken for the 27, 45 and 85 nm CuPc thin films; however, diffractograms were not acquired due to the low thickness except small hump for 120 nm CuPc film.
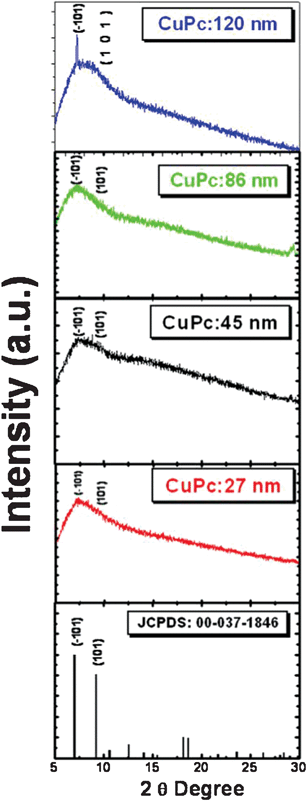 | ||
| Fig. 9 Small angle XRD of CuPc thin films. | ||
4. Conclusions
In this paper, the optical properties of copper phthalocyanine (CuPc) thin layers have been investigated using various spectroscopic methods. The absorption spectrum in the visible region consists of two distinct bands (i.e. Q-band and B-Band) of copper phthalocyanine (CuPc) thin films deposited at room temperature using vacuum deposition. The deposited CuPc thin films were further characterized by spectrophotometry, reflectometry, FT-IR, UV-Visetc. The films present high optical absorption coefficients, higher than 5 × 10⁻⁵ cm−1, suggesting possible use in flexible organic solar cell applications. An exponential decrease in the optical absorption, at energy values between 1.7 and 1.5 eV, indicates the presence of band tails, similar to the case of microcrystalline inorganic semiconductors.Acknowledgements
One of the authors, SSM, wishes to acknowledge the DAE-BRNS Mumbai for financial support through DAE-BRNS project no.2008/37/8/BRNS/1489 during 2008-2012.References
- J. F. Van Der Pol, E. Neeleman, J. W. Zwikker, R. J. M. Nolte, W. Drenth, J. Aerts, R. Visser and S. J. Picken, Liq. Cryst., 1989, 6, 577 CrossRef CAS.
- S. Radhakrishnan and S. D. Deshpande, Sensors, 2002, 2, 185 CrossRef CAS.
- T. Schwieger, H. Peisert, M. S. Golden, M. Knupfer and J. Fink, Phys. Rev. B: Condens. Matter, 2002, 66, 155207 CrossRef.
- Y. G. Park, H. Y. Lee, H. Tanaka, H. Tabata and T. Kawai, Appl. Phys. Lett., 2002, 81, 1318 CrossRef CAS.
- A. S. Riad, Phys. B, 1999, 270, 148 CrossRef CAS.
- M. E. Osugi, P. A. Carneiro and M. V. B. Zanoni, J. Braz. Chem. Soc., 2003, 14, 660 CrossRef CAS.
- S. Ambily and C. S. Menon, Solid State Commun., 1995, 94, 485 CrossRef CAS.
- K. Katrin, A. Nihal, C. Tracy, B. David and M. Hasan, Cancer Res., 2000, 60, 5984 Search PubMed.
- N. Padmaa, A. Joshi, A. Singh, S. K. Deshpande, D. K. Aswal, S. K. Gupta and J. V. Yakhmi, Sens. Actuators, B, 2009, 143, 246 CrossRef.
- J. Y. Kim, K. Lee, N. E. Coates, D. Moses, T. Q. Nguyen, M. Dante and A. J. Heeger, Science, 2007, 317, 222 CrossRef CAS.
- A. Braun and J. Tcherniac, Ber. Dtsch. Chem. Ges., 1907, 40, 2709 CrossRef CAS.
- K. Y. Law, Chem. Rev., 1993, 93, 449 CrossRef CAS.
- O. Berger, W. J. Fischer, B. Adolphi, S. Tierbach, V. Melev and J. Schreiber, J. Mater. Sci.: Mater. Electron., 2000, 11, 331 CrossRef CAS.
- A. Ritz and H. Lüth, Appl. Phys. A: Solids Surf., 1983, 31, 75 CrossRef.
- L. Edwards, M. Gouterman and X. V. Porphyrins, J. Mol. Spectrosc., 1970, 33, 292 CrossRef CAS.
- E. Jungyoon, S. Kim, E. Lim, K. Lee, D. Cha and B. Friedman, Appl. Surf. Sci., 2003, 205, 274 CrossRef.
- B. H. Schechtman and W. E. Spicer, J. Mol. Spectrosc., 1970, 33, 28 CrossRef CAS.
- S. Karan and B. Mallik, Solid State Commun., 2007, 143, 289 CrossRef CAS.
- M. M. El-Nahass, F. S. Bahabri and R. Al-Harbi, Egypt. J. Solids, 2001, 24, 11 Search PubMed.
- S. Varghese, M. Iype, E. J. Mathew and C. S. Menon, Mater. Lett., 2002, 56, 1078 CrossRef CAS.
- M. Wojdyła, B. Derkowska, M. Rebarz, A. Bratkowski and W. Bała, J. Opt. A: Pure Appl. Opt., 2005, 7, 463 CrossRef.
- A. V. Ganzha, R. V. Kus'menko, W. Kircher, J. Schreiber and S. Hildebrandt, Semiconductors, 1998, 32, 245 CrossRef.
- M. Knupfer, T. Schwieger, H. Piersert and J. Fink, Phys. Rev. B: Condens. Matter Mater. Phys., 2004, 69, 165210 CrossRef.
- J. S. Jung, J. W. Lee, K. Kim, M. Y. Cho, S. G. Jo and J. Joo, Chem. Mater., 2010, 22, 2219 CrossRef CAS.
- L. Goris, K. Haenen, M. Nesládek, A. Poruba, M. Vanecek, P. Wagner, L. Lutsen, J. V. Manca, D. Vanderzande and L. De Schepper, Proc. SPIE 5464, 2004, 372 Search PubMed.
- M. Szybowicz, T. Runka, M. Drozdowski, W. Bala, A. Grodzicki, P. Piszczek and A. Bratkowski, J. Mol. Struct., 2004, 704, 107 CrossRef CAS.
- G. Maggioni, S. Carturan, A. Quaranta, A. Patelli and G. Della Mea, Chem. Mater., 2005, 17, 1895 CrossRef CAS.
- B. E. Williamson, T. C. VanCott, M. E. Boyle, G. C.Misener, M. J. Stillman and P. N. Schatz, J. Am. Chem. Soc., 1992, 114, 2412 CrossRef CAS.
- M. P. Sammes, J. Chem. Soc., Perkin Trans., 1972, 2, 160 RSC.
| This journal is © The Royal Society of Chemistry 2012 |
