DOI:
10.1039/C2RA00632D
(Paper)
RSC Adv., 2012,
2, 2358-2368
A thermodynamic analysis of methanation reactions of carbon oxides for the production of synthetic natural gas
Received
24th August 2011
, Accepted 7th December 2011
First published on 30th January 2012
Abstract
Synthetic natural gas (SNG) can be obtained via methanation of synthesis gas (syngas). Many thermodynamic reaction details involved in this process are not yet fully understood. In this paper, a comprehensive thermodynamic analysis of reactions occurring in the methanation of carbon oxides (CO and CO2) is conducted using the Gibbs free energy minimization method. The equilibrium constants of eight reactions involved in the methanation reactions were calculated at different temperatures. The effects of temperature, pressure, ratio of H2/CO (and H2/CO2), and the addition of other compounds (H2O, O2, CH4, and C2H4) in the feed gas (syngas) on the conversion of CO and CO2, CH4 selectivity and yield, as well as carbon deposition, were carefully investigated. In addition, experimental data obtained on commercial Ni-based catalysts for CO methanation and three cases adopted from the literature were compared with the thermodynamic calculations. It is found that low temperature, high pressure, and a large H2/CO (and H2/CO2) ratio are favourable for the methanation reactions. Adding steam into the feed gas could alleviate the carbon deposition to a large extent. Trace amounts of O2 in syngas is unfavourable for SNG generation although it can lower carbon deposition. Additional CH4 in the feed gas almost has no influence on the CO conversion and CH4 yield, but it leads to the increase of carbon formed. Introduction of a small amount of C2H4, a representative of hydrocarbons in syngas, results in low CH4 yield and serious carbon deposition although it does not affect CO conversion. CO is relatively easy to hydrogenated compared to CO2 at the same reaction conditions. The comparison of thermodynamic calculations with experimental results demonstrated that the Gibbs free energy minimization method is significantly effective for understanding the reactions occurring in methanation and helpful for the development of catalysts and processes for the production of SNG.
1. Introduction
Recently, because of the increasing demand for natural gas and the reduction of greenhouse gases,1,2 interests have focused on the production of synthetic natural gas (SNG), which is suggested as an important future energy carrier. The conventional route for SNG production is based on the gasification of coal or biomass to synthetic gas (syngas). After gas cleaning and conditioning, the syngas containing H2, CO, CO2, H2O, CH4, and hydrocarbons3,4 can be converted to SNG by catalytic hydrogenation of carbon oxides (CO and/or CO2), otherwise known as methanation. At the moment, there are at least 15 coal-to-SNG plants proposed in the U.S., which are in different stages of development,5 and more than 20 coal-to-SNG plants are in construction and proposed in China because of China's abundant coal and poor natural gas. On the other hand, in the fuel cell and ammonia synthesis industry, methanation can also be used for the removal of trace CO from H2-rich stream to prevent catalyst poisoning.6,7 The catalysts and processes for methanation have been intensively explored and summarized in the reviews.1,8–11
Experimental results showed that the methanation reactions of carbon oxides were sensitive to the many factors such as temperature, pressure, composition of reactants (syngas).2,12,13 Simultaneous methanation of CO and CO2 is frequently encountered in a coexistent system14,15 and there is a competitive reaction between CO and CO2 methanation.6,16 As we know, the syngas obtained through gasification of coal and biomass inevitably includes high hydrocarbons such as C2H6, C2H4, and C2H2, and methanation of syngas involves many side-reactions that could result in complex by-products, which bring about a negative effect on the methanation process. The carbon deposition always occurs on the surface of catalysts during methanation,17 resulting in the quick deactivation of catalysts, and this is one of the most serious problems in industry. It is reported that adding steam to the reactants could suppress carbon deposition.1 In the methanation industry, the recycling of product gas containing water and CH4 is essential in the adiabatic fixed-bed methanation process in order to cut down reaction heat. For an example, in TREMP™ technology developed by Haldor Topsøe (Denmark), product gas recycle is used to control the temperature in the first methanation reactor with a feed ratio of (H2–CO2)/(CO + CO2) ≈ 3.18 Therefore, methanation is a very complicated process for the production of SNG. Although several methanation processes have been developed based on coal and biomass including the Lurgi process,19 TREMP™ technology,18 Davy process,20 and HICOM process,21 fewer studies have been reported on the thermodynamic analysis, which is very helpful in predicting and understanding the methanation process.
Thermodynamics is useful in the evaluation of processes occurring in such a complex reaction system. Thermodynamic equilibrium calculations of complex chemical systems based on the Gibbs free energy minimization can give answers to numerous questions, including the type of thermodynamically stable reaction products produced, together with their selectivity and yield, whether a chemical reaction proceeds endothermically or exothermically, the impact of reaction parameters like temperature, pressure, or reactant ratios, and whether observed reaction temperatures are thermodynamically determined. By comparing the calculations with experimental results, the identification of kinetic hindrances, i.e. thermodynamically allowed but somehow suppressed chemical reactions, should be helpful in understanding the methanation process. It is noted that some thermodynamic analysis of methanation reactions has been done recently. Greyson and co-workers calculated the thermodynamics equilibrium compositions for CO methanation system only for three reactions (CO + 3H2 ↔ CH4 + H2O, CO + H2O ↔ CO2 + H2, 2CO ↔ C + CO2).22 Anderson and co-workers studied the thermodynamics of the hydrogenation of carbon oxides for the production of hydrocarbons and oxygenated organic molecules and found that it involves methane production slightly.23,24 Beuls25 and Ocampo26 conducted a thermodynamic calculation of CO2 methanation based on the developed catalyst under given reaction conditions. However, thermodynamic analysis as above is less comprehensive and it would be of interest to have a deeper understanding of the on-going reactions in the absence of any hindrances caused by kinetics, transport phenomena, or hydrodynamics.
Herein, we systematically conducted a thermodynamic analysis of CO and/or CO2 methanation by using the total Gibbs free energy minimization method. The effects of various initial reactant compositions, temperature, and pressure on the conversion of carbon oxides, CH4 selectivity and yield, and carbon deposition were investigated. The effects of compounds such as H2O, O2, CH4, and C2H4 in syngas were also considered. We also compared the thermodynamic calculation with the experimental results obtained over two commercial methanation catalysts. In addition, three cases with different feed gas compositions adapted from the literature were also calculated to verify our simulation. To our knowledge, no such systematic thermodynamic analysis has been made for CO and/or CO2 methanation reactions based on Gibbs free energy minimization method yet. Our results would give a useful guidance for the development of the methanation process.
2. Methodology
2.1. Thermodynamic analysis
As we know, equilibrium composition of a reaction system can be calculated using either equilibrium constants or the Gibbs free energy minimization method. Since the former approach uses individual equilibrium constants of reactions exactly involved in methanation and it is difficult to obtain the exact knowledge of these reactions, the former may be not ideal for the methanation process. The latter is based on the principle that the total Gibbs energy of the system has its minimum value at chemical equilibrium, in which, individual equilibrium constants, especially for multiple reactions in one system, are not considered. If all the species in a reaction system including reactants and products are given, the distribution of the products under a minimum free energy can be established by using a general mathematical technique without knowing the chemistry of the reactions. This method also can be used for condensed species,27 non-reacting species as well as reacting species.28 Therefore, the Gibbs free energy minimization method is widely used to perform thermodynamic analysis29–31 and should be more suitable for the present work because the methanation process involves complex species and reactions. Here, the software CHEMCAD was used for carrying out the calculation, and meanwhile, the Soave–Redlich–Kwong method was employed as the equation of state to determine fugacity in the calculation. The total Gibbs free energy GT of the system is given as:| | 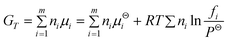 | (1) |
Introducing Lagrange multipliers for species i, subject to mass balance constraints:
| | 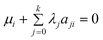 | (2) |
Where λ is the Lagrange multiplier, aji is the number of atoms of element j in species i. Therefore combining eqn (1) and (2) yields:
| | 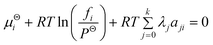 | (3) |
For the condensed species:
| | 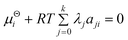 | (4) |
In the CHEMCAD software, as a result of the manipulations involved, a system of linear simultaneous equations is obtained as many unknowns. When solved, the system yields a new composition that represents a new approximation of the composition which gives minimum free energy. The procedure is repeated until the calculated and prior compositions are identical. At this point, the free energy of the system is at a minimum.
As a theoretical study, catalyst, reaction kinetics, and the transport process are not considered here. However, the results from the thermodynamic analysis could be used as a benchmark to compare with the experiment results. Here, possible reactions involved in the methanation of carbon oxides are given in Table 1 for the calculation.8,28 Our calculation was conducted based on the gaseous compounds containing H2, O2, N2, CO, CO2, CH4, H2O, C2H4 (as a typical representative of high hydrocarbons), and solid carbon. Other oxygen-containing compounds such as methanol, methanoic acid, acetic acid and other high hydrocarbons are not considered here because of their trace amounts in the equilibrium mixture gas. Carbon (C), hydrogen (H) and oxygen (O) atoms are used for the elemental mass balance. CO and CO2 conversion, CH4 selectivity and yield, and carbon yield are defined in Table 2. It should be noted that the molar flow rate of solid carbon used in the definition can be obtained through calculation by the Gibbs free energy minimization method in accordance with other gaseous compounds.27
| Reaction no. |
Reaction formula |
ΔH298 K (kJ mol−1) |
Reaction type |
| R1 |
CO + 3H2 ↔ CH4 + H2O |
−206.1 |
CO methanation |
| R2 |
CO2 + 4H2 ↔ CH4 + 2H2O |
−165.0 |
CO2 methanation |
| R3 |
2CO + 2H2 ↔ CH4 + CO2 |
−247.3 |
inversed methane CO2 reforming |
| R4 |
2CO ↔ C + CO2 |
−172.4 |
Boudouard reaction |
| R5 |
CO + H2O ↔ CO2 + H2 |
−41.2 |
water-gas shift |
| R6 |
CH4 ↔ 2H2 + C |
74.8 |
methane cracking |
| R7 |
CO + H2 ↔ C + H2O |
−131.3 |
carbon monoxide reduction |
| R8 |
CO2 + 2H2 ↔ C + 2H2O |
−90.1 |
carbon dioxide reduction |
| R9 |
nCO + (2n+1)H2 ↔ CnH2n+2 + nH2O |
— |
— |
| R10 |
nCO + 2nH2 ↔ CnH2n + nH2O |
— |
— |
Table 2 Definition of CO and CO2 conversion, CH4 selectivity and yield, and carbon yielda
| Entry |
Definition |
|
Herein, i indicate all species that contain carbon (CO, CO2, CH4, and C2H4) at inlet. Ni is the number of carbon atom of species i.
|
| CO conversion |

|
| CO2 conversion |
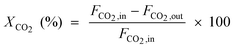
|
| CH4 selectivity (CO methanation system) |

|
| CH4 selectivity (CO2 methanation system) |

|
| CH4 yield |
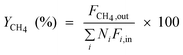
|
| Carbon yield |
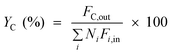
|
2.2. Experimental procedure
For a comparison with the thermodynamic calculation, CO methanation was carried out on two commercial nickel-based catalysts marked as C1 (N112, NiO 67 wt%, JGC Catalyst and Chemicals Ltd., Japan) and C2 (HT-1, NiO 57 wt%, LiaoNing HaiTai SCI-TECH Development CO., LTD, China). Two fixed bed reactors made of a quartz tube (at 1 atm) and stainless steel (at high pressures) both with a diameter of 10 mm were used in the measurement within the temperature range 200–600 °C. Firstly, 200 mg of each catalyst (20–40 mesh) was mixed with 1.0 g quartz sand (20–40 mesh) and placed in the reactor. The thermocouple was directly inserted into the catalyst bed to measure the actual reaction temperature. Prior to the reaction, catalysts were reduced by H2 with a flow rate of 50 mL min−1 at 450 °C for 2 h. Feed gas with a molar ratio of H2/CO/N2 = x/1/1 (x = 1, 3, and 5) controlled with the mass flowmeters was introduced into the reactor at a weight hourly space velocity (WHSV) of 30![[thin space (1/6-em)]](https://www.rsc.org/images/entities/char_2009.gif) 000 mL h−1 g−1. The reaction temperature was controlled by the heat controller with a heating rate of 5 °C min−1. After one hour of steady-state operation at a set temperature, the outlet product gas stream was cooled down and analysed online using a MicroGC (3000A, Agilent).
000 mL h−1 g−1. The reaction temperature was controlled by the heat controller with a heating rate of 5 °C min−1. After one hour of steady-state operation at a set temperature, the outlet product gas stream was cooled down and analysed online using a MicroGC (3000A, Agilent).
3. Results and discussion
3.1. The equilibrium constants of reactions involved in methanation
Fig. 1 shows the equilibrium constants (K) of the first eight possible reactions (see Table 1) occurring in the methanation process as a function of temperature. K is calculated below by the van't Hoff equation:| | 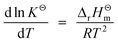 | (5) |
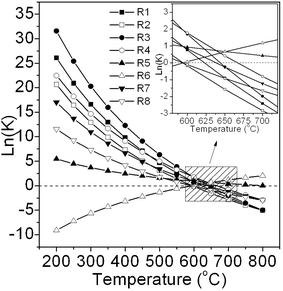 |
| | Fig. 1 The calculated K values of the reactions involved in methanation. | |
It can be seen that all exothermic reactions are suppressed as temperature is increased except for the endothermic methane cracking reaction (R6). R1, R2, R3, R4, and R7 play a key role in the methanation reaction system due to their high equilibrium constants in the temperature range 200–500 °C. Consumption of CO via R1, R3, R4, and R5 reactions can bring about nearly complete conversion of CO because of the high K values of these reactions at low temperature. In contrast, CO2 is difficult to completely convert because the reactions R3, R4, and R5 produce it. In addition, it can be deduced that carbon deposition mainly comes from the Boudouard reaction (R4) because its K is much larger than R6, R7, and R8. Lastly, all these reactions may simultaneously happen in the methanation process leading to a significant effect on the product composition.
3.2. CO methanation
3.2.1. CO methanation at 1 atm.
For primary screening of methanation catalysts in the laboratory, CO methanation is always conducted at atmospheric pressure. Fig. 2 shows the typical product fraction at equilibrium calculated via the Gibbs free energy minimization method at 1 atm. The feed gas consists of H2 and CO with a stoichiometric H2/CO ratio of 3. It can be seen that the products mainly contain CH4 and H2O with lesser CO2 by-product at a low temperature (200–300 °C) without deposition of carbon, which is in accordance with the early reports.22–24 With an increase in temperature, the mole fraction of CH4 decreases, whereas the unreacted CO, H2, CO2, and deposited carbon increase simultaneously. The carbon deposition occurs when the temperature is higher than 450 °C. This is because the Boudouard reaction (R4) occurs easier than CO methanation (R1) above this temperature due to its higher equilibrium constant as shown in Fig. 1. In short, the reaction temperature for CO methanation should be controlled at a low temperature to avoid carbon deposition for the primary screening of methanation catalysts although it is not recommended for industry to adopt such operation parameters.
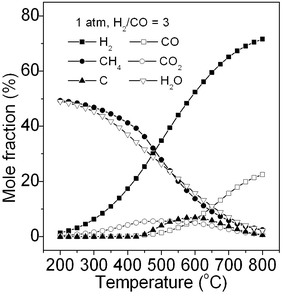 |
| | Fig. 2 Product composition of CO methanation at equilibrium. | |
3.2.2. Effects of pressure and temperature.
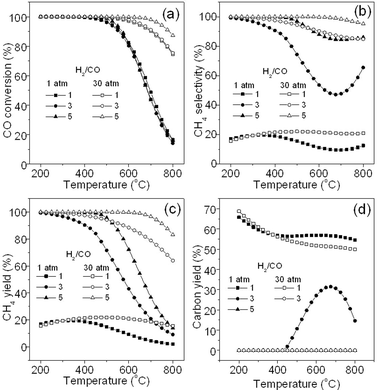
Fig. 3 shows the effects of pressure and temperature on CO methanation performance (H2/CO = 3). It can be seen that in Fig. 3a, a high pressure leads to a higher CO conversion at the same reaction temperature because CO methanation is a volume reducing reaction. On the other hand, a much higher pressure (100 atm) does not result in a much higher CO conversion below 700 °C compared with that at 30 atm. As we know, high operation pressure and temperature in chemical industry are not economically recommended. At the same reaction pressure, a lower temperature results in higher CO conversion because of the exothermic reaction of CO methanation (R1). However, this requires sufficiently high active catalysts at the lower temperature, which is the challenge for developing catalysts.
 |
| | Fig. 3 Effects of pressure and temperature on CO conversion (a), CH4 selectivity (b), CH4 yield (c), and carbon yield (d). | |
Fig. 3b shows the change in CH4 selectivity with temperature at different pressures. It is seen that high CH4 selectivity can be obtained at a pressure more than 1 atm and at a relatively low temperature. This is because CO is partially converted to by-products such as CO2 and solid carbon via a reversed methane CO2 reforming reaction (R3) and Boudouard reaction (R4) respectively at low pressure and high temperature (Fig. 1). Thus, CH4 selectivity can be improved markedly by increasing pressure from 1 to 30 atm, and further increasing pressure (100 atm) would not lead to conspicuous improvement. This may be the reason why the operation pressure less than 100 atm (normally 20–30 atm) was selected for TREMP™ technology.18Fig. 3c shows the variation in CH4 yield with the temperature at different pressures. The curves are obtained by integrating data in Fig. 3a with that in Fig. 3b. A CH4 yield near 100% was observed at temperatures lower than 250 °C at 1 atm or higher pressures. Thus, high pressure and low temperature will promote CO methanation.
Fig. 3d reveals the variation in deposited carbon yield with the temperature at different pressures. It is seen that at 1 atm, carbon is generated in the temperature range 400–800 °C and reaches a maximum (22 mol% of yield) at about 600 °C. Further increasing pressure to 10 atm, less carbon amount is found in the temperature range 650–800 °C and the maximum (1.8 mol% of yield) is achieved at around 725 °C. When pressure is more than 15 atm, deposited carbon is not observed. Thus, the high pressure could substantially alleviate the carbon deposition. It is known that carbon deposition originates from multiple reactions, including the Boudouard reaction (R4), methane cracking (R6), CO reduction (R7), and CO2 reduction (R8) (see Table 1). Since K of R4 is higher than that of R1 in the temperature range of 450–600 °C at 1 atm (see Fig. 1), R4 will take place more easily than R1 leading to carbon deposition that is mainly from CO disproportionation. However, when the reaction temperature exceeds about 600 °C, at which the maximum amount of carbon yield is obtained, carbon deposition may occur due to R6 (see Fig. 1). Considering the relatively low concentration of CH4 at above 600 °C, R6 may bring about less carbon deposition at this stage. However, the reversed reactions of R7 and R8 may become dominant and consume much of the deposited carbon beyond 600 °C. As a result, total deposited carbon decreases when the temperature exceeds about 600 °C. Therefore, the carbon yield curves in Fig. 3d shows firstly an increase and then a decrease in value and it eventually decreases to a negligible value at around 800 °C. Moreover, because a higher pressure favours R1 and R6 more than it does for R4, R7 and R8, the carbon yield gradually becomes lesser and the carbon deposition shifts to a higher temperature range with an increase of pressure. Finally there is no carbon deposition found at more than 15 atm. Thus, in CO methanation, low temperature and high pressure values are highly recommended.
3.2.3. Effect of H2/CO ratio.
Since syngas has a variable ratio of H2/CO, according to the stoichiometric ratio of R1, H2/CO is required to be at around 3, which is normally controlled through water-gas shift reaction (R5).1 However, it is very hard to tune this value to be exactly 3 in the methanation industry. Thus, it is necessary to know the influence of this ratio on the methanation process. Fig. 4a exhibits the effect of different H2/CO ratios at different pressures on CO conversion. It can be seen that the CO conversion is not obviously changed at different H2/CO ratios (1, 3, and 5). At 30 atm, a higher ratio seems to be beneficial towards CO conversion. Fig. 4b reveals the CH4 selectivity at different H2/CO ratios. It can be seen that a higher H2/CO ratio leads to a higher CH4 selectivity at both 1 and 30 atm. Reaction at high pressure also results in high CH4 selectivity at different ratios, especially at high reaction temperatures. When the H2/CO ratio is lowered to 1 and below, CH4 selectivity reaches only to about 20% either at 1atm or 30 atm, indicating that CO is mostly converted to non-SNG products through side reactions (see Table 1) considering the high CO conversion (see Fig. 4a). Fig. 4c shows the CH4 yield at different H2/CO ratios and different pressures. It is found that a large ratio, high pressure, and low temperature are helpful for CH4 yield. Fig. 4d shows the yield of carbon deposited at different H2/CO ratios. We can find that the low ratio of 1 leads to high carbon yield (50–70 mol%) at both 1 and 30 atm. In contrast, the deposited carbon is not observed at the ratios of 5 (1 atm) and 3 (30 atm) because CO is mostly converted to CH4via R1 and CO2via R3, respectively. It is known that R3 and R4 can easily take place at a H2/CO ratio smaller than 3. As a result, the improvement in CH4 selectivity is tiny even at a pressure of 30 atm as compared to that at 1 atm. Thus, to obtain a relatively high CH4 yield, H2/CO ratio should not be lower than 3, which is consistent with that of TREMP™ technology.18
 |
| | Fig. 4 Effect of H2/CO ratio on CO conversion (a), CH4 selectivity (b), CH4 yield (c), and carbon yield (d). | |
3.2.4. Effect of H2O.
Industrial experience showed that adding water steam into reactants could avoid carbon formation to a large extent on the methanation catalysts.1Fig. 5 shows the effect of adding steam into the feed gas at 1 and 30 atm. Fig. 5a indicates that additional steam with different ratios leads to a slight decrease in CO conversion at the high temperature (1 atm and 30 atm) since steam is one of the reaction products inhibiting CO methanation (R1) to some extent according to Le Chatelier's principle.
 |
| | Fig. 5 Effect of water steam added into the feed gas on CO conversion (a), CH4 selectivity (b), CH4 yield (c), and carbon yield (d). | |
Similarly, Fig. 5b shows that the introduction of steam results in a small difference in CH4 selectivity, in which, small decreases with an increase of steam ratio can be found at 30 atm and at a temperature more than 500 °C. Accordingly, Fig. 5c shows the effect of adding steam on the CH4 yield. The trend is similar to that in Fig. 5a and 5b. Fig. 5d reveals the effect of steam on the carbon yield at 1 atm. It can be seen that additional steam remarkably reduces the carbon deposition at 1 atm especially at high temperatures although the temperature at which maximum carbon yield is obtained is not changed. When steam ratio reaches to 0.5, there is no carbon formed. This is because adding water would inhibit R7 and R8 significantly. Therefore, adding a small amount of water into the CO methanation system could reduce carbon deposition. This is in agreement with the HICOM21 and RMP32 methanation processes, in which excess steam is required for the first methanation reactor in order to avoid carbon deposition. In addition, we did not do the calculation at 30 atm because at this pressure, there is no carbon deposition even without adding steam regarding above Fig. 3d and 4d.
3.2.5. Effect of O2.
It is known that trace amount of O2 in the syngas is inevitable in the gasification process. At the present, there is no report on the effect of O2 on methanation. Fig. 6 depicts the effect of O2 introduced into the feed gas on CO methanation. Fig. 6a shows the O2 effect on CO conversion, from which, it can be seen that CO conversion decreases slightly with an O2 increase at both 1 and 30 atm, owing to the reactions of H2 and CO with O2, especially at high temperatures, respectively. Fig. 6b shows the effect of O2 on CH4 selectivity, suggesting that O2 could lead to the obvious decline of CH4 selectivity in the whole temperature range because CO is partially oxygenated to CO2. As a result, CH4 yield decreases with an O2 increase in reactants as shown in Fig. 6c. However, as shown in Fig. 6d, the introduction of O2 can lead to a large reduction of deposited carbon at 1 atm because of the reaction of O2 with carbon to form CO2, especially at the ratio of H2/CO/O2 = 3/1/0.5. Similarly, again at 30 atm, no carbon deposition occurs at high temperature. Therefore, considering the CH4 yield, it is necessary to completely remove the O2 in feed gas for the methanation process.
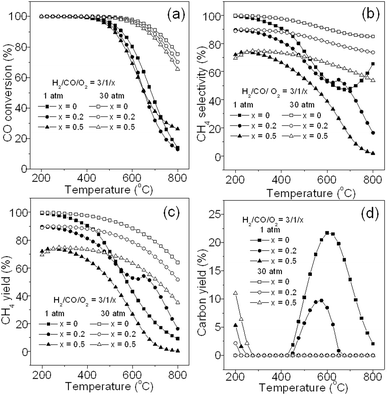 |
| | Fig. 6 Effect of O2 contained in the feed gas on CO conversion (a), CH4 selectivity (b), CH4 yield (c), and carbon yield (d). | |
3.2.6. Effect of CH4.
Syngas often contains a certain amount of CH4.1,3,4 On the other hand, recycling the methanation gas product containing CH4 and H2O is usually employed to dilute the feed gas to control the reaction temperature in the industrial methanation process such as the Lurgi process,33 TREMP™ technology,18 and HICOM process.21 Thus, it is necessary to understand the effect of CH4 on the methanation reaction as shown in Fig. 7. Fig. 7a, 7b, and 7c show the effect of CH4 when it is introduced into the feed gas on the CO conversion, CH4 selectivity, and CH4 yield, respectively. It can be seen that additional CH4 with different ratios does not lead to a large difference in conversion, selectivity and yield at both 1 and 30 atm. Accordingly, a high yield of CH4 still can be achieved at low temperature and high pressure even with high CH4 ratios (H2/CO/CH4 = 3/1/5) as shown in Fig. 7c. However, Fig. 7d shows that deposited carbon yield sharply increases with a high ratio of CH4 above 400 °C at both 1 and 30 atm mainly due to the methane cracking reaction (R6), which occurs at high temperature (Fig. 1). In brief, to get a high CH4 yield and a low carbon yield, as well as optimized the energy efficiency, a large recycling of the product gas is not suggested, and CH4 in the feed gas should be controlled at a low level. The recycle ratio of product gas would be controlled in an appropriate range, for example, 0.5–3.0 for the methanation process. This may explain why the TREMP™ technology is dedicated to decreasing the recycle ratio.18
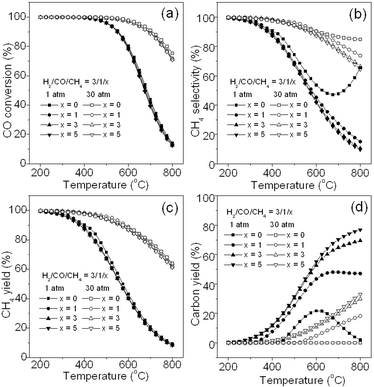 |
| | Fig. 7 Effect of CH4 introduced into the feed gas on CO conversion (a), CH4 selectivity (b), CH4 yield (c), and carbon yield (d). | |
3.2.7. Effect of trace C2H4.
It is also known that the presence of gaseous hydrocarbon compounds in syngas, such as C2H6, C2H4, and C2H2, drastically raises the risk for carbon deposition.1Fig. 8 shows the effect of C2H4 introduced into the feed gas on CO methanation at different ratios and pressures. Here, C2H4 represents a typical example of hydrocarbon compounds in syngas. It can be seen that in Fig. 8a CO conversion is almost not influenced by C2H4 because it has no effect on the reactions of R1, R3, and R4 which are not related to C2H4. However, CH4 selectivity in Fig. 8b and CH4 yield in Fig. 8c are substantially reduced with the increase of C2H4 at either 1 or 30 atm. This is because C2H4 will compete with CO to react with H2 and enable the Boudouard reaction (R4) to occur more easily. In addition, pyrolysis of C2H4 at high temperature to form carbon may have also accounted for the drop in CH4 selectivity and yield.28Fig. 8d shows the effect of C2H4 on carbon yield. It can be seen that the carbon deposition rapidly increases with the increase in C2H4 ratio, especially at 1 atm. Similarly, at 30 atm, the carbon yield shows the same trend although there is a large reduction in the total amount of carbon yield. Therefore, purification of hydrocarbon compounds in syngas is strictly required to diminish carbon formation on catalysts to ensure long continuous operation of the methanation process.
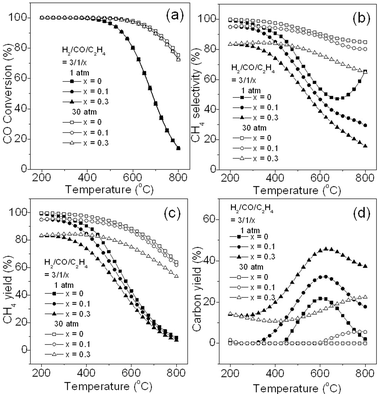 |
| | Fig. 8 Effect of C2H4 introduced into the feed gas on CO conversion (a), CH4 selectivity (b), CH4 yield (c), and carbon yield (d). | |
3.3. CO2 methanation
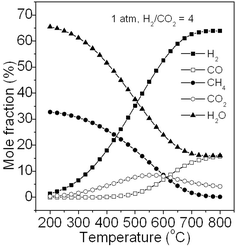
3.3.1. CO2 methanation at 1 atm.
CO2 methanation as a particularly promising technique for reducing CO2 emissions and producing energy carrier or chemical has been widely studied in recent years.34–36 In addition, syngas also contains a large amount of CO2. However, few studies were attempted on the thermodynamic analysis in CO2 methanation. Fig. 9 shows the typical product fraction of CO2 methanation at equilibrium calculated via the Gibbs free energy minimization method at 1 atm. The feed gas contains H2 and CO2 with a stoichiometric H2/CO2 molar ratio of 4. It can be seen that the products are mainly CH4 and H2O at a relative low temperature (200–250 °C). Elevating the temperature above 450 °C results in the increase in the CO by-product, due to reversed water gas shift reaction: CO2 + H2→H2O + CO, and meanwhile, unreacted CO2 and H2 also increase, along with a decrease in the CH4 product. Since CO2 methanation is also a strongly exothermic reaction, increasing temperature is unfavourable for this reaction. However, when the temperature exceeds about 550 °C, the mole fraction of CO2 reaches its maximum and then decreases because the reversed water gas shift reaction dominates. The calculation also reveals that no significant carbon deposition is generated under our condition. Thermodynamically, the CO2 methanation reaction may be assumed to take place via the following reactions proposed by Jung-Nam Park and co-workers:36
 |
| | Fig. 9 Product fraction of CO2 methanation at equilibrium. | |
CO2 + H2 + 3H2 ↔ H2O + CO + 3H2 = H2O + CO + 3H2 ↔ H2O + CH4 + H2O
Accordingly, CO2 methanation can be seen as a series of reactions involving firstly the reversed water-gas shift reaction followed by CO methanation in the presence of steam with H2/CO/H2O ratio of 3/1/1. As discussed in section 3.2.4, adding steam into CO methanation system can suppress carbon formation which may explain why no significant carbon deposition is found in CO2 methanation. Similarly, compared with CO methanation, CO2 methanation is also favourable in thermodynamics. In order to obtain a high CH4 yield at 1 atm, the reaction temperature should not exceed 300 °C. However, the eight-electron reduction of CO2 to CH4 by hydrogen is difficult to achieve because of significant kinetic barriers.37 Thus, a much more active catalyst is needed to hydrogenate CO2 to CH4 especially at the low temperature.
3.3.2. Effects of pressure and temperature.
Fig. 10 shows the effects of pressure and temperature on CO2 methanation. Fig. 10a shows the effect on CO2 conversion. It can be seen that the CO2 conversion decreases with increasing temperature and increases with the pressure, at temperatures below 600 °C, similar to the trend of CO methanation as shown in Fig. 3a. This is because CO2 methanation is also a volume reducing and exothermic reaction. When CO2 methanation takes place at 1 atm and beyond 600 °C, the CO2 conversion gradually increases, different from what is seen in CO methanation as shown in Fig. 3a. This is mainly because the reversed reaction of R5 dominates above 600 °C and consumes CO2. Fig. 10b shows the effect on CH4 selectivity. It is observed that the trend with variations in the pressure and temperature is similar to CO methanation (see Fig. 3b). It should be noted that our calculation result at 1atm is in accordance with Beuls's25 and Ocampo's26 simulations for CO2 methanation, and also in good agreement with the experimental results of Du and co-workers based on Ni/MCM-41 catalysts for CO2 methanation.38 Comparing Fig. 10a with Fig. 3a, we find that CO2 is more difficult than CO to be methanized at the same temperature and pressure although the CH4 selectivity below 500 °C in the CO2 methanation system is relatively higher than that in CO methanation. Fig. 10c shows effect of temperature and pressure on the CH4 yield. Low temperature and high pressure also promote CO2 methanation, which is similar to that predicted by the calculation for CO methanation (see Fig. 3c). Furthermore, it should be mentioned that no carbon generation is found under our simulation conditions (not shown here). This is because during the CO2 methanation, water is formed that can suppress the carbon deposition as mentioned above.
 |
| | Fig. 10 Effects of pressure and temperature on CO2 methanation: (a) CO2 conversion, (b) CH4 selectivity, and (c) CH4 yield. | |
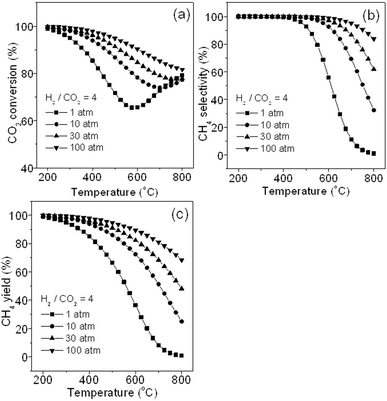
3.3.3. Effect of H2/CO2 ratio.
Fig. 11 describes the effect of different H2/CO2 ratios on CO2 methanation. It can be seen that CO2 conversion in Fig. 11a and CH4 selectivity in Fig. 11b are remarkably affected by H2/CO2 ratio. High H2/CO2 ratio generally leads to high CO2 conversion and CH4 selectivity at both 1 and 30 atm. When H2/CO2 is equal to 2, CO2 conversion of only about 50–70% can be obtained at either 1 atm or 30 atm, and maximum CH4 selectivity of 73% and 88% is achieved at 1 atm and 30 atm, respectively. Fig. 11c shows the effect on CH4 yield. When the H2/CO2 ratio is 2, CH4 yield is as low as about 40% at 1 atm and 45% at 30 atm, respectively, and CH4 yield can be enhanced markedly by increasing H2/CO2 ratio at the same conditions. Fig. 11d shows the carbon yield. When H2/CO2 ratio is 2, abundant carbon deposition (up to 50%) is found below 500 °C at both 1 and 30 atm. When H2/CO2 ratio is equal to or more than 4 (the curve at the ratio of 6 is not shown here), carbon deposition is not found. Thus, in order to obtain a high CH4 yield and avoid carbon deposition, H2/CO2 ratio should not be lower than 4 even at 30 atm. Conclusively, low temperature, high pressure, and proper H2/CO2 ratio is required for optimized CO2 methanation.
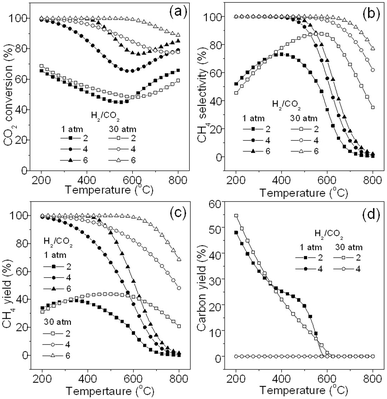 |
| | Fig. 11 Effect of different H2/CO2 ratios on CO2 methanation: (a) CO2 conversion, (b) CH4 selectivity, (c) CH4 yield, and (d) carbon yield. | |
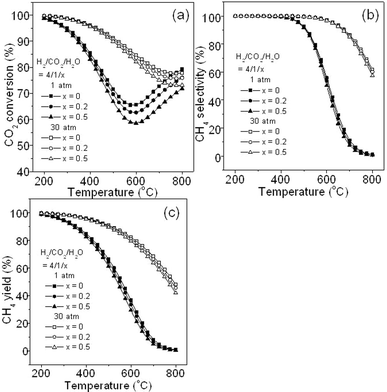
3.3.4. Effect of H2O.
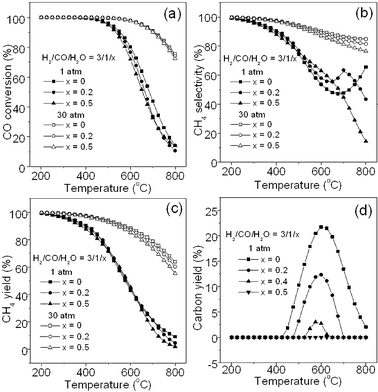
Fig. 12 gives the effect of adding steam into the feed gas (H2/CO2/H2O = 3/1/x, x = 0, 0.2, and 0.5, here x = 0 means that no additional H2O is added). It is seen that at 1 and 30 atm, the addition of steam leads to a little decrease in CO2 conversion (Fig. 12a), and no significant difference in CH4 selectivity (Fig. 12b) and CH4 yield (Fig. 12c). This is mainly because H2O is one of the products in CO2 methanation reaction and slightly inhibits the production of CH4 as discussed in section 3.2.4. In addition, no carbon deposition is found with additional steam introduced into CO2 methanation system (figure not shown).
 |
| | Fig. 12 Effect of additional steam in the feed gas on CO2 methanation: (a) CO2 conversion, (b) CH4 selectivity, and (c) CH4 yield. | |
3.4. Simultaneous methanation of CO and CO2
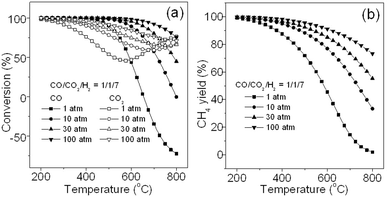
Since carbon oxides with both CO and CO2 always coexist in syngas, simultaneous methanation of carbon oxides would be often encountered. Thus, it is necessary to know their co-methanation situation. Fig. 13 presents the effects of pressure and temperature on the co-methanation of both carbon oxides. Here, in order to simplify the calculation, the feed gas with a CO/CO2/H2 ratio of 1/1/7 for reactions R1 and R2 is employed for thermodynamic analysis. Fig. 13a shows the effect of temperature and pressure on the conversion of carbon oxides, in which, it can be seen that low temperature and high pressure lead to high conversion of both CO and CO2, and the conversion curve profiles for CO and CO2 are similar to that of their respective methanation as shown in Fig. 3a and Fig. 10a. In addition, the CO conversion is much higher than that of CO2 in most situations, especially below 600 °C, indicating that CO is much easier to be hydrogenated than CO2 as discussed above. However, when the temperature increases further, the CO2 conversion increases, whereas the CO conversion drops sharply owing to the occurrence of the reversed water gas shift reaction: CO2 + H2→H2O + CO. As a result, CO even shows a negative conversion above 650 °C. Fig. 13b shows the effect on CH4 yield. It can be seen that a high CH4 yield can be achieved at low temperature and high pressure. Since it is difficult to determine the carbon oxide source of CH4 from either CO or CO2, the CH4 selectivity is not given here. Moreover, it should be noted that no carbon deposition is observed under the simulation conditions (not shown here), suggesting that the water generated from CO2 methanation may have inhibited the carbon formation not only in CO2 methanation as observed above but also in CO methanation. This is different from CO methanation alone.
 |
| | Fig. 13 Effects of pressure and temperature on co-methanation of carbon oxides: (a) conversion and (b) CH4 yield. | |
3.5. Comparison of thermodynamic calculation with the experimental results for CO methanation
For comparison with the thermodynamic calculations, CO methanation was carried out on two commercial Ni-based catalysts C1 (NiO 67 wt%) and C2 (NiO 57 wt%). Fig. 14 shows the comparison of the thermodynamic calculations (marked as cal) with the experimental results for CO methanation at different H2/CO/N2 ratios. It can be seen in Fig. 14a that CO conversion at different ratios is generally in accordance with the calculated ones except for the results at H2/CO/N2 ratio of 1/1/1, but this gap at low temperature is present possibly because catalysts C1 and C2 are not active enough at low temperature or are without adequate H2. CH4 selectivity is shown in Fig. 14b. CH4 selectivity exceeds the calculated value to some extent at the H2/CO/N2 ratio of 1/1/1. According to simulation results (Fig. 4d), when H2/CO/N2 ratio is 1/1/1, a majority of CO is converted to carbon. However, we can roughly deduce that carbon deposition is not so serious at these two commercial catalysts according to carbon element conservation during the experiment although we can not directly measure the amount of carbon deposition at each reaction temperature, which results in an increase of CH4 selectivity. From another point of view, we can know that reactions involving carbon deposition do not reach equilibrium under this reaction condition mainly because of catalyst, transport process or kinetics. Besides, the actual pressure in the reactor is normally larger than 1 atm due to the reactor system pressure, thus leading to the enhancement of CH4 selectivity as discussed above. In contrast, at H2/CO/N2 ratio of 5/1/1, CH4 selectivity can not reach equilibrium value, suggesting that these two catalysts should be used at a proper H2/CO ratio. CH4 yield in Fig. 14c is obtained by integrating data in Fig. 14a with that in Fig. 14b. These results suggest that the effect of H2/CO ratio predicted by our calculation generally agrees with that of our experimental results.
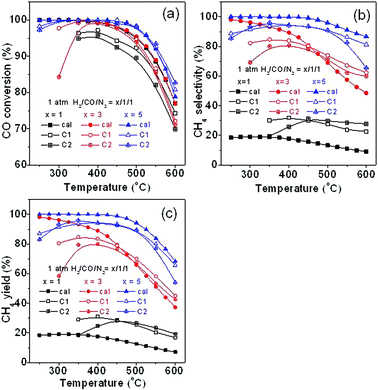 |
| | Fig. 14 Comparison of thermodynamic calculation with the experimental results for CO methanation with different H2/CO/N2 ratios: (a) CO conversion, (b) CH4 selectivity, and (c) CH4 yield. | |
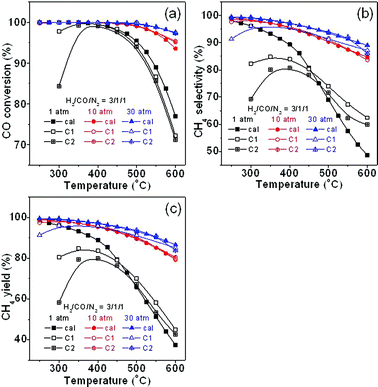
Fig. 15 shows the experimental results together with the calculated ones obtained using the H2/CO/N2 ratio of 3/1/1 at different pressures. It can be seen in Fig. 15a that below 350 °C, the CO conversion is much lower than that of the calculation possibly because the catalyst used here is not active enough, which is a big challenge for methanation at low temperatures. However, above 350 °C, the two catalysts show high activity for CO conversion, which is highly consistent with the calculation values at different pressures. Fig. 15b gives the CH4 selectivity on the two catalysts. The experimental selectivity below 450 °C at 1 atm is reasonably smaller than that of the calculation, but above 450 °C, the selectivity is much higher. This may be because the actual pressure in the reactor may have inevitably increased at 1 atm due to the inherent system pressure drop as mentioned above. In addition, the temperature gradient distribution also causes an error in the catalyst bed temperature recorded, resulting in a further gap between experimentation and calculation. Moreover, other factors such as the reactants transport process may also have affected CH4 selectivity. In contrast, at 10 atm and 30 atm, the selectivity obtained on the commercial catalysts is in a good agreement with calculated ones. Fig. 15c shows the comparison of the CH4 yields. It can be seen that experimental results are generally in accordance with the calculated ones at different pressures. The result also indicates that the calculation here, which has considered the effects of temperature and pressure, agrees well with the experimental data.
 |
| | Fig. 15 Comparison of experimental results with calculated ones at different pressures: (a) CO conversion, (b) CH4 selectivity, and (c) CH4 yield. | |
3.6. Case study
For further verification of the effectiveness of our calculation, three cases adopted from the literature were studied here. Table 3 compiles the calculated results together with the experiment data reported. The feed gas in these cases contains H2, CO, CO2, CH4, H2O, and N2(Ar) with a typical composition. Case 1 is selected from reactor 1 of the ADAM I process, which was developed by British Gas Corporation in March 1979,39 in which the water–gas shift and methanation reactions are combined. Case 2 and Case 3 come from the reactors 1 and 2 of a previous experimental work,40 respectively. It should be mentioned that the volume fraction in the references is converted to mole fraction for a fair comparison. It is clearly seen that the product compositions calculated (marked as Outcal) surprisingly approach closely to those reported, for example, the outlet CH4 fraction in case 1 is 37.44% for reported and 38.02% for calculated, and in case 3 it is 10.20% for reported and 10.48% for calculated, suggesting that the Gibbs free energy minimization method is an ideal tool for thermodynamic analysis of the methanation process.
Table 3 Calculative results for syngas methanation together with the experiment data reported in the literature
| Entry |
Case 1 |
Case 2 |
Case 3 |
|
|
In |
Out |
Outcal |
In |
Out |
Outcal |
In |
Out |
Outcal |
|
T/°C |
300 |
604 |
604 |
398 |
729 |
729 |
325 |
590 |
590 |
| P (atm) |
27.2 |
27.1 |
27.1 |
30.0 |
30.0 |
30.0 |
30.0 |
30.0 |
30.0 |
| H2 |
36.88 |
20.96 |
19.90 |
25.64 |
20.60 |
19.92 |
20.6 |
10.42 |
9.72 |
| CO |
4.28 |
1.17 |
1.10 |
18.61 |
8.40 |
8.03 |
8.40 |
2.21 |
2.02 |
| CO2 |
6.13 |
4.46 |
4.28 |
14.74 |
23.30 |
23.58 |
23.30 |
27.74 |
27.84 |
| CH4 |
28.12 |
37.44 |
38.02 |
0.048 |
4.94 |
5.29 |
4.94 |
10.20 |
10.48 |
| H2O |
19.19 |
29.82 |
30.59 |
40.23 |
41.96 |
42.38 |
41.96 |
48.56 |
49.06 |
| N2(Ar) |
5.41 |
6.15 |
6.10 |
0.72 |
0.79 |
0.80 |
0.79 |
0.86 |
0.87 |
4. Conclusions
In summary, we have made a detailed thermodynamic equilibrium analysis of the methanation reactions of carbon oxides (CO and/or CO2) using minimization of the Gibbs free energy method. The effects of temperature (200–800 °C), pressure (1–100 atm), ratio of H2/CO (and H2/CO2), and addition of water steam (and O2, CH4, and C2H4) on the methanation reactions were comprehensively investigated in terms of their effects on the conversion of CO and CO2, CH4 selectivity and yield, as well as on the deposition of carbon. The results indicate that a high CH4 yield (> 99%) can be obtained from CO methanation at low temperatures, high pressures, and high H2/CO ratio without significant carbon deposition. Steam in the feed gas can remarkably suppress carbon formation. Impurity such as O2 and C2H4 should be completely removed in the feed gas to maximise CH4 yield and minimise carbon formation. A low recycle ratio of product gas containing CH4 and H2O is needed to reduce carbon deposition. Compared to CO methanation, CO2 is relatively difficult to be hydrogenated at the same reaction condition. The comparison of experimental data in the case studies with the calculations demonstrated that the Gibbs free energy minimization method is significantly effective for thermodynamic analysis of the methanation process. Our work can principally give a useful guidance in the catalyst development and process control of methanation.
Nomenclature
|
aij
| the number of atoms of element j in species i |
|
fi
| fugacity coefficient of species i |
|
F
i,in
| molar flow rate for products i at inlet |
|
F
i,out
| molar flow rate for products i at outlet |
|
G
T
| total Gibbs free energy |
|
ni
| mole of species i |
|
Ni
| the number of carbon atoms of species i |
|
P
Θ
| standard-state pressure of 101.3 kPa |
|
R
| molar gas constant |
|
μi
| chemical potential of species i |
|
μi
Θ
| standard chemical potential of species i |
|
λ
| Lagrange multiplier |
Acknowledgements
The authors gratefully acknowledge the supports from the Hundred Talents Program of the Chinese Academy of Sciences (CAS), National Key Basic Research Program of China (No. 2011CB200906), National Key Technology R&D Program of China (No. 2010BAC66B01), State Key Laboratory of Multiphase Complex Systems of China (No. MPCS-2009-C-01), Knowledge Innovation Program of the CAS (No. KGCX2-YW-396), and National Natural Science Foundation of China (No. 21031005). F. Gu is grateful to the support of K.C. Wang Post-doctoral Fellowships of the CAS and China Postdoctoral Science Foundation (No. 20100480026).
References
- J. Kopyscinski, T. J. Schildhauer and S. M. A. Biollaz, Fuel, 2010, 89, 1763–1783 CrossRef CAS
 .
.
- M. C. Seemann, T. J. Schildhauer and S. M. A. Biollaz, Ind. Eng. Chem. Res., 2010, 49, 7034–7038 CrossRef CAS .
- A. Haryanto, S. D. Fernando, L. O. Pordesimo and S. Adhikari, Biomass Bioenergy, 2009, 33, 882–889 CrossRef CAS .
- M. Jurascik, A. Sues and K. J. Ptasinski, Energy Environ. Sci., 2009, 2, 791–801 CAS .
-
M. Chandel and E. Williams, Synthetic Natural Gas (SNG): Technology, Environmental Implications, and Economics, Climate Change Policy Partnership, Duke University, 2009 Search PubMed .
- A. H. Chen, T. Miyao, K. Higashiyama, H. Yamashita and M. Watanabe, Angew. Chem., Int. Ed., 2010, 49, 9895–9898 CrossRef CAS .
- C. Galletti, S. Specchia, G. Saracco and V. Specchia, Chem. Eng. Sci., 2010, 65, 590–596 CrossRef CAS .
- G. A. Mills and F. W. Steffgen, Catal. Rev. Sci. Eng., 1974, 8, 159–210 Search PubMed .
- V. Ponec, Catal. Rev. Sci. Eng., 1978, 18, 151–171 CAS .
- W. Wei and G. Jinlong, Front. Chem. Sci. Eng., 2010, 5, 2–10 CrossRef .
- R. W. Dorner, D. R. Hardy, F. W. Williams and H. D. Willauer, Energy Environ. Sci., 2010, 3, 884–890 CAS .
- J. Kopyscinski, T. J. Schildhauer and S. M. A. Biollaz, Chem. Eng. Sci., 2011, 66, 924–934 CrossRef CAS .
- J. Kopyscinski, T. J. Schildhauer and S. M. A. Biollaz, Ind. Eng. Chem. Res., 2011, 50, 2781–2790 CrossRef CAS .
- V. Jimenez, P. Sanchez, P. Panagiotopoulou, J. L. Valverde and A. Romero, Appl. Catal., A, 2010, 390, 35–44 CrossRef CAS .
- M. M. Zyryanova, P. V. Snytnikov, Y. I. Amosov, S. A. Ven'yaminov, E. Z. Golosman and V. A. Sobyanin, Kinet. Catal., 2010, 51, 907–913 CrossRef CAS .
- S. Eckle, H. G. Anfang and R. J. Behm, J. Phys. Chem. C, 2011, 115, 1361–1367 CAS .
- C. Bartholomew, Catal. Rev. Sci. Eng., 1982, 24, 67–112 CAS .
- HaldorTopsoe, Topsøe Recycle Energy-efficient Methanation Process, http://www.topsoe.com/business_areas/gasification_based/ Processes/Substitute_Natural_Gas.aspx, Accessed 08.02, 2011.
- GPGP, Practical experience gained during the first twenty years of operation of the great plains gasification plant and implications for future projects, Office of Fossil Energy, 2006 Search PubMed .
- Davy, Methanation Technology for Coal-to-SNG Project in China, http://www.davyprotech.com/pdfs/080110.pdf,, Accessed 08.22.2011.
- R. L. Ensell and H. J. F. Stroud, The British gas HICOM methanation process for SNG production, 1983 Search PubMed .
-
M. Greyson, J. J. Demeter2, M. D. Schlesinger, G. E. Johnson, J. Jonakin and J. W. Myers, Synthesis of Methane, D. O. Interior Report 5137, Bureau of Mines, U.S., 1955 Search PubMed .
- R. B. Anderson, C. B. Lee and J. C. Machiels, Can. J. Chem. Eng., 1976, 54, 590–594 CAS .
- R. B. Anderson, J. Phys. Chem., 1986, 90, 4806–4810 CrossRef CAS .
- A. Beuls, C. Swalus, M. Jacquemin, G. Heyen, A. Karelovic and P. Ruiz, Appl. Catal., B, 2011 DOI:10.1016/j.apcatb.2011.02.033 .
- F. Ocampo, B. Louis and A. C. Roger, Appl. Catal., A, 2009, 369, 90–96 CrossRef CAS .
- M. K. Nikoo and N. A. S. Amin, Fuel Process. Technol., 2011, 92, 678–691 CrossRef CAS .
- G. A. Nahar and S. S. Madhani, Int. J. Hydrogen Energy, 2010, 35, 98–109 CrossRef CAS .
- S. Adhikari, S. Fernando and A. Haryanto, Energy Fuels, 2007, 21, 2306–2310 CrossRef CAS .
- S. Ozkara-Aydinoglu, Int. J. Hydrogen Energy, 2010, 35, 12821–12828 CrossRef .
- C. Rossi, C. G. Alonso, O. A. C. Antunes, R. Guirardello and L. Cardozo, Int. J. Hydrogen Energy, 2009, 34, 323–332 CrossRef CAS .
-
A. White G, R. Roszkowski T and W. Stanbridge D, in Methanation of Synthesis Gas, AMERICAN CHEMICAL SOCIETY, 1975, vol. 146, ch. 8, 138–148 Search PubMed .
- U. S. D. o. Energy, Practical experience gained during the first twenty years of operation of the great plains gasification plant and implications for future projects, Office of Fossil Energy dakota gasification company prepared for US Department of Energy, 2006 Search PubMed .
- J. L. Li, N. Fu and G. X. Lu, Chin. J. Inorg. Chem., 2010, 26, 2175–2181 CAS .
- T. Abe, M. Tanizawa, K. Watanabe and A. Taguchi, Energy Environ. Sci., 2009, 2, 315–321 CAS .
- J. N. Park and E. W. McFarland, J. Catal., 2009, 266, 92–97 CrossRef CAS .
- K. R. Thampi, J. Kiwi and M. Gratzel, Nature, 1987, 327, 506–508 CrossRef CAS .
- G. A. Du, S. Lim, Y. H. Yang, C. Wang, L. Pfefferle and G. L. Haller, J. Catal., 2007, 249, 370–379 CrossRef CAS .
- H. Harms, B. Hohlein and A. Skov, Chem. Ing. Tech., 1980, 52, 504–515 CrossRef CAS .
- C. WOODWARD, High-temperature methanation catalyst for SNG applications Search PubMed
http://www.anl.gov/PCS/acsfuel/preprint%20archive/ Files/21_4_SAN%20FRANCISCO_08-76_0022.pdf, Accessed 08.02, 2011.
|
| This journal is © The Royal Society of Chemistry 2012 |
Click here to see how this site uses Cookies. View our privacy policy here.