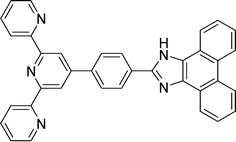
Synthesis, structural characterization, solvatochromism, and ion-binding studies of a ditopic receptor based on 2-(4-[2,2′: 6′,2′′]terpyridin-4′-yl-phenyl)-1H-phenanthro[9,10-d] imidazole (tpy-HImzphen) unit†
Chanchal
Bhaumik
,
Dinesh
Maity
,
Shyamal
Das
and
Sujoy
Baitalik
*
Department of Chemistry, Inorganic Chemistry Section, Jadavpur University, Kolkata 700 032, India. E-mail: sbaitalik@hotmail.com; Fax: + 91 3324146584; Tel: + 91 33 24146666
First published on 6th January 2012
Abstract
A terpyridyl-imidazole based ditopic receptor 2-(4-[2,2′:6′,2′′]terpyridin-4′-yl-phenyl)-1H-phenanthro[9,10-d]imidazole (tpy-HImzphen) has been synthesized and characterized using standard analytical and spectroscopic techniques and also by single crystal X-ray crystallography. The receptor shows multi-channel sensing ability towards F− and Fe2+ ions. Both the anion and cation binding properties of the receptor were thoroughly investigated in dimethylformamide–acetonitrile (1![[thin space (1/6-em)]](https://www.rsc.org/images/entities/char_2009.gif) :
:![[thin space (1/6-em)]](https://www.rsc.org/images/entities/char_2009.gif) 9) solution using absorption, emission, and 1H NMR spectral studies. In the presence of excess of F− ions, deprotonation of the imidazole N–H fragment occurs, an event which is signalled by the development of bright yellow color visible with the naked eye. Anion-induced lifetime enhancing makes the receptor a suitable lifetime-based sensor for F− ions. The absorption and emission titration of the receptor with Fe2+ ion indicates that single conversion of free tpy-HImzphen (colorless) to Fe2+ complex (deep violet color) of 2 tpy-HImzphen
9) solution using absorption, emission, and 1H NMR spectral studies. In the presence of excess of F− ions, deprotonation of the imidazole N–H fragment occurs, an event which is signalled by the development of bright yellow color visible with the naked eye. Anion-induced lifetime enhancing makes the receptor a suitable lifetime-based sensor for F− ions. The absorption and emission titration of the receptor with Fe2+ ion indicates that single conversion of free tpy-HImzphen (colorless) to Fe2+ complex (deep violet color) of 2 tpy-HImzphen![[thin space (1/6-em)]](https://www.rsc.org/images/entities/char_2009.gif) :
:![[thin space (1/6-em)]](https://www.rsc.org/images/entities/char_2009.gif) 1 Fe2+ stoichiometry. The influence of different solvents on the absorption and emission spectral behavior and on the lifetime of the receptor and its Zn(II) complex have also been investigated in detail.
1 Fe2+ stoichiometry. The influence of different solvents on the absorption and emission spectral behavior and on the lifetime of the receptor and its Zn(II) complex have also been investigated in detail.
Introduction
Supramolecular chemistry of anion and cation recognition and sensing is a subject of considerable contemporary research interest because of their important roles in biological, aquatic, environmental and industrial processes.1–7 In the field of anion sensing, the most widely investigated anion is undoubtedly fluoride because of the prominent role played by fluoride ion in biology, medicine, food, and environmental sciences.2,3,9–12 Fluoride plays an important role in preventing dental caries and in the treatment of osteoporosis.3 High doses of this anion are, however, dangerous and can lead to dental or skeletal fluorosis.9–13 Fluoride is often added to drinking water and toothpaste due to its positive effects in dental health. This diversity of function makes the problem of fluoride ion detection one of considerable current interest and extensive interest has been dedicated to the discovery of improved analytical methods and new sensors for detection of fluoride. Compounds containing urea, thiourea, amide, pyrrole or imidazole subunits that are capable of providing hydrogen bond forming sites have been reported to exhibit strong affinity and selectivity towards certain anions.2,3,9–12 On the other hand, transition metal ions such as Fe3+, Fe2+, Zn2+, and Cu2+ play vital roles in many biological processes.1,4–7 Among the transition metals, iron is the most important element involved in living systems, being vital to both plants and animals. Biologically, iron plays crucial roles in the transport and storage of oxygen and also in electron transport in diverse metalloenzymes.4–8 Iron is truly ubiquitous in living systems and tracking their homeostasis in living systems via a suitable technique is of great significance to clarify their biological effects.8 Different types of ligands with N, O, or S donor centers act as binding sites for several transition metal cation.4–8 Although a number of ditopic sensors have been developed for the detection of either anion or alkali and alkaline earth and transition metals either separately or as ion-pairs,13–24 sensing of both F− and Fe2+ ions by a single receptor are relatively sparse in the literature.In recent years, development of multi channel sensors, that is sensors where interactions can be sensed by monitoring different physico-chemical outputs, have emerged as a topic of considerable interest.25–27 In our search for appropriate ligands for the construction of suitable sensors that are capable of recognizing both cations and anions, we have synthesized and characterized a 2-(4-[2,2′:6′,2′′]terpyridin-4′-yl-phenyl)-1H-phenanthro[9,10-d]imidazole (tpy-HImzphen) system, wherein a p-tolylterpyridine moiety has been fused at its 4′-position with a phenanthrene-imidazole motif, which has the potential for multi-channel signaling of both F− and Fe2+ ions. 4′-Substituted terpyridine (tpy) ligands are known to form stable complexes with a large variety of transition metal ions.28–31 In contrast to the related 2,2′-bipyridine (bpy) ligand, which gives rise to the formation of M(bpy)32+-type metal complexes with Δ/Λ chirality, tpy forms defined octahedral coordination compounds M(tpy)22+ with a large number of transition metal ions.28–31 In order to accomplish our goal, we have exploited the fluoride ion signaling potential of the imidazole NH group and transition metal ion binding ability of the terpyridine motif of the receptor. Introduction of rigid and planar phenanthrene fragment in the target molecule beside the imidazole and terpyridine moieties could be expected to have better impact on its photophysical properties, particularly on fluorescence behavior. As will be seen, consequent to anion/cation interaction, remarkable changes in color (visible with eyes) along with similar absorption and photoluminescence responses occur.
Tpy-HImzphen
Results and discussion
Synthesis and characterization
A stoichiometric reaction involving 9,10-phenanthrenedione and 4′-(p-formylphenyl)-2,2′:6′,2′′-terpyridine (tpy–PhCHO) in presence of excess of ammonium acetate in acetic acid medium leads to the formation of the desired ligand, tpy-HImzphen. The homoleptic iron complex of composition [Fe(tpy-HImzphen)2](ClO4)2 was prepared almost quantitatively by treating 2 equivalent of tpy-HImzphen with 1 equivalent of Fe(ClO4)2 in methanol–chloroform solution. It is of interest to see that the colorless solution of ligand changed immediately to deep red-violet on addition of Fe(ClO4)2. Both the ligand and its Fe(II) complex have been thoroughly characterized by their elemental (C, H and N) analyses, ESI-MS, UV-Vis, 1H NMR spectroscopic measurements and the results are given in the Experimental Section. The ESI-MS of Fe(II) complex in CH3CN shows (Fig. S1, ESI†) one abundant peak at m/z 553.25. The isotopic patterns of the original peak at m/z 553.25 separated by 0.5 Da fit very well to the isotope distribution pattern calculated for [Fe(tpy-HImzphen)2]2+ (100%).Description of the crystal structure of tpy-HImzphen
The receptor ligand crystallized in a monoclinic form with the space group Cc. ORTEP representation of the ligand is shown in Fig. 1 and the bond distances and angles are listed in Table S1 and S2 (ESI†). The X-ray crystal structure showed that the terpyridine moiety of the ligand adopts the usual trans–trans conformation about the interannular C–C bonds, which is in agreement with the literature data of the reported terpyridine derivatives.32 This transoid configuration minimizes electrostatic interactions between the nitrogen lone pairs and the van der Waals interactions between the meta protons. The interannular C–C bond length [1.489(4) Å (C5–C6) and 1.479(4) Å (C10–C11)] is comparable with those of the reported 2,2′:6′,2′′ terpyridine derivatives [1.480(1)–1.498(3) Å].32 The other C–C and C–N bond lengths in pyridine, phenyl and phenanthrene rings (Table S1, ESI†) lie within expected ranges. Moreover, the three pyridine rings are not exactly coplanar and the dihedral angles between the central pyridine plane and the two lateral ones are 8.69 and 15.99°. The dihedral angle between the phenyl group attached to the central pyridine and phenanthrene-imidazole moiety is 4.08°, implying almost planar configuration. It is of interest to note that (Fig. S2, ESI†) the NH proton of the imidazole ring of the ligand is involved in intermolecular hydrogen bonding interaction with O atom of (CH3)2CO solvent with N–H⋯O distance of 2.120 Å.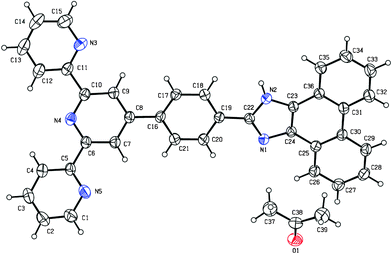 | ||
| Fig. 1 ORTEP representation of the receptor tpy-HImzphen showing 30% probability of thermal ellipsoid. | ||
Proton NMR spectra
1H and 13C NMR spectra of tpy-HImzphen and [Fe(tpy-HImzphen)2](ClO4)2 were recorded in (CD3)2SO (Fig. S3–Fig. S6, ESI†) and their chemical shift values are given in the Experimental Section. The 1H NMR spectra show the presence of a number of resonances in the aromatic region. The COSY NMR spectra (Fig. S7, ESI†) have been particularly useful to locate spin couplings of these protons. The numbering scheme used to assign the observed resonances is given in Scheme 1. The distinct signal, which is most downfield-shifted, is observed as a singlet at 13.60 ppm for the ligand and 13.75 ppm for its Fe(II) complex are due to the imidazole NH proton. The chemical shifts of terpyridine (H3–H6) and phenanthrene ring protons (H9–H12) lie in the region between 7.54 and 8.86 ppm, assigned on the basis of coupling constants and chemical shifts.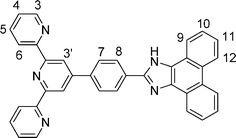 | ||
| Scheme 1 | ||
Absorption and emission spectra
The absorption and emission spectra of the receptor have been recorded in different solvents and the relevant spectral data are given in Table 1. The absorption spectra of the receptor obtained in few selected solvents are shown in Fig. 2. In all the solvents two intense bands are observed in UV region, the position of the lowest energy band lies between 315 and 375 nm, while that of the higher energy one lies between 257 and 266 nm. The higher energy band seems to be due to a π–π* transition, while the lower energy band probably arises due to an intra-ligand charge transfer transition of the terpyridyl-imidazole ligand. Table 1 shows that the absorption band maxima of the receptor shifted to longer wavelength with the increase in polarity as well as with the extent of hydrogen bonding ability of the solvent.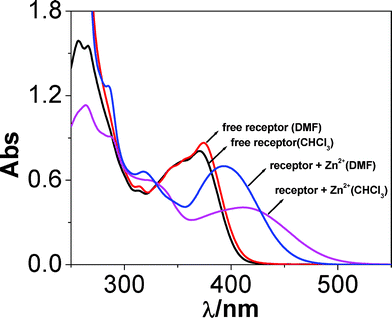 | ||
| Fig. 2 UV-vis spectra of the receptor and its Zn(II) complex in chloroform and dimethylformamide solution. | ||
| Solvent | Free receptor | Zn(II) complex | ||||||
|---|---|---|---|---|---|---|---|---|
| Absorption λmax nm (ε,M−1cm−1) | Emission | Absorptionλmax nm (ε,M−1cm−1) | Emission | |||||
| λ max nm | τ, ns | Φ | λ max nm | τ 1 & τ2 ns | Φ | |||
| CHCl3 | 370(br)(29![[thin space (1/6-em)]](https://www.rsc.org/images/entities/char_2009.gif) 100) 100) |
448 | 1.75 | 0.11 | 425(22![[thin space (1/6-em)]](https://www.rsc.org/images/entities/char_2009.gif) 450) 450) |
592 | 0.54 | 0.055 |
350(br)(26![[thin space (1/6-em)]](https://www.rsc.org/images/entities/char_2009.gif) 000) 000) |
330(26![[thin space (1/6-em)]](https://www.rsc.org/images/entities/char_2009.gif) 350) 350) |
& | ||||||
288(44![[thin space (1/6-em)]](https://www.rsc.org/images/entities/char_2009.gif) 420) 420) |
12.50 | |||||||
| CH2Cl2 | 370(39![[thin space (1/6-em)]](https://www.rsc.org/images/entities/char_2009.gif) 650) 650) |
448 | 1.85 | 0.11 | 398(21![[thin space (1/6-em)]](https://www.rsc.org/images/entities/char_2009.gif) 530) 530) |
600 | 0.42 | 0.081 |
372(36![[thin space (1/6-em)]](https://www.rsc.org/images/entities/char_2009.gif) 950) 950) |
& | |||||||
350(br)(36![[thin space (1/6-em)]](https://www.rsc.org/images/entities/char_2009.gif) 630) 630) |
330(49![[thin space (1/6-em)]](https://www.rsc.org/images/entities/char_2009.gif) 750) 750) |
2.67 | ||||||
| DMF | 375(32![[thin space (1/6-em)]](https://www.rsc.org/images/entities/char_2009.gif) 430) 430) |
476 | 2.19 | 0.1 | 393(25![[thin space (1/6-em)]](https://www.rsc.org/images/entities/char_2009.gif) 673) 673) |
602 | 1.05 | 0.062 |
318(25![[thin space (1/6-em)]](https://www.rsc.org/images/entities/char_2009.gif) 440) 440) |
& | |||||||
354(br)(27![[thin space (1/6-em)]](https://www.rsc.org/images/entities/char_2009.gif) 050) 050) |
285(49![[thin space (1/6-em)]](https://www.rsc.org/images/entities/char_2009.gif) 300) 300) |
2.13 | ||||||
| DMSO | 375(32![[thin space (1/6-em)]](https://www.rsc.org/images/entities/char_2009.gif) 430) 430) |
482 | 2.31 | 0.09 | 388(24![[thin space (1/6-em)]](https://www.rsc.org/images/entities/char_2009.gif) 590) 590) |
620 | 1.02 | 0.032 |
| & | ||||||||
354(br)(27![[thin space (1/6-em)]](https://www.rsc.org/images/entities/char_2009.gif) 050) 050) |
318(25![[thin space (1/6-em)]](https://www.rsc.org/images/entities/char_2009.gif) 870) 870) |
2.47 | ||||||
| CH3OH | 366(36![[thin space (1/6-em)]](https://www.rsc.org/images/entities/char_2009.gif) 820) 820) |
500 | 1.70 | 0.06 | 392(24![[thin space (1/6-em)]](https://www.rsc.org/images/entities/char_2009.gif) 970) 970) |
618 | 0.70 | 0.036 |
| & | ||||||||
346(br)(32![[thin space (1/6-em)]](https://www.rsc.org/images/entities/char_2009.gif) 000) 000) |
316(24![[thin space (1/6-em)]](https://www.rsc.org/images/entities/char_2009.gif) 060) 060) |
3.60 | ||||||
| (CH3)2CO | 372(31![[thin space (1/6-em)]](https://www.rsc.org/images/entities/char_2009.gif) 480) 480) |
462 | 2.00 | 0.12 | 398(29![[thin space (1/6-em)]](https://www.rsc.org/images/entities/char_2009.gif) 880) 880) |
618 | 0.45 | 0.044 |
354(28![[thin space (1/6-em)]](https://www.rsc.org/images/entities/char_2009.gif) 220) 220) |
& | |||||||
341(26![[thin space (1/6-em)]](https://www.rsc.org/images/entities/char_2009.gif) 370) 370) |
2.19 | |||||||
| Hexane | 260(24![[thin space (1/6-em)]](https://www.rsc.org/images/entities/char_2009.gif) 260) 260) |
415 | 1.29 | 0.08 | — | — | — | — |
The effect of the solvent on the absorption spectra of the Zn(II) complexes of the receptor has also been studied (Fig. S8, ESI†). The Zn(II) complex of composition, [Zn(tpy-HImzphen)2]2+ is prepared in situ by adding 0.5 equivalent of Zn(ClO4)2 to tpy-HImzphen ligand. It is seen in Fig. 2, that the lowest-energy absorption band of the free ligand is red-shifted upon coordination by Zn2+ ion. The extent of shift varies between 388 and 425 nm with the maximum in chloroform from 370 to 425 nm. The red-shift of the Zn(II) complex could be attributed to the Zn(II)-induced intraligand charge transfer (ILCT) process from phenyl-phenanthroimidazole group to tpy moiety, because coordinated tpy is a better electron acceptor than the free tpy moiety of tpy-HImzphen.
Upon excitation of either of the two absorption maxima, an intense emission band with their peak lying between 415 nm (hexane) and 500 nm (methanol) are observed. Fig. 3(a) shows the normalized emission spectra of the receptor in different solvents. As compared with the absorption spectra, its emission spectral behavior shows significantly larger solvatochromism. Fig. 3(b) shows the photograph of different emission colors (violet → blue → green → yellow) of the free ligand in different solvents upon excitation with UV light. It is interesting to note that as the emission colors were finely tuned from violet to blue to green to finally yellow; the receptor can act as a suitable solvent polarity indicator, e.g. a solvatochromic probe.30,33,34
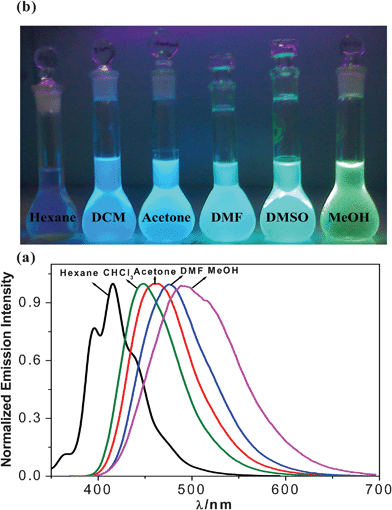 | ||
| Fig. 3 (a) Normalized emission spectra and (b) different emission colors seen up on excitation with UV light of the receptor in different solvents. | ||
We have also studied the fluorescence decay behavior of the receptor in different solvents and the changes in decay profiles of the receptor as a function of solvent is represented in Fig. 4(a).
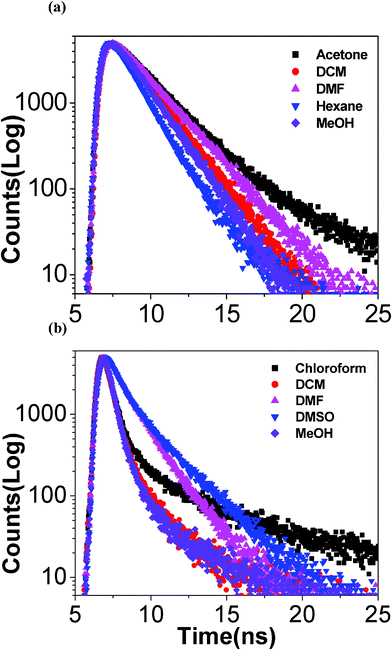 | ||
| Fig. 4 Time-resolved fluorescence decay profiles of the free receptor (a) and its Zn(II) complex (b) in different solvents. | ||
In all the cases, a single exponential fit to the decay profiles was found satisfactory from the χ2 values and the residuals and the measured lifetime of the receptor lie in the range between 1.29 and 2.31 ns at room temperature. It is of interest to note that the lifetime of the receptor increases gradually with the increase in the polarity of the solvent except in methanol.
The effect of coordination of Zn2+ ion to the receptor is also reflected in their emission spectral profiles in different solvents. Compared to the free receptor, its Zn(II) complex shows weak emission in the long wavelength region which probably originate from the ILCT state of [Zn(tpy-HImzphen)2]2+.29,30,33Fig. 5(a) shows the absolute emission spectra of the receptor, while Fig. 5(b) shows a photograph of different emission colors of Zn(II) complex of the receptor in different solvents upon excitation with UV light.
![(a) Emission spectra and (b) different emission colors seen on excitation with UV light of Zn(ii) complex, [Zn(tpy-HImzphen)2]2+ of the receptor in different solvents.](/image/article/2012/RA/c2ra00023g/c2ra00023g-f5.gif) | ||
| Fig. 5 (a) Emission spectra and (b) different emission colors seen on excitation with UV light of Zn(II) complex, [Zn(tpy-HImzphen)2]2+ of the receptor in different solvents. | ||
The effect of different solvents on Zn2+ complexes of the receptor have also been investigated by time-resolved fluorescence studies and the decay profiles are shown in Fig. 4(b). As compared with single exponential decay of the free receptor, Zn(II) complex exhibited complex kinetics that adequately fit with a sum of two exponentials. The lifetime of the short component lies between 0.42 and 1.05 ns, while that of the long component varies between 2.13 to 12.50 ns.
The electronic absorption spectrum of acetonitrile solution of [Fe(tpy-HImzphen)2]2+ (Fig. S9, ESI†) shows an intense band at 575 nm which can be assigned as the FeII(dπ)–π*(tpy–HImzphen) MLCT transition. The spectrum of the complex also exhibits a series of higher energy absorptions arising from ligand centered π–π* and n-π* transitions. The Fe(II) complex is non-luminescent at room temperature. The photo-physical properties of [Fe(tpy-HImzphen)2]2+ is complicated by the presence of ligand field (LF) excited states which is in accordance to the literature data on polypyridyl Fe(II) complexes.29,35 These states arise from population of the empty metal dσ* orbitals. Although optical transitions to yield the LF excited states are not dipole-allowed and are therefore of low probability, the LF states can become populated by crossing from the MLCT states. This occurs readily in polypyridine Fe(II) complexes where the LF state lies below the MLCT state.35
Colorimetric sensing of both anion and cation by the receptor
The sensing ability of the receptor has been studied on a qualitative basis by visual examination of the anion- and cation-induced color changes in dimethylformamide–acetonitrile (1![[thin space (1/6-em)]](https://www.rsc.org/images/entities/char_2009.gif) :
:![[thin space (1/6-em)]](https://www.rsc.org/images/entities/char_2009.gif) 9) solutions (50 μM) before and after the addition of anion (500 μM) and cation (60 μM), respectively. Tetrabutylammonium (TBA) salts of anions and hydrated perchlorate salts of the cations have been used as substrates for the receptor. The photograph in Fig. 6 shows the dramatic color changes of the receptor in the presence of F−, and Fe2+ ions in contrast to other anions and cations. The photograph shows that among the anions, only F− and OH− ions can cause evolution of bright yellow color. On the other hand, addition of 0.5 equivalents of Fe2+ ion to a solution of the receptor shows an appreciable change of color from colorless to deep violet. Other ions do not show such dramatic color change except appearance of a light yellow color in the case of Co2+ Ni2+, Cu2+, Zn2+ and Cd2 ions. Visual color change of the receptor in the presence of F− and Fe2+ can be useful for the “naked-eye” detection of these ions in solution.
9) solutions (50 μM) before and after the addition of anion (500 μM) and cation (60 μM), respectively. Tetrabutylammonium (TBA) salts of anions and hydrated perchlorate salts of the cations have been used as substrates for the receptor. The photograph in Fig. 6 shows the dramatic color changes of the receptor in the presence of F−, and Fe2+ ions in contrast to other anions and cations. The photograph shows that among the anions, only F− and OH− ions can cause evolution of bright yellow color. On the other hand, addition of 0.5 equivalents of Fe2+ ion to a solution of the receptor shows an appreciable change of color from colorless to deep violet. Other ions do not show such dramatic color change except appearance of a light yellow color in the case of Co2+ Ni2+, Cu2+, Zn2+ and Cd2 ions. Visual color change of the receptor in the presence of F− and Fe2+ can be useful for the “naked-eye” detection of these ions in solution.
 | ||
Fig. 6 Color changes that occurs when the dimethylformamide–acetonitrile (1![[thin space (1/6-em)]](https://www.rsc.org/images/entities/char_2009.gif) : :![[thin space (1/6-em)]](https://www.rsc.org/images/entities/char_2009.gif) 9) solutions of the receptor are treated with (a) various anions as their tetrabutylammonium (TBA) salts and (b) various metal cations as their perchlorate salts. 9) solutions of the receptor are treated with (a) various anions as their tetrabutylammonium (TBA) salts and (b) various metal cations as their perchlorate salts. | ||
Multi-channel anion sensing studies of the receptor
1H NMR signaling
Fig. 7 shows the 1H NMR spectra of the free receptor and in the presence of 10 equivalent of F− ion in DMSO-d6. It is of interest to note that the addition of F− leads to complete removal of the N–H signal and small up-field shift of H7 of phenyl ring and H9–H11 protons of phenanthrene ring attached to imidazole moiety. The chemical shifts for the tpy protons of the ligand are far less affected. Clearly, F− ions act as the proton abstractor. The small up-field shift of H7 and H9–H11 protons in the ligand is due to augmentation of electron density at this site due to delocalization of the negative charge of the imidazole ring brought about by N–H deprotonation.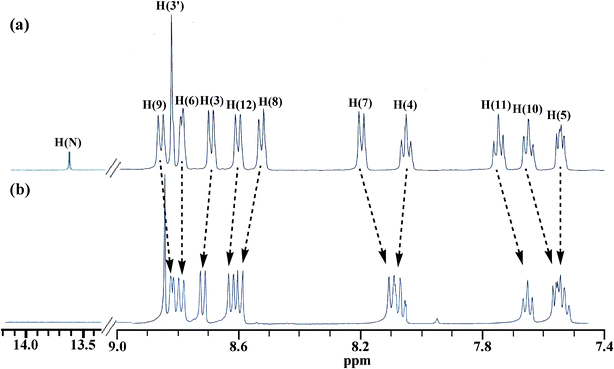 | ||
| Fig. 7 1H NMR spectra of the receptor in absence (a) and in the presence (b) of 10 equiv. of F− ions in DMSO-d6. | ||
Absorption signaling
Sensing of the anions by the receptors has been monitored by observing the spectral changes that occur in dimethylformamide–acetonitrile (1![[thin space (1/6-em)]](https://www.rsc.org/images/entities/char_2009.gif) :
:![[thin space (1/6-em)]](https://www.rsc.org/images/entities/char_2009.gif) 9) solutions. As shown in Fig. 8(a), the peaks at 371, 354, 341 and 263 nm remain practically unchanged upon addition of 10 equivalents of Cl−, Br−, I−, AcO−, H2PO4− and ClO4− ions to (20 μM) solutions of the receptor. On the other hand, following the addition of 10 equivalents of F−, these bands get red-shifted to 413 and 279 nm, indicating that strong interactions occur between the receptor and F− ion. These observations are in consonance with the visual changes already noted in Fig. 6. The red-shift of the spectral band can be attributed to anion-induced deprotonation of the imidazole NH proton of the receptor which increases the electron density at the imidazole fragment leading to lowering of the band energy.36
9) solutions. As shown in Fig. 8(a), the peaks at 371, 354, 341 and 263 nm remain practically unchanged upon addition of 10 equivalents of Cl−, Br−, I−, AcO−, H2PO4− and ClO4− ions to (20 μM) solutions of the receptor. On the other hand, following the addition of 10 equivalents of F−, these bands get red-shifted to 413 and 279 nm, indicating that strong interactions occur between the receptor and F− ion. These observations are in consonance with the visual changes already noted in Fig. 6. The red-shift of the spectral band can be attributed to anion-induced deprotonation of the imidazole NH proton of the receptor which increases the electron density at the imidazole fragment leading to lowering of the band energy.36
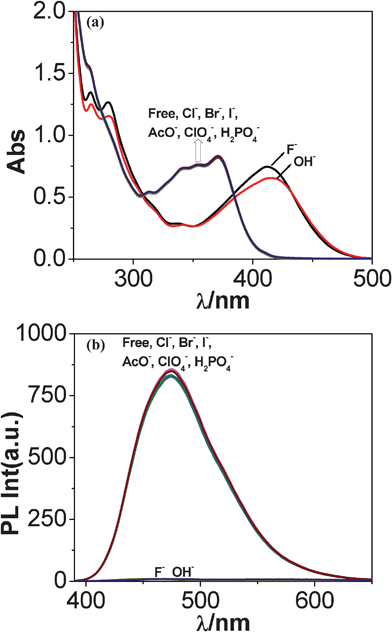 | ||
Fig. 8 Changes in UV-vis (a) and luminescence (b) spectra of tpy-HImzphen (20 μM) in dimethylformamide–acetonitrile (1![[thin space (1/6-em)]](https://www.rsc.org/images/entities/char_2009.gif) : :![[thin space (1/6-em)]](https://www.rsc.org/images/entities/char_2009.gif) 9) solution upon the addition of different anions (200 μM) as TBA salts. 9) solution upon the addition of different anions (200 μM) as TBA salts. | ||
In order to get quantitative insight into sensor–anion interaction spectrophotometric titration experiments were carried out of tpy-HImzphen in DMF–CH3CN (1![[thin space (1/6-em)]](https://www.rsc.org/images/entities/char_2009.gif) :
:![[thin space (1/6-em)]](https://www.rsc.org/images/entities/char_2009.gif) 9) with various anions. Fig. 9(a) presents the changes in the UV-vis spectrum of tpy-HImzphen as a function of the F− ion. As can be seen, the absorption peaks at 371, 354 and 341 nm decreased upon the addition of F− to a solution of tpy-HImzphen, and new peaks at 413 and 279 nm appeared with two isosbestic points at 382 and 313 nm, after the addition of a large excess of F−. Furthermore, the color of the solution was seen to change from colorless to yellow. Standard curve-fitting procedures were then used to derive the equilibrium constant (5.0 × 10⁴ M−1). The spectrophotometric detection limit of the receptor for F− is determined as ∼5.4 × 10⁻⁷ M (Fig. S10, ESI†).37,38 Absorption titrations of the receptor with other anions were also carried out in the same way as F−. It is to be noted that no observable spectral change occurs except with a large excess (more than 500 equiv.) of AcO− ion (Fig. S11, ESI†). Spectrophotometric titration of the ligand was also carried out with TBAOH. The spectral patterns obtained with OH− (Fig. S12a, ESI†) have close resemblance to the spectra of the receptor with F−. The results suggested that the imidazole N–H proton of the receptor gets deprotonated on addition of F− and to a lesser extent with AcO−.
9) with various anions. Fig. 9(a) presents the changes in the UV-vis spectrum of tpy-HImzphen as a function of the F− ion. As can be seen, the absorption peaks at 371, 354 and 341 nm decreased upon the addition of F− to a solution of tpy-HImzphen, and new peaks at 413 and 279 nm appeared with two isosbestic points at 382 and 313 nm, after the addition of a large excess of F−. Furthermore, the color of the solution was seen to change from colorless to yellow. Standard curve-fitting procedures were then used to derive the equilibrium constant (5.0 × 10⁴ M−1). The spectrophotometric detection limit of the receptor for F− is determined as ∼5.4 × 10⁻⁷ M (Fig. S10, ESI†).37,38 Absorption titrations of the receptor with other anions were also carried out in the same way as F−. It is to be noted that no observable spectral change occurs except with a large excess (more than 500 equiv.) of AcO− ion (Fig. S11, ESI†). Spectrophotometric titration of the ligand was also carried out with TBAOH. The spectral patterns obtained with OH− (Fig. S12a, ESI†) have close resemblance to the spectra of the receptor with F−. The results suggested that the imidazole N–H proton of the receptor gets deprotonated on addition of F− and to a lesser extent with AcO−.
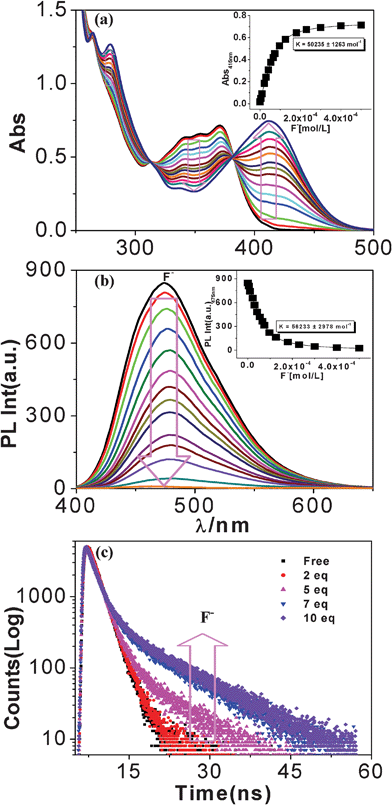 | ||
Fig. 9 Changes in UV–vis (a), steady state luminescence (b), and time-resolved fluorescence (c) spectra of tpy-HImzphen (20 μM) in dimethylformamide-acetonitrile (1![[thin space (1/6-em)]](https://www.rsc.org/images/entities/char_2009.gif) : :![[thin space (1/6-em)]](https://www.rsc.org/images/entities/char_2009.gif) 9) upon addition of F− ions (0–180 μM). The inset shows the fit of the experimental absorbance and luminescence data to a 1 9) upon addition of F− ions (0–180 μM). The inset shows the fit of the experimental absorbance and luminescence data to a 1![[thin space (1/6-em)]](https://www.rsc.org/images/entities/char_2009.gif) : :![[thin space (1/6-em)]](https://www.rsc.org/images/entities/char_2009.gif) 1 binding profile. 1 binding profile. | ||
Fluorescence signaling
Fig. 8(b) shows that the emission intensity of the band at 475 nm undergoes nominal change with the addition of Cl−, Br−, I−, AcO−, H2PO4− and ClO4−. On the other hand, with the ten-fold addition of F− ions, the emission intensity gets significantly quenched with consequent red shift of emission maximum from 475 to 485 nm. Thus, the absorbance and luminescence behavior of the receptor towards anions show close resemblances to each other. Photoluminescence titrations of the receptor with various anions have been carried out in the same way as already described for spectrophotometric measurements. In Fig. 9(b), the effect of incremental addition of F− ions to the receptor is shown and the inset shows that almost complete quenching of luminescence intensity occurs at ca. 10 equivalents. Fig. S12b (ESI†) presents the changes in the emission spectrum of tpy-HImzphen as a function of OH−.The selectivity for F− over other anions, especially Cl−, Br−, I−, AcO− and H2PO4−, is important because many reported fluoride sensors suffer from the deleterious interference of these anions. The excellent selectivity of the receptor for fluoride over other anions (except OH−) is evident from the pronounced differences in absorption and emission spectral behavior and also from color changes. The fluorimetric detection limit of the receptor for F− in CH3CN–DMF (9![[thin space (1/6-em)]](https://www.rsc.org/images/entities/char_2009.gif) :
:![[thin space (1/6-em)]](https://www.rsc.org/images/entities/char_2009.gif) 1) is ∼1.5 × 10⁻⁷ M (Fig. S13, ESI†).37,38 When H2O-containing solvents such as DMSO-H2O, were used, similar sensing behavior was observed (Fig. S14, ESI†), but the deprotonation process is associated with larger equivalents of F− due to the competition effect of H2O, as observed for most fluoride chemosensors based on the hydrogen-bonding mechanism.38 The fluorimetric detection limit of the receptor for F− in DMSO–H2O (3
1) is ∼1.5 × 10⁻⁷ M (Fig. S13, ESI†).37,38 When H2O-containing solvents such as DMSO-H2O, were used, similar sensing behavior was observed (Fig. S14, ESI†), but the deprotonation process is associated with larger equivalents of F− due to the competition effect of H2O, as observed for most fluoride chemosensors based on the hydrogen-bonding mechanism.38 The fluorimetric detection limit of the receptor for F− in DMSO–H2O (3![[thin space (1/6-em)]](https://www.rsc.org/images/entities/char_2009.gif) :
:![[thin space (1/6-em)]](https://www.rsc.org/images/entities/char_2009.gif) 2) is ∼1.2 × 10⁻⁶ M (Fig. S15, ESI†).
2) is ∼1.2 × 10⁻⁶ M (Fig. S15, ESI†).
Lifetime-based signaling
The luminescence lifetime of the receptor as a function of the F− ion concentration is represented in Fig. 9(c). In the absence of fluoride, it exhibited a single-exponential decay with lifetime τ = 1.75 ns in chloroform at room temperature. During the first two F− (up to 2.0 equiv) additions, the intensity decays remain almost unchanged. At higher F− concentrations (> 2.0 equiv), the intensity decays exhibited complex kinetics which can be fitted with a sum of two exponentials. It is interesting to note that although the first exponential component remained effectively constant (short τ 1.52–1.78), the second component gradually increases ranging from 3.10 to 10.64 ns (long τ) with the increase of F− ion concentration. These data suggest that there are at least two distinct luminescent species, consisting of NH deprotonated receptor, whose lifetime is longer, and free receptor whose life time is shorter, the sum of which results in the observed lifetime enhancing as shown in Fig. 9(c). Thus, the anion-induced lifetime enhancement makes the terpyridyl-imidazole ligand a suitable lifetime-based sensor for F− ion.Multi-channel cation sensing studies of the receptor
1H NMR signaling
Fig. 10 shows the 1H NMR spectra of the free receptor and in the presence of 0.5 equivalent of Fe2+ ion in DMSO-d6. The effect of coordination of Fe2+ center to the ligand on the chemical shifts of its different protons has been illustrated in Fig. 10. The H3 proton of the tpy moiety is significantly affected because this proton experiences maximum shielding due to anisotropic ring current effect of the adjacent pyridine of other ligand. The other tpy protons (H3′, H4 and H6) get shifted to downfield region, except H5. Again, as expected, the signals due to phenanthrene ring protons are far less affected.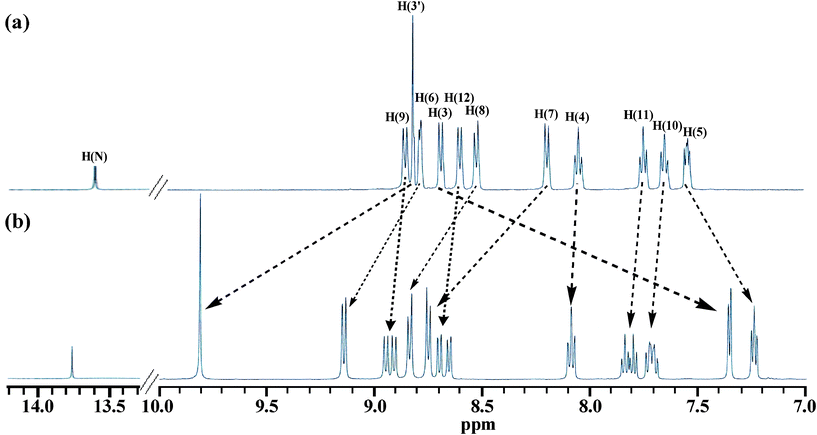 | ||
| Fig. 10 1H NMR spectra of the receptor in absence (a) and in the presence (b) of 0.5 equiv. of Fe2+ ion in DMSO-d6. | ||
Absorption signaling
The sensing of the receptor for metal cations was studied through UV-vis spectra in dimethylformamide–acetonitrile (1![[thin space (1/6-em)]](https://www.rsc.org/images/entities/char_2009.gif) :
:![[thin space (1/6-em)]](https://www.rsc.org/images/entities/char_2009.gif) 9) solutions. Fig. 11 shows the changes in the spectral profiles of the receptor following the addition of 0.5 equivalents of different metal ions. As can be seen with all the metal ions, distinct changes in absorption spectral profile of the receptor was observed upon coordination. It is of interest to note that following the addition of Fe2+ a strong MLCT band originates at 575 nm with the evolution of bright violet color in contrast to other metal ions. Whereas the cobalt complex also shows much weaker absorption in the visible region (λ> 400 nm) due to metal-to-ligand charge-transfer absorption, the complexes of other metals either absorb weakly in this area or do not show any absorptions at wavelengths higher than 390 nm. Interestingly, these events can be distinguished visually as shown in the picture (Fig. 6). A significant spectral red-shift from 370 nm to 575 nm in the case of Fe2+ over the other metal ions suggests that the receptor can be useful for the detection of Fe2+ in solution.
9) solutions. Fig. 11 shows the changes in the spectral profiles of the receptor following the addition of 0.5 equivalents of different metal ions. As can be seen with all the metal ions, distinct changes in absorption spectral profile of the receptor was observed upon coordination. It is of interest to note that following the addition of Fe2+ a strong MLCT band originates at 575 nm with the evolution of bright violet color in contrast to other metal ions. Whereas the cobalt complex also shows much weaker absorption in the visible region (λ> 400 nm) due to metal-to-ligand charge-transfer absorption, the complexes of other metals either absorb weakly in this area or do not show any absorptions at wavelengths higher than 390 nm. Interestingly, these events can be distinguished visually as shown in the picture (Fig. 6). A significant spectral red-shift from 370 nm to 575 nm in the case of Fe2+ over the other metal ions suggests that the receptor can be useful for the detection of Fe2+ in solution.
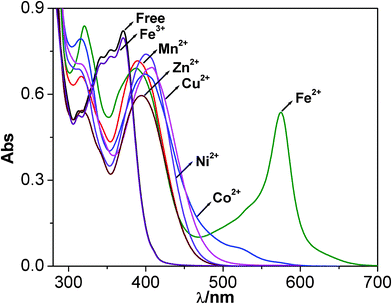 | ||
Fig. 11 Changes in UV-vis spectra of receptor (20 μM) in dimethylformamide-acetonitrile (1![[thin space (1/6-em)]](https://www.rsc.org/images/entities/char_2009.gif) : :![[thin space (1/6-em)]](https://www.rsc.org/images/entities/char_2009.gif) 9) upon the addition of different metal ions (20 μM). 9) upon the addition of different metal ions (20 μM). | ||
It has been of interest to assess the colorimetric sensing ability of the receptor towards various metal ions. In order to do so UV-vis titration of tpy-HImzphen with different transition metal cations was carried out in dimethylformamide–acetonitrile (1![[thin space (1/6-em)]](https://www.rsc.org/images/entities/char_2009.gif) :
:![[thin space (1/6-em)]](https://www.rsc.org/images/entities/char_2009.gif) 9). Fig. 12(a) and 12(c) show the spectral changes that take place upon the addition of increased amounts of Fe(ClO4)2 and Zn(ClO4)2 to the receptor, respectively. As may be noted, the new band centered at 575 nm increases linearly with the incremental addition of Fe2+ ion until the [Fe2+]/[tpy-HImzphen] reaches 0.5. Even higher Fe2+ does not lead to any further change. The titration profile based on absorbance at 575 nm and the clear isosbestic points at 380, 335 and 278 nm imply the single conversion of free tpy-HImzphen to Fe2+ complex of 2 tpy-HImzphen
9). Fig. 12(a) and 12(c) show the spectral changes that take place upon the addition of increased amounts of Fe(ClO4)2 and Zn(ClO4)2 to the receptor, respectively. As may be noted, the new band centered at 575 nm increases linearly with the incremental addition of Fe2+ ion until the [Fe2+]/[tpy-HImzphen] reaches 0.5. Even higher Fe2+ does not lead to any further change. The titration profile based on absorbance at 575 nm and the clear isosbestic points at 380, 335 and 278 nm imply the single conversion of free tpy-HImzphen to Fe2+ complex of 2 tpy-HImzphen![[thin space (1/6-em)]](https://www.rsc.org/images/entities/char_2009.gif) :
:![[thin space (1/6-em)]](https://www.rsc.org/images/entities/char_2009.gif) 1 Fe2+ stoichiometry. The metal ion binding is associated with a development of deep violet color observable by the naked eye. In contrast to Fe2+, no color changes occurred for Fe3+, indicating the lack of associative behavior of the receptor with the trivalent iron.
1 Fe2+ stoichiometry. The metal ion binding is associated with a development of deep violet color observable by the naked eye. In contrast to Fe2+, no color changes occurred for Fe3+, indicating the lack of associative behavior of the receptor with the trivalent iron.
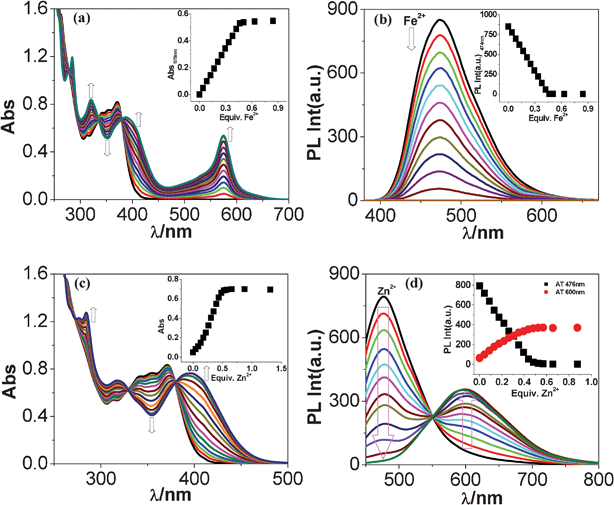 | ||
Fig. 12 Changes in UV-vis (a, c) and photoluminescence (b, d) spectra of tpy-HImzphen (20 μM) in dimethylformamide-acetonitrile (1![[thin space (1/6-em)]](https://www.rsc.org/images/entities/char_2009.gif) : :![[thin space (1/6-em)]](https://www.rsc.org/images/entities/char_2009.gif) 9) upon addition of Fe(ClO4)2 (20 μM) and Zn(ClO4)2 (20 μM). The inset shows the change of absorption and emission intensity as a function of the equivalent of Fe2+ and Zn2+ ions added. 9) upon addition of Fe(ClO4)2 (20 μM) and Zn(ClO4)2 (20 μM). The inset shows the change of absorption and emission intensity as a function of the equivalent of Fe2+ and Zn2+ ions added. | ||
With the progressive addition of Zn(ClO4)2, diminution of the intensity of the major peak at 370 nm with a simultaneous increase of absorbance of both the peaks at 395 and 284 nm occurs. In this case, successive absorption curves pass through well-defined isosbestic points at 380, 330, 273 and 261 nm. The red-shift of Zn(II) complex could be attributed to the Zn(II)-induced intraligand charge transfer (ILCT) process from phenyl-phenanthroimidazole group to tpy moiety, because coordinated tpy is a better electron acceptor than the free tpy moiety of ligand. The clear isosbestic points and the titration profile imply the conversion of free tpy-HImzphen to Zn2+ complex of 2 tpy-HImzphen![[thin space (1/6-em)]](https://www.rsc.org/images/entities/char_2009.gif) :
:![[thin space (1/6-em)]](https://www.rsc.org/images/entities/char_2009.gif) 1 Zn2+ binding stoichiometry. The overall changes in the spectral profiles of the receptor with other metal ions are basically similar with that of the Zn2+ ion (Fig. S16–S21, ESI†).
1 Zn2+ binding stoichiometry. The overall changes in the spectral profiles of the receptor with other metal ions are basically similar with that of the Zn2+ ion (Fig. S16–S21, ESI†).
For all metal ions, distinct changes in tpy absorption were observed upon complexation and clear isosbestic points were found (Fig. 12 and Fig. S16–S21, ESI†) indicating that only a single equilibrium between two species, namely free and complexed tpy-HImzphen, occurs during the titration. Whereas iron(II) complex shows intense absorption in the visible region due to metal-to-ligand charge-transfer absorption, the complexes of other metal ions only absorb very weakly in this area. Absorption titration profiles of the free receptor with various metal ions (insets to Fig. 12 and Fig. S16–S21, ESI†) show a linear increase and a sharp end point at a metal/ligand ratio of 0.5![[thin space (1/6-em)]](https://www.rsc.org/images/entities/char_2009.gif) :
:![[thin space (1/6-em)]](https://www.rsc.org/images/entities/char_2009.gif) 1, indicating the formation of a [M(tpy-HImzphen)2]2+ (1
1, indicating the formation of a [M(tpy-HImzphen)2]2+ (1![[thin space (1/6-em)]](https://www.rsc.org/images/entities/char_2009.gif) :
:![[thin space (1/6-em)]](https://www.rsc.org/images/entities/char_2009.gif) 2) complex. Due to the lack of curvature in the titration curve, no binding constants could be determined.28c,39
2) complex. Due to the lack of curvature in the titration curve, no binding constants could be determined.28c,39
The sensitivity and selectivity of the ditopic receptor for different metal ions have also been studied. Spectrophotometric measurements in the presence of competing cations have been performed by treating a solution of tpy-HImzphen (20 μM) with 0.5 equivalents of Fe2+ in the presence of each of the other metal ions viz. Mn2+, Co2+, Ni2+, Cu2+, Zn2+, Pb2+, and Cd2+. In the competition experiments, we are still able to observe the band at 575 nm due to Fe2+ MLCT, though the intensity is little less compared with [Fe(tpy-HImzphen)2]2+ only. The results clearly indicate that the receptor has a high selectivity for Fe2+ over other metal ions. The selectivity of the receptor for Fe2+ over other metal ions can also be judged by comparing the epsilon (ε) values of the Fe-complex with those of the other metal complexes at a given wavelength. Table S3 (ESI†) shows the ε values of complexes of different metal ions under investigation at three different wavelengths assuming that only two species (tpy-HImzphen and [M(tpy-HImzphen)2]2+) exit in solution, and there is no reason to believe that significant amounts of intermediate complexes will exist other than the homoleptic metal complexes at low metal concentrations. Much higher ε values of the Fe-complex over the others at a given wavelength suggests that the receptor can act as an effective and selective sensor toward the detection of Fe2+ over other metals in solution.
Fluorescence signaling
Fluorescence titration of the receptor with different metal cations was also investigated. Fig. 12(b) and Fig. 12(d) show the change of emission intensity of the receptor on incremental addition of Fe(ClO4)2 and Zn(ClO4)2, respectively. The inset to Fig. 12 indicates that complete quenching of emission at 475 nm occurs at 0.5 equiv. of both metal ions. It is interesting to note that coordination of the metal ions triggers the emission quenching of the receptor in all cases except with Zn2+. In case with Zn2+, gradual quenching of the fluorescence intensity at 475 nm accompanied by a distinct linear emission enhancement also occur at 600 nm with the incremental addition of Zn2+ ion (Fig. 12(d)). Fig. 13 shows the time-resolved decay profiles of the receptor at the two wavelengths [475 nm (emission quenching) and 600 nm (emission enhancement)] as function of the incremental amount of Zn2+ ion. As compared with single exponential decay of the free receptor, Zn(II) complex exhibited bi-exponential decay. In general there is a gradual decrease in the lifetime of the receptor when the emission is monitored at 475 nm, while there is gradual increase of lifetime (2.25 to 12.60 ns) when the emission is monitored at 600 nm.![Changes in time-resolved decay profiles of the receptor (20 μM) at the two wavelengths [(a) at 475 nm (emission quenching) and (b) at 600 nm (emission enhancement)] as function of the incremental addition of Zn2+ ion (20 μM).](/image/article/2012/RA/c2ra00023g/c2ra00023g-f13.gif) | ||
| Fig. 13 Changes in time-resolved decay profiles of the receptor (20 μM) at the two wavelengths [(a) at 475 nm (emission quenching) and (b) at 600 nm (emission enhancement)] as function of the incremental addition of Zn2+ ion (20 μM). | ||
One of the most important parameters in cation sensing is the detection limit. For many practical purposes, it is important to sense cations at extremely low concentrations. Thus, based on the absorption and fluorescence titration measurements, detection limit of tpy-HImzphen for Fe2+ was found to be ∼3.9 × 10⁻⁹ M and ∼3.9 × 10⁻⁹ M, respectively (Fig. S22 and Fig. S23, ESI†). It is of interest to note that tpy-HImzphen can be applied for detection of Fe2+ at concentrations as low as 10−9 M, which might meet the requirements in biosensing.37,38 Most importantly, the novel probe has also solved the problem of serious interferences from Fe3+. Thus, the present system could find application in the selective sensing of Fe2+ in the presence of both Fe2+ and Fe3+ ions. Furthermore, the receptor was successfully applied for sensing in mixed aqueous–organic (H2O–DMSO) media (Fig. S24 and Fig. S25, ESI†), indicative of a promising Fe2+ chemosensor in certain practical applications.
Sensing in the presence of competing ions
Since the receptor consists of binding sites for both the metal cation and anion, we investigated the effect of competing F− ion on the binding ability of tpy-HImzphen for metal ions and vice versa. Two different strategies have been taken for carrying out these experiments. Firstly, we have titrated tpy-HImzphen with F− in the presence of 0.5 equivalents of metal ions. Secondly, we have titrated tpy-HImzphen with M2+ in the presence of 10 equivalents of F− ion. Spectrophotometric measurements (Fig. 14) show that the addition of F− to the tpy-HImzphen·Fe2+ complex leads to a gradual reduction of the intensity of the band at 575 nm with concomitant change of color from violet to colorless with up to 5 equivalents of F− ion. On addition of F− beyond 5 equivalents leads to enhancement of the intensity of the band at 416 nm with the development of bright yellow color, similar to those observed on addition of F− ion to free receptor. Emission titrations of the tpy-HImzphen·Fe2+ complex with incremental addition of F− is shown in Fig. 14(e). The tpy-HImzphen·Fe2+ complex is non-luminescent at room temperature. On addition of 5 equivalents of F−, significant enhancement of emission at 480 nm (free receptor, 475 nm) {Fig. 14(d)} occurs. Upon the addition of an excess of F− (up to 15 equivalents), the emission of the said band is again completely quenched {Fig. 14(f)}. These data clearly indicate that addition of the first few equivalents of F− leads to sequestering of the Fe2+ ion from the receptor to form a more stable ion-pair or complex cation in solution, and anion binding by the receptor is effectively inhibited by this process.19,26,40 But in the presence of excess of F− ions, when sequestering of the metal ion is complete, deprotonation of the imidazole NH proton of tpy-HImzphen occurs.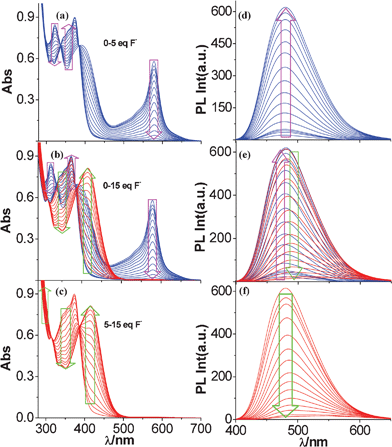 | ||
Fig. 14 Changes in UV-vis (a–c) and photoluminescence (d–f) spectra of tpy-HImzphen·Fe2+ in dimethylformamide-acetonitrile (1![[thin space (1/6-em)]](https://www.rsc.org/images/entities/char_2009.gif) : :![[thin space (1/6-em)]](https://www.rsc.org/images/entities/char_2009.gif) 9) upon incremental addition of F− ions. 9) upon incremental addition of F− ions. | ||
In the second experiment (shown in Fig. 15), which is carried out in the presence of 10 equivalents of F−, addition of Fe2+ ions leads to a gradual reduction of the intensity of the absorption band at 416 nm, due to the sequestering of F− ions. The presence of excess F− in the solution engages the metal ions in ion pair and/or complex formation in solution rather than engaging them in complexation with the receptor. As shown in Fig. 15, the enhancement of the intensity of the band at 582 nm for Fe2+ complex occurs only after addition of more than 5 equivalents of Fe2+ ion. The sensing studies in the presence of competing ions indicate that although tpy-HImzphen contains distinct binding sites for both anion and cation, simultaneous binding of both the species, is not possible in this case unless the total concentration of the two species is much less than what a particular binding site can accommodate.
 | ||
Fig. 15 Changes in UV-vis (a–c) and photoluminescence (d–f) spectra of tpy-HImzphen·F− in dimethylformamide-acetonitrile (1![[thin space (1/6-em)]](https://www.rsc.org/images/entities/char_2009.gif) : :![[thin space (1/6-em)]](https://www.rsc.org/images/entities/char_2009.gif) 9) upon incremental addition of Fe2+ ion. 9) upon incremental addition of Fe2+ ion. | ||
Conclusions
In conclusion, we have developed a new sensor 2-(4-[2,2′:6′,2′′]terpyridin-4′-yl-phenyl)-1H-phenanthro[9,10-d]imidazole (tpy-HImzphen), where the terpyridine moiety has been utilized as the cation binding site and phenthrene-imidazole motif as anion binding site. The receptor can act as colorimetric sensor for Fe2+ and F− ions. The binding properties of both F− and Fe2+ ions have been confirmed by absorption, emission and 1H NMR spectroscopic studies. Anion sensing studies indicate that in the presence of excess F−, deprotonation of the imidazole N–H proton occurs leading to the development of a bright yellow color. Again, formation of intense and beautiful violet color on addition of Fe2+ to the receptor is due to the formation of a bis-homoleptic Fe(II) complex of composition [Fe(tpy-HImzphen)2]2+. Anion-induced lifetime enhancing also makes the receptor a suitable lifetime-based sensor for F− ion. In essence the new receptor can acts as a multi–channel sensor for both F− and Fe2+ ions in solution. Another point of interest is that the emitting properties of the receptor and its Zn(II) complex are strongly influenced by the polarity of different solvents. This opens up the possibility of the application of such compounds as suitable solvatochromic probes.Experimental
Materials
Reagent grade chemicals obtained from commercial sources were used as received. Solvents were purified and dried according to standard methods. 9,10-Phenanthrenedione and tetrabutylammonium (TBA) salts of the anions were purchased from Sigma-Aldrich. 4′-(p-Methylphenyl)-2,2′:6′,2′′-terpyridine (tpy-PhCH3), 4′-(p–bromomethylphenyl)-2,2′:6′,2′′-terpyridine (tpy-PhCH2Br), 4′-(p-dibromomethylphen yl)-2,2′:6′,2′′-terpyridine (tpy-PhCHBr2), 4′-formyl-2,2′:6′,2′′-terpyridine (tpy-PhCHO), were synthesized according to the literature procedures.26a,41Synthesis of the receptor
2-(4-[2,2′:6′,2′′]Terpyridin-4′-yl-phenyl)-1H-phenanthro[9,10-d]imidazole (tpy-HImzphen)
4′-(p-Formylphenyl)-2,2′:6′,2′′-terpyridine (tpy-PhCHO) (337 mg, 1.00 mmol), 9,10-phenanthrenedione (230 mg, 1.10 mmol), and ammonium acetate (1.6 g, 20 mmol) were taken in acetic acid (30 mL) and the mixture was refluxed for 2 h with continuous stirring. On cooling to room temperature a pale yellow crystalline compound deposited. The resulting compound was collected by filtration and washed several times with water and then air dried. The compound was finally recrystallized from a chloroform–ethanol (1![[thin space (1/6-em)]](https://www.rsc.org/images/entities/char_2009.gif) :
:![[thin space (1/6-em)]](https://www.rsc.org/images/entities/char_2009.gif) 1) mixture and the desired compound was obtained as a light yellow crystalline solid (370 mg, 0.70 mmol, yield 70%), m. p. > 300 °C. 1H NMR (DMSO, 500 MHz): δ = 13.60 (s, 1H, NH(imidazole)), 8.86 (d, 2H, J = 8.5 Hz, H9), 8.82 (s, 2H, H3′), 8.79 (d, 2H, J = 4.0 Hz, H6), 8.69 (d, 2H, J = 8.0, H3), 8.60 (d, 2H, J = 8.0 Hz, H12), 8.53 (d, 2H, J = 8.0 Hz, H8), 8.20 (d, 2H, J = 8.5 Hz, H7), 8.05 (t, 2H, J = 7.5 Hz, H4), 7.75 (t, 2H, J = 7.5 Hz, H11), 7.65 (t, 2H, J = 7.7 Hz, H10), 7.54 (t, 2H, J = 6.0 Hz, H5). 13C NMR (DMSO, 300 MHz): δ = 156.2, 155.3, 149.7, 149.1, 148.7, 138.0, 131.5, 128.1, 127.9, 127.6, 127.4, 125.9, 125.0, 124.3, 122.4, 121.4, 118.2 ppm. ESI-MS: m/z 525.51 ([L+H]+). Anal. Calcd for C36H23N5: C, 82.26; H, 4.41; N, 13.32. Found: C, 82.18; H, 4.44; N, 13.29.
1) mixture and the desired compound was obtained as a light yellow crystalline solid (370 mg, 0.70 mmol, yield 70%), m. p. > 300 °C. 1H NMR (DMSO, 500 MHz): δ = 13.60 (s, 1H, NH(imidazole)), 8.86 (d, 2H, J = 8.5 Hz, H9), 8.82 (s, 2H, H3′), 8.79 (d, 2H, J = 4.0 Hz, H6), 8.69 (d, 2H, J = 8.0, H3), 8.60 (d, 2H, J = 8.0 Hz, H12), 8.53 (d, 2H, J = 8.0 Hz, H8), 8.20 (d, 2H, J = 8.5 Hz, H7), 8.05 (t, 2H, J = 7.5 Hz, H4), 7.75 (t, 2H, J = 7.5 Hz, H11), 7.65 (t, 2H, J = 7.7 Hz, H10), 7.54 (t, 2H, J = 6.0 Hz, H5). 13C NMR (DMSO, 300 MHz): δ = 156.2, 155.3, 149.7, 149.1, 148.7, 138.0, 131.5, 128.1, 127.9, 127.6, 127.4, 125.9, 125.0, 124.3, 122.4, 121.4, 118.2 ppm. ESI-MS: m/z 525.51 ([L+H]+). Anal. Calcd for C36H23N5: C, 82.26; H, 4.41; N, 13.32. Found: C, 82.18; H, 4.44; N, 13.29.
Synthesis of the Fe(II) complex, [Fe(tpy-HImzphen)2](ClO4)2
To a chloroform–methanol (1![[thin space (1/6-em)]](https://www.rsc.org/images/entities/char_2009.gif) :
:![[thin space (1/6-em)]](https://www.rsc.org/images/entities/char_2009.gif) 1) solution (30 mL) of the ligand (0.11 g, 0.21 mmol) was added a second methanol solution of Fe(ClO4)2·6H2O (0.36 g, 0.1 mmol). The colorless solution changed immediately to violet, and during stirring for ∼1 h a microcrystalline compound began to separate out. The compound was collected by filtration, washed with chloroform and dried under vacuum. It was finally recrystallized from acetonitrile–methanol (1
1) solution (30 mL) of the ligand (0.11 g, 0.21 mmol) was added a second methanol solution of Fe(ClO4)2·6H2O (0.36 g, 0.1 mmol). The colorless solution changed immediately to violet, and during stirring for ∼1 h a microcrystalline compound began to separate out. The compound was collected by filtration, washed with chloroform and dried under vacuum. It was finally recrystallized from acetonitrile–methanol (1![[thin space (1/6-em)]](https://www.rsc.org/images/entities/char_2009.gif) :
:![[thin space (1/6-em)]](https://www.rsc.org/images/entities/char_2009.gif) 1) and a dark violet crystalline compound was obtained: yield 0.105 g (80%). 1H NMR (DMSO, 500 MHz): δ = 13.75 (s, 2H, NH(imidazole)), 9.81 (s, 4H, H3′), 9.14 (d, 4H, J = 8.0 Hz, H6), 8.94 (d, 2H, J = 8.5 Hz, H9), 8.91 (d, 2H, J = 8.5 Hz, H9′), 8.83 (d, 4H, J = 8.5 Hz, H8), 8.75 (d, 4H, J = 8.5 Hz, H7), 8.70 (d, 2H, J = 8.5 Hz, H12), 8.65 (d, 2H, J = 8.0 Hz, H12′), 8.09 (t, 4H, J = 8.0 Hz, H4), 7.84 (t, 2H, J = 7.5 Hz, H11), 7.80 (t, 2H, J = 7.5 Hz, H11′), 7.74–7.69 (m, 4H(2H10+2 H10′)), 7.35 (d, 4H, J = 5.5 Hz, H3), 7.24 (t, 4H, J = 6.2 Hz, H5). 13C NMR (DMSO, 500 MHz): δ = 160.6, 158.5, 153.4, 148.8, 139.4, 138.0, 136.9, 132.8, 129.0, 128.8, 128.6, 128.4, 128.3, 127.9, 127.8, 127.5, 126.4, 126.1, 124.8, 124.5, 122.9, 122.8, 122.6, 121.6 ppm. Anal. Calcd for C72H46N10Cl2O8Fe: C, 66.21; H, 3.55; N, 10.72. Found: C, 66.16; H, 3.52; N, 10.74. ESI-MS (positive, CH3CN) m/z = 553.25 (100%) [Fe(tpy-HImzphen)2]2+.
1) and a dark violet crystalline compound was obtained: yield 0.105 g (80%). 1H NMR (DMSO, 500 MHz): δ = 13.75 (s, 2H, NH(imidazole)), 9.81 (s, 4H, H3′), 9.14 (d, 4H, J = 8.0 Hz, H6), 8.94 (d, 2H, J = 8.5 Hz, H9), 8.91 (d, 2H, J = 8.5 Hz, H9′), 8.83 (d, 4H, J = 8.5 Hz, H8), 8.75 (d, 4H, J = 8.5 Hz, H7), 8.70 (d, 2H, J = 8.5 Hz, H12), 8.65 (d, 2H, J = 8.0 Hz, H12′), 8.09 (t, 4H, J = 8.0 Hz, H4), 7.84 (t, 2H, J = 7.5 Hz, H11), 7.80 (t, 2H, J = 7.5 Hz, H11′), 7.74–7.69 (m, 4H(2H10+2 H10′)), 7.35 (d, 4H, J = 5.5 Hz, H3), 7.24 (t, 4H, J = 6.2 Hz, H5). 13C NMR (DMSO, 500 MHz): δ = 160.6, 158.5, 153.4, 148.8, 139.4, 138.0, 136.9, 132.8, 129.0, 128.8, 128.6, 128.4, 128.3, 127.9, 127.8, 127.5, 126.4, 126.1, 124.8, 124.5, 122.9, 122.8, 122.6, 121.6 ppm. Anal. Calcd for C72H46N10Cl2O8Fe: C, 66.21; H, 3.55; N, 10.72. Found: C, 66.16; H, 3.52; N, 10.74. ESI-MS (positive, CH3CN) m/z = 553.25 (100%) [Fe(tpy-HImzphen)2]2+.
Caution! Perchlorate salts of different metal and of the Fe(II) complex used in this study are potentially explosive and therefore should be handled in small quantities with care.
Physical measurements
Elemental (C, H, and N) analyses were performed on a Perkin–Elmer 2400II analyzer. Electrospray ionization mass spectra (ESI-MS) were obtained on a Micromass Qtof YA 263 mass spectrometer. 1H and {1H–1H} COSY spectra were obtained on a Bruker Avance DPX 300 and 500 MHz spectrometer using DMSO-d6 solutions.Electronic absorption spectra were obtained with a Shimadzu UV 1800 spectrophotometer at room temperature. The sensing studies of the receptor with different anions and cations were carried out in dimethyformamide–acetonitrile (1![[thin space (1/6-em)]](https://www.rsc.org/images/entities/char_2009.gif) :
:![[thin space (1/6-em)]](https://www.rsc.org/images/entities/char_2009.gif) 9) solution. For a typical titration experiment, 2 μL aliquots of a given cation or anion (4.0 × 10⁻³ M for cation and 2.5 × 10⁻² M for anion) were added to a 2.5 mL solution of the ligand (2.0 × 10⁻⁵ M in acetonitrile). TBA salts of different anions and hydrated perchlorate salts of the metals were used for titration experiments. The equilibrium constants were evaluated from the absorbance data using eqn (1)42
9) solution. For a typical titration experiment, 2 μL aliquots of a given cation or anion (4.0 × 10⁻³ M for cation and 2.5 × 10⁻² M for anion) were added to a 2.5 mL solution of the ligand (2.0 × 10⁻⁵ M in acetonitrile). TBA salts of different anions and hydrated perchlorate salts of the metals were used for titration experiments. The equilibrium constants were evaluated from the absorbance data using eqn (1)42
| Aobs = (A0 + A∞K[G]T)/(1+ K[G]T) | (1) |
Steady state emission spectra were recorded on Perkin-Elmer LS55 fluorescence spectrophotometer. Emission titrations were carried out with the same sets of solutions as were made with spectrophotometry. Quantum yields were determined by a relative method using quinine sulfate as the standard.43 Time-correlated single-photon-counting (TCSPC) measurements were carried out for the luminescence decay of the ligand and its Zn(II) complex in different solvents at room temperature. For TCSPC measurement, the photo-excitation was made at 300 nm for the free receptor and at 370 nm for the Zn(II) complexes using a picosecond diode laser (IBH Nanoled–07) in an IBH Fluorocube apparatus. Time-resolved fluorescence decays of the receptor were also recorded as a function of F− and Zn2+ in chloroform and the emission at 475 nm and 600 nm were monitored as a function of time. The fluorescence decay data were collected on a Hamamatsu MCP photomultiplier (R3809) and were analyzed by using IBH DAS6 software.
Experimental uncertainties were as follows: absorption maxima, ±2 nm; molar absorption coefficients, 10%; emission maxima, ±5 nm; excited–state lifetimes, 10%; luminescence quantum yields, 20%.
X-Ray crystal structure determination
Single crystal of the receptor was obtained by diffusing hexane to its acetone-dichloromethane (2![[thin space (1/6-em)]](https://www.rsc.org/images/entities/char_2009.gif) :
:![[thin space (1/6-em)]](https://www.rsc.org/images/entities/char_2009.gif) 1) solution. X-Ray diffraction data for the crystal mounted on a glass fiber and coated with perfluoropolyether oil were collected on a Bruker-AXS SMART APEX II diffractometer at room temperature equipped with CCD detector using graphite-monochromated Mo Kα radiation (λ = 0.71073 Å). Crystallographic data and details of structure determination are summarized in Table 2. The data were processed with SAINT44 and absorption corrections were made with SADABS.44 The structure was solved by direct and Fourier methods and refined by full-matrix least-square based on F2 using the WINGX software which utilizes SHELX-97.45 For structure solution and refinement the SHELXTL software package46 was used. The nonhydrogen atoms were refined anisotropically, while the hydrogen atoms were placed with fixed thermal parameters at idealized positions. The electron density map showed the presence of some unassignable peaks, which were removed by running the program SQUEEZE.47 The final least-squares refinement (I > 200σ(I)) converged to reasonably good R values (Table 2).
1) solution. X-Ray diffraction data for the crystal mounted on a glass fiber and coated with perfluoropolyether oil were collected on a Bruker-AXS SMART APEX II diffractometer at room temperature equipped with CCD detector using graphite-monochromated Mo Kα radiation (λ = 0.71073 Å). Crystallographic data and details of structure determination are summarized in Table 2. The data were processed with SAINT44 and absorption corrections were made with SADABS.44 The structure was solved by direct and Fourier methods and refined by full-matrix least-square based on F2 using the WINGX software which utilizes SHELX-97.45 For structure solution and refinement the SHELXTL software package46 was used. The nonhydrogen atoms were refined anisotropically, while the hydrogen atoms were placed with fixed thermal parameters at idealized positions. The electron density map showed the presence of some unassignable peaks, which were removed by running the program SQUEEZE.47 The final least-squares refinement (I > 200σ(I)) converged to reasonably good R values (Table 2).
| Compound | tpy-HImzphen |
|---|---|
| a R1(F) = [Σ || F0 | − |FC ||/Σ | F0]. b wR2 (F2) = [Σ w(F02 − FC2)2/Σ w(F02)2]1/2. | |
| Formula | C39H29N5O |
| fw | 583.67 |
| T/K | 273(2) |
| Cryst syst | Monoclinic |
| Space group | Cc |
| a/Å | 9.7301(9) |
| b/Å | 54.938(5) |
| c/Å | 5.4824(5) |
| α (°) | 90 |
| β (°) | 92.879(6) |
| γ (°) | 90 |
| V/Å3 | 2927.0(5) |
| Dc(g cm−3) | 1.325 |
| Z | 4 |
| μ/mm−1 | 0.082 |
| F(000) | 1224 |
| θ range (deg) | 1.48–24.31 |
| data/restraints/params | 4600/2/408 |
| GOF on F2 | 0.897 |
| R 1 [I > 2σ(I)] | 0.0428 |
| wR2 (all data) | 0.1115 |
| Δρmax/Δρmin (e Å) | 0.122/−0.120 |
CCDC reference number: 831540
Acknowledgements
Financial assistance received from the Department of Science and Technology, New Delhi [Grant No. SR/S1/IC-33/2010] and the Council of Scientific and Industrial Research, New Delhi, India [Grant No. 01(2084)/06/EMR-II], is gratefully acknowledged. Thanks are due to the DST for providing single crystal X-ray difractometer in FIST and Time-Resolved Nanosecond Spectrofluorimeter in PURSE programme at Department of Chemistry of Jadavpur University. C.B., D.M and S.D. thank CSIR for their fellowship.References
- (a) J.-M. Lehn, Supramolecular Chemistry, Concepts and Perspective, VCH, Weinheim, Germany, 1995 Search PubMed; (b) V. Balzani, A. Juris and M. Venturi, Chem. Rev., 1996, 96, 759 CrossRef CAS; (c) A. P. de Silva, H. Q. N. Gunaratne, T. Gunnlaugsson, A. J. M. Huxley, C. P. McCoy, J. T. Rademacher and T. E. Rice, Chem. Rev., 1997, 97, 1515 CrossRef CAS.
- (a) J. L Sessler, P. A. Gale and W. S. Cho, Anion Receptor Chemistry., Royal Society of Chemistry,Cambridge, U.K., 2006 Search PubMed; (b) Supramolecular Chemistry of Anions, ed. A. Bianchi, K. Bowman-James and E. Garcia-Espańa, Wiley-VCH, New York, 1997; (c) K. Bowman-James, Acc. Chem. Res., 2005, 38, 671 CrossRef CAS.
- T. Schraderr and A. D. HamiltonFunctional Synthetic Receptors, Wiley-VCH, Weinheim, Germany, 2005 Search PubMed.
- (a) I. Bertini, H. B. Gray, S.J. Lippard and J. S. Valentine, Bioinorganic Chemistry Ed, University Science Book, Mill Valley, CA, 1994 Search PubMed; (b) E. M. Nolan and S. J. Lippard, Chem. Rev., 2008, 108, 3443 CrossRef CAS.
- F. A. Cotton and G. Wilkinson, Advanced Inorganic Chemistry 5th Ed. Wiley-Interscience Publication, John-Wiley & Sons, 1988 Search PubMed.
- N. N. Greenwood and A. Earnshaw, Chemistry of Elements, Maxwell Macmillan International Edn, 1989 Search PubMed.
- (a) A. Czarnik, Fluorescent Chemosensors for Ion and Molecule Recognition, W. Ed. American Chemical Society, Washington, D. C, 1992 Search PubMed; (b) D. W. Domaille, E. L. Que and C. J. Chang, Nat. Chem. Biol., 2008, 4, 168 CrossRef CAS; (c) H. M. Kim and B. R. Cho, Acc. Chem. Res., 2009, 42, 863 CrossRef CAS; (d) Z. Xu, J. Yoon and D. R. Spring, Chem. Soc. Rev., 2010, 39, 1996 RSC; (e) A. P. de Silva, D. B. Fox and A. J. M. Huxley, Coord. Chem. Rev., 2000, 205, 41 CrossRef CAS; (f) P. Jiang and Z. Guo, Coord. Chem. Rev., 2004, 248, 205 CrossRef CAS.
- Z. Yang, C. Yan, Y. Chen, C. Zhu, C. Zhang, W. Y. Dong, Z. Guo, Y. Lu and W. He, Dalton Trans., 2011, 40, 2173 RSC.
- (a) C. Caltagirone and P. A. Gale, Chem. Soc. Rev., 2009, 38, 520 RSC; (b) P. D. Beer, Chem. Commun., 1996, 689 RSC; (c) P. D. Beer and P. A. Gale, Angew. Chem., Int. Ed., 2001, 40, 486 CrossRef CAS; (d) P. A. Gale, Coord. Chem. Rev., 2006, 250, 2917 CrossRef CAS; (e) J. L. Sessler and J. M. Davis, Acc. Chem. Res., 2001, 34, 989 CrossRef CAS.
- (a) R. Martínez-Máñez and F. Sancenón, Chem. Rev., 2003, 103, 4419 CrossRef; (b) P. D. Beer, Coord. Chem. Rev., 2000, 205, 131 CrossRef CAS; (c) S.-S. Sun and A. J. Lees, Coord. Chem. Rev., 2002, 230, 171 CrossRef CAS; (d) C. Suksai and T. Tuntulani, Top. Curr. Chem., 2005, 255, 163 CAS; (e) C. Suksai and T. Tuntulani, Chem. Soc. Rev., 2003, 32, 192 RSC.
- (a) V. Amendola, E. D. Gómez, L. Fabbrizzi and M. Licchelli, Acc. Chem. Res., 2006, 39, 343 CrossRef CAS; (b) J. Peŕez and L. Riera, Chem. Commun., 2008, 533 Search PubMed; (c) J. Peŕez and L. Riera, Chem. Soc. Rev., 2008, 37, 2658 RSC; (d) J. W. Steed, Chem. Soc. Rev., 2009, 38, 506 RSC; (e) J. W. Steed, Chem. Soc. Rev., 2009, 38, 506 RSC.
- (a) C. M. G. dos Santos, A. J. Harte, S. T. Quinn and T. Gunnalaugsson, Coord. Chem. Rev., 2008, 252, 2512 CrossRef CAS; (b) J. P. Leonard, C. B. Nolan, F. Stomeo and T. Gunnlaugsson, Top. Curr. Chem., 2007, 281, 1 CrossRef CAS.
- (a) X. He and V. W. W. Yam, Org. Lett., 2011, 13, 2172 CrossRef CAS; (b) X. He and V. W. W. Yam, Inorg. Chem., 2010, 49, 2273 CrossRef CAS; (c) S-T. Lam, N. Zhu and V. W. W. Yam, Inorg. Chem., 2009, 48, 9664 CrossRef CAS; (d) M. J. Li, B. W. K. Chu and V. W. W. Yam, Chem.–Eur. J., 2006, 12, 3528 CrossRef CAS.
- (a) M. T. Reetz, C. M. Niemeyer and K. Harms, Angew. Chem., Int. Ed. Engl., 1991, 30, 1474 CrossRef; (b) J. C. Fettinger and J. T. Davis, Angew. Chem., Int. Ed., 2001, 40, 2827 CrossRef; (c) G. Domenico, G. Giuseppe, N. Anna, P. Andrea, P. Sebastiano, F. P. Melchiorre, P. Marta and P. Ilenia, Angew. Chem., Int. Ed., 2005, 44, 4892 CrossRef; (d) M. Cametti, M. Nissinen, A. Dalla Cort, L. Mandolini and K. Rissanen, J. Am. Chem. Soc., 2007, 129, 3641 CrossRef CAS.
- (a) J. M. Mahoney, K. A. Stucker, H. Jiang, I. Carmichael, N. R. Brinkmann, A. M. Beatty, B. C. Noll and B. D. Smith, J. Am. Chem. Soc., 2005, 127, 2922 CrossRef CAS; (b) J. M. Mahoney, A. M. Beatty and B. D. Smith, Inorg. Chem., 2004, 43, 7617 CrossRef CAS.
- (a) M. P. Wintergerst, T. G. Levitskaia, B. A. Moyer, J. L. Sessler and L. H. Delmau, J. Am. Chem. Soc., 2008, 130, 4129 CrossRef CAS; (b) J. L. Sessler, S. K. Kim, D. E. Gross, C.-H. Lee, J. S. Kim and V. M. Lynch, J. Am. Chem. Soc., 2008, 130, 13162 CrossRef CAS.
- (a) K. Niikura and E. V. Anslyn, J. Org. Chem., 2003, 68, 10156 CrossRef CAS; (b) S. L. Tobey and E. V. Anslyn, J. Am. Chem. Soc., 2003, 125, 10963 CrossRef CAS.
- (a) M. D. Lankshear, I. M. Dudley, K.-M. Chan and P. D. Beer, New J. Chem., 2007, 31, 684 RSC; (b) M. D. Lankshear, I. M. Dudley, K.-M. Chan, A. R. Cowley, S. M. Santos, V. Felix and P. D. Beer, Chem.–Eur. J., 2008, 14, 2248 CrossRef CAS.
- (a) T. Ghosh, B. G. Maiya and A. Samanta, Dalton Trans., 2006, 795 RSC; (b) T. Ábalos, D. Jiménez, M. Moragues, S. Royo, R. Martínez-Máñez, F. Sancenón, J. Soto, A. M. Costero, M. Parra and S. Gil, Dalton Trans., 2010, 39, 3449 RSC.
- (a) J. S. Kim and D. T. Quang, Chem. Rev., 2007, 107, 3780 CrossRef CAS; (b) J. Y. Lee, S. K. Kim, J. H. Jung and J. S. Kim, J. Org. Chem., 2005, 70, 1463 CrossRef CAS; (c) J. L. Sessler, S. K. Kim, D. E. Gross, C-H. Lee, J. S. Kim and V. M. Lynch, J. Am. Chem. Soc., 2008, 130, 13162 CrossRef CAS.
- (a) S. C. Burdette and S. J. Lippard, Coord. Chem. Rev., 2000, 216–217, 333 Search PubMed; (b) D. Buccella, J. A. Horowitz and S. J. Lippard, J. Am. Chem. Soc., 2011, 133, 4101 CrossRef CAS; (c) L. E. McQuade and S. J. Lippard, Inorg. Chem., 2010, 49, 7464 CrossRef CAS; (d) Y. You, E. Tomat, K. Hwang, T. Atanasijevic, W. Nam, A. P. Jasanoff and S. J. Lippard, Chem. Commun., 2010, 46, 4139 RSC.
- (a) V. Amendola, L. Fabbrizzi and L. Mosca, Chem. Soc. Rev., 2010, 39, 3889 RSC; (b) V. Amendola, M. Boiocchi, B. Colasson, L. Fabbrizzi, E. M. Monzani, J. Douton-Rodriguez and C. Spadini, Inorg. Chem., 2008, 47, 4808 CrossRef CAS; (c) V. Amendola and L. Fabbrizzi, Chem. Commun., 2009, 513 RSC.
- (a) E. Arturoni, C. Bazzicalupi, A. Bencini, C. Caltagirone, A. Danesi, A. Garau, C. Giorgi, V. Lippolis and B. Valtancoli, Inorg. Chem., 2008, 47, 6551 CrossRef CAS; (b) M. Mameli, V. Lippolis, C. Caltagirone, J. Capelo, O. N. Faza and C. Lodeiro, Inorg. Chem., 2010, 49, 8276 CrossRef CAS.
- (a) G. Ambrosi, M. Formica, V. Fusi, L. Giorgi, A. Guerri, E. Macedi, M. Micheloni, P. Paoli, R. Pontellini and P. Rossi, Inorg. Chem., 2009, 48, 5901 CrossRef CAS; (b) G. Ambrosi, M. Formica, V. Fusi, L. Giorgi, A. Guerri, E. Macedi, M. Micheloni, P. Paoli, R. Pontellini and P. Rossi, Inorg. Chem., 2009, 48, 5901 CrossRef CAS.
- (a) M. Alfonso, A. Espinosa, A. Tárraga and P. Molina, Org. Lett., 2011, 13, 2078 CrossRef CAS; (b) M. Alfonso, A. Tárraga and P. Molina, J. Org. Chem., 2011, 76, 939 CrossRef CAS; (c) F. Zapata, A. Caballero, A. Espinosa, A. Tárraga and P. Molina, Org. Lett., 2008, 10, 41 CrossRef CAS; (d) F. Zapata, A. Caballero, A. Espinosa, A. Tárraga and P. Molina, J. Org. Chem., 2009, 74, 4787 CrossRef CAS.
- (a) C. Bhaumik, S. Das, D. Saha, S. Dutta and S. Baitalik, Inorg. Chem., 2010, 49, 5049 CrossRef CAS; (b) D. Saha, S. Das, D. Maity, S. Dutta and S. Baitalik, Inorg. Chem., 2011, 50, 46 CrossRef CAS; (c) S. Das, D. Saha, C. Bhaumik, S. Dutta and S. Baitalik, Dalton Trans., 2010, 39, 4162 RSC; (d) C. Bhaumik, S. Das, D. Maity and S. Baitalik, Dalton Trans., 2011, 40, 11795 RSC.
- (a) H. Xue, X.-J. Tang, L.-Z. Wu, L.-P. Zhang and C.-H. Tung, J. Org. Chem., 2005, 70, 9727 CrossRef CAS; (b) D. Remeter, P. Blanchard, M. Allain, I. Grosu and J. Roncali, J. Org. Chem., 2007, 72, 5285 CrossRef.
- (a) M. A. R. Meier and U. S. Schubert, Chem. Commun., 2005, 4610 RSC; (b) B. G. G. Lohmeijer and U. S. Schubert, Macromol. Chem. Phys., 2003, 204, 1072 CrossRef CAS; (c) R. Dobrawa, M. Lysetska, P. Ballester, M. Grüne and F. Würthner, Macromolecules, 2005, 38, 1315 CrossRef CAS; (d) U. S. Schubert and C. Eschbaumer, Angew. Chem., Int. Ed., 2002, 41, 2892 CrossRef CAS.
- (a) E. Baranoff, J. P. Collin, L. Flamigni and J.-P. Sauvage, Chem. Soc. Rev., 2004, 33, 147 RSC; (b) E. C. Constable, Chem. Soc. Rev., 2004, 33, 246 RSC; (c) H. Hofmeier and U. S. Schubert, Chem. Soc. Rev., 2004, 33, 373 RSC; (d) E. A. Medlycott and G. S. Hanan, Coord. Chem. Rev., 2006, 250, 1763 CrossRef CAS; (e) X. Wang, A. Del Guerzo, S. Baitalik, G. Simon, G. B. Shaw, L. X. Chen and R. H. Schmehl, Photosynth. Res., 2006, 87, 83 CrossRef CAS.
- (a) W. Goodall and J. A. G. Williams, Chem. Commun., 2001, 2514 RSC; (b) M. Licini and J. A. G. Williams, Chem. Commun., 1999, 1943 RSC; (c) W. Goodall and J. A. G. Williams, J. Chem. Soc., Dalton Trans., 2000, 2893 RSC.
- (a) F. Barigelletti, L. Flamigni, M. Guardigli, J.-P. Sauvage, J.-P. Collin and A. Sour, Chem. Commun., 1996, 1329 RSC; (b) F. Barigelletti, L. Flamigni, G. Calogero, L. Hammarström, J.-P. Sauvage and J.-P. Collin, Chem. Commun., 1996, 2334 Search PubMed.
- (a) P. P. Laine, F. Bedioui, F. Loiseau, C. Chiorboli and S. Campagna, J. Am. Chem. Soc., 2006, 128, 7510 CrossRef CAS; (b) F. S. Han, M. Higuchi and D. G. Kurth, Org. Lett., 2007, 9, 559 CrossRef CAS; (c) S. Leroy, S. Soujanya and F. Fages, Tetrahedron Lett., 2001, 42, 1665 CrossRef CAS; (d) G. Albano, V. Balzani, E. C. Constable, M. Maestri and D. Smith, Inorg. Chim. Acta, 1998, 277, 225 CrossRef CAS; (e) D. Roberto, F. Tessore, R. Ugo, S. Bruni, A. Manfredi and S. Quici, Chem. Commun., 2002, 846 RSC.
- X-Y. Wang, A. D. Guerzo and R. H. Schmehl, Chem. Commun., 2002, 2344 RSC.
- (a) Z. R. Grabowski and K. Rotkiewicz, Chem. Rev., 2003, 103, 3899 CrossRef; (b) R. M. Hermant, N. A. Bakker, T. Scherer, B. Krijnen and J. W. Verhoeven, J. Am. Chem. Soc., 1990, 112, 1214 CrossRef CAS; (c) C. Reichardt, Chem. Rev., 1994, 94, 2319 CrossRef CAS.
- (a) J. R. Winker and N. Sutin, Inorg. Chem., 1987, 26, 220 CrossRef; (b) C. Creutz, M. Chou, T. L. Netzel, M. Okumura and N. Sutin, J. Am. Chem. Soc., 1980, 102, 1309 CrossRef CAS; (c) S. Baitalik, X. Wang and R. H. Schmehl, J. Am. Chem. Soc., 2004, 126, 16304 CrossRef CAS.
- (a) V. Balzani, N. Sabbatini and F. Scandola, Chem. Rev., 1986, 86, 319 CrossRef CAS; (b) S. O. Kang, D. Powell, V. W. Day and K. Bowman-James, Angew. Chem., Int. Ed., 2006, 45, 7882 CrossRef CAS; (c) C. M. G. dos Santos and T. Gunnlaugsson, Dalton Trans., 2009, 4712 RSC; (d) D. E. Gomez, L. Fabbrizzi and M. Liccheli, J. Org. Chem., 2005, 70, 5717 CrossRef; (e) V. Amendola, D. Boiocchi, B. Colasson and L. Fabbrizzi, Inorg. Chem., 2006, 45, 6138 CrossRef CAS; (f) T-P. Lin, C.-Y. Chen, Y.-S. Wen and S.-S. Sun, Inorg. Chem., 2007, 46, 9201 CrossRef CAS.
- M. Shortreed, R. Kopelman, M. Kuhn and B. Hoyland, Anal. Chem., 1996, 68, 1414 CrossRef CAS.
- (a) Y. Ding, Y. Xie, X. Li, J. P. Hill, W. Zhang and W. Zhu, Chem. Commun., 2011, 47, 5431 RSC; (b) Q. G. Wang, Y. S. Xie, Y. B. Ding, X. Li and W. H. Zhu, Chem. Commun., 2010, 46, 3669 RSC.
- C. S. Wilcox Frontiers in Supramolecular Chemistry and Photochemistry, VCH, Weinheim, Germany, 1991. 123–143 Search PubMed.
- (a) R. Shukla, T. Kida and B. D. Smith, Org. Lett., 2000, 2, 3099 CrossRef CAS; (b) G. Tumcharern, T. Tuntulani, S. J. Coles, M. B. Hursthouse and J. D. Kilburn, Org. Lett., 2003, 5, 4971 CrossRef CAS.
- (a) K. T. Pott, D.A. Usifer and H. D. Abruna, J. Am. Chem. Soc., 1987, 109, 3961 CrossRef; (b) F. H. Case and T. J. Kaspen, J. Am. Chem. Soc., 1956, 78, 5842 CrossRef CAS; (c) W. Spahni and G. Helv. Calzaferri, Helv. Chim. Acta, 1984, 67, 450 CrossRef CAS; (d) E. C. Constable, M. D. Ward and S. Corr, Inorg. Chim. Acta, 1988, 141, 201 CrossRef CAS.
- H.-J. Schneider and A. Yatsimirsky, Principles and Methods in Supramolecular Chemistry; John Wiley and Sons, London, 2000, p. 142 Search PubMed.
- (a) K. Bull. Nakamaru, Bull. Chem. Soc. Jpn., 1982, 55, 1639 CrossRef CAS and references therein; (b) J. N. Demas and G. A. Crosby, J. Am. Chem. Soc., 1971, 93, 2841 CrossRef.
- SAINT (version 6.02)SADABS (version 2.03), Bruker AXS Inc., Madison, WI, 2002.
- G. M. Sheldrick, SHELXL-97, Program for the Refinement of crystal Structures, University of Göttingen, Göttingen, Germany, 1997 Search PubMed.
- SHELXTL (version 6.10), Bruker AXS Inc., Madison, WI, 2002.
- A. L. Spek, J. Appl. Crystallogr., 2003, 36, 7 CrossRef CAS.
Footnote |
| † Electronic Supplementary Information (ESI) available: Fig. S1–S25, Table S1-S3 and X-ray crystallographic file in CIF format for the receptor tpy-HImzphen. CCDC reference number: 831540. For ESI and crystallographic data in CIF or other electronic format see DOI: 10.1040/c2ra00023g/ |
| This journal is © The Royal Society of Chemistry 2012 |

