Gd2O2S:Yb,Er submicrospheres with multicolor upconversion fluorescence
Yanhua
Song
ab,
Yeju
Huang
ab,
Lihui
Zhang
ab,
Yuhua
Zheng
ab,
Ning
Guo
ab and
Hongpeng
You
*a
aState key Laboratory of Rare Earth Resource Utilization, Changchun Institute of Applied Chemistry, Chinese Academy of Sciences, 130022, P.R. China. E-mail: hpyou@ciac.jl.cn
bGraduate University of the Chinese Academy of Sciences, Beijing 100049, P.R. China
First published on 16th April 2012
Abstract
Monodisperse hexagonal-phase Gd2O2S:Yb3+,Er3+ submicrospheres have been successfully prepared for the first time by means of a solvothermal method. The SEM and TEM results show that the spherical size is between 210–300 nm and the submicrospheres are of polycrystalline nature. Under the excitation of 980 nm, the bright green emission of the Gd2O2S:Er3+ at about 524 and 548 nm are assigned to the 2H11/2→4I15/2 and 4S3/2→4I15/2 transitions of the Er3+ ions, respectively. The incorporation of Yb3+ ions into the Gd2O2S:Er3+ leads to the decrease in the intensity ratio of the green luminescence to the red luminescence. The corresponding emission color can be tuned from green to yellow by varying the Yb3+ concentration. The analysis reveals that the two-photon absorption is mainly responsible for the upconversion luminescence in Gd2O2S:Yb3+,Er3+ submicrospheres.
1. Introduction
Since its discovery in the 1960s, upconversion (UC) materials containing rare earth ions have been the focus of much research.1 Along with the progress of science and nanotechnology, UC nanocrystals have received much attention owing to their wide potential applications in such fields as infrared detection, molecule recognition, three-dimensional displays, and especially luminescent probes in biological labeling and imaging technology.2 Up to now, various upconversion materials have been developed and studied, most of the work is focused on the investigation of halides, glass, and oxides.3 It is well-known that host materials with low phonon energies (ħω) show high upconversion luminescence efficiency by suppressing the nonradiative multiphonon relaxation. Usually, ħωfluoride< ħωsulfide < ħωoxide, so most efficient upconversion luminescence has been realized in fluoride hosts. Many micro-/nano scale fluorides upconversion materials have been reported, such as, NaYF4:Yb3+,Er3+,4 BaYF5:Yb3+,Er3+(Tm3+),5 and LaF3:Yb3+,Er3+(Tm3+,Ho3+).6 However, these materials usually present poor mechanical properties, moisture sensitivity, and non-eco-friendly. Most of the oxides are chemical stabile and nontoxic, are also widely reported as candidates of upconversion materials,7 but they show low upconversion luminescence efficiency. Rare-earth oxysulfides possess favorable chemical durability, and they are eco-friendly and nontoxic. Yocom et al.8 demonstrated that Y2O2S:Yb3+,Er3+ exhibited 82% lighter output to that of fluoride. Liu et al.9 reported the anomalous thermalization effect in Er3+ doped Y2O2S. So rare-earth oxysulfides may be candidates for upconversion materials.The trivalent rare-earth (RE) ions, such as Er3+, Tm3+, Ho3+, Nd3+, Yb3+, and Pr3+, are suitable candidates for UC processes due to their abundant energy levels and narrow emission spectral lines. Especially the introduction of Yb3+ ions as a sensitizing center with a pumping wavelength of around 1 μm, for which high-power sources are commercially available, has allowed a large enhancement of the UC luminescence of the activators Tm3+, Er3+, and Ho3+.10
Gd2O2S nanocrystals doped with RE3+ ions have particularly attracted considerable interest in terms of high chemical durability and thermal stability. A number of different techniques have been developed to synthesize nanocrystals, such as the thermal decomposition method and conversion of the Gd(OH)3 method.11 So far, the investigations for RE3+-doped Gd2O2S nanocrystals have mostly concentrated on downconversion luminescence such as Eu3+- and Tb3+-doped Gd2O2S nanocrystals. But little is reported on the upconversion luminescence of Gd2O2S nanocrystals. On the other hand, it is well-known that the oxysulfides have low phonon energies, low symmetry, favorable chemical stability and nontoxicity.12 Thus, Gd2O2S is an ideal host for the design of upconverting phosphors. In 2004, Hirai and Orikoshi13 reported upconverting phosphor Gd2O2S:Yb,Er particles synthesized by an emulsion liquid membrane method. Under 980 nm laser excitation, Gd2O2S:Yb,Er particles exhibited green emission. In 2007, Hu et al.14 reported an upconversion afterglow phenomenon of Er3+ in Gd1.93O2S:0.01Er,0.03Yb,0.02Ti,0.01Mg phosphor. In addition, with the codoping of Ti4+ and Mg2+ ions, the unusual phosphorescence was improved. Although the upconversion emission for Gd2O2S:Yb,Er has been reported, the effect of Yb3+ concentration on the upconversion properties has not been discussed in detail. In this paper, we report the preparation and UCL properties of Gd2O2S:Yb3+/Er3+ monodisperse submicrospheres, especially the influence of Yb3+ codoping on UCL process of Er3+ ions.
2. Experimental section
2.1 Materials
The initial chemicals, including Gd2O3, Yb2O3, and Er2O3 (all with purity = 99.99%, Shanghai Yuelong Non-Ferrous Metals Limited., China), HNO3, ethylene glycol, poly(vinyl pyrrodlidone) (PVP K30, M = 40![[thin space (1/6-em)]](https://www.rsc.org/images/entities/char_2009.gif) 000), thiourea, and ethanol (all with purity of A.R., Beijing Fine Chemical Company, China), were used without further purification. Rare-earth nitrate stock solutions were prepared by dissolving the corresponding metal oxide in nitric acid at elevated temperatures.
000), thiourea, and ethanol (all with purity of A.R., Beijing Fine Chemical Company, China), were used without further purification. Rare-earth nitrate stock solutions were prepared by dissolving the corresponding metal oxide in nitric acid at elevated temperatures.
2.2 Preparation
In a typical procedure, appropriate amounts of Gd(NO3)3 (1 M), Yb(NO3)3 (0.5 M), and Er(NO3)3 (0.05 M) were added into 25 mL of ethylene glycol. 2.0 g PVP was added into the above solution. After vigorous stirring for 10 min, the PVP was dissolved thoroughly. Then 10 mL of ethanol solution containing 0.11 g thiourea was added dropwise into the above solution. The as-obtained solution was stirred for another 30 min. The resulting transparent feedstock was transferred to a 50 mL Teflon-lined stainless autoclave and heated at 200 °C for 24 h. After naturally cooling to room-temperature, the precursors were separated by filtration, washed with ethanol and deionized water several times, and dried in atmosphere at 60 °C over night. The final products were obtained through a heat treatment at 700 °C for 2 h under N2/S atmosphere.2.3 Characterization
Powder X-ray diffraction (XRD) measurements were performed on a Bruker D8 focus X-ray powder diffractometer with Cu-Kα radiation (λ = 0.15405 nm). The size and morphology of the samples were inspected using field emission scanning electron microscopy (FE-SEM, S-4800, Hitachi, Japan). The transmission electron microscopy (TEM) and selected area electron diffraction (SAED) patterns were obtained by a JEOL-2010 transmission electron microscope at an accelerating voltage of 200 kV. The UC emission spectra were obtained by using a 980 nm laser diode Module (K98D08M-30W, China) as the excitation source and detected by an R955 instrument (hamamatsu) from 400 to 900 nm. All the measurements were performed at room temperature.3. Results and discussion
3.1 Structure and morphology
Fig. 1 shows the XRD patterns of the precursor and Gd2O2S:Yb,Er submicrospheres. There are two broad peaks near 2θ = 28.55° and 47.26° for the precursor, indicating that the precursor is composed of amorphous gadolinium compound. After being annealed at 700 °C for 2 h in N2/S atmosphere, all diffraction peaks can be readily indexed to the pure hexagonal phase of Gd2O2S (space group: P3m1(164)) according to the JCPDS file no. 26-1422. No additional peaks of other phases have been found, indicating that the Yb3+ and Er3+ ions are effectively built into the host lattice.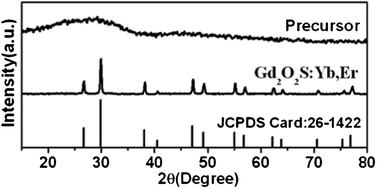 | ||
| Fig. 1 XRD patterns of the precursor and Gd2O2S:Yb,Er submicrospheres. | ||
SEM and TEM are used to characterize the morphology and crystal structure of the products. Fig. 2(a) and (b) show typical SEM images of the precursor and the final product. The precursors consist of homogeneous and monodisperse spheres with diameters 240–330 nm. After being annealed at 700 °C, the obtained Gd2O2S:1%Er3+ inherits the spherical shape from the precursor. But their average diameter is reduced to 210–300 nm because of the decomposition of the precursor. A typical TEM image and selected area electron diffraction (SAED) pattern for the Gd2O2S:1%Er3+ (Fig. 2(c) and 2(d)) clearly confirm that the diameter of the Gd2O2S:1%Er3+ submicrospheres is about 210–300 nm and the spheres actually further consist of small grains, consistent with the value shown in the SEM images. The SAED image contains partial ring and dot patterns, indicating that the Gd2O2S:1%Er3+ submicrospheres are of polycrystalline nature.
 | ||
| Fig. 2 SEM micrographs of well-dispersed precursor (a) and Gd2O2S:1%Er submicrospheres (b). TEM micrograph (c) and SAED pattern (d) of Gd2O2S:1%Er submicrospheres. | ||
3.2 Upconversion luminescence properties
Fig. 3 shows the room-temperature upconversion fluorescence spectra of the Gd2O2S:Yb3+,Er3+ submicrospheres with different contents of Yb3+ ions. Under 980 nm NIR excitation, the Gd2O2S:1%Er3+ exhibits bright green emission. Two primary bands at about 524 and 548 nm are assigned to the 2H11/2 → 4I15/2 and 4S3/2 → 4I15/2 transitions of the Er3+ ions, respectively. A weak band at about 671 nm is ascribed to the 4F9/2 → 4I15/2 transition of the Er3+ ions.15,16 However, the green emission of the Gd2O2S:1%Er3+ submicrospheres changes greatly when Yb3+ ions were doped into Gd2O2S:1%Er3+. As can be seen from Fig. 3, the Gd2O2S:20%Yb3+,1%Er3+ submicrospheres show mainly red emission at about 671 nm and weak green emissions at about 524 and 548 nm of the Er3+ ions, which can be assigned to the transitions of 4F9/2→4I15/2, 2H11/2→4I15/2, and 4S3/2→4I15/2, respectively. The 410 nm emission (2H9/2→4I15/2) is also measured, but the intensity is much weaker than that of green and red luminescence, as shown in the inset of Fig. 3. The concentration dependence upconversion spectra of Gd2O2S:xYb,1%Er are investigated and shown in Fig. 3. With the increase of Yb3+ concentration from 0 to 20 mol%, the green emission intensity decreases remarkably while the red emission intensity increases. Thus, it is possible to tune the emission color of the Gd2O2S:Yb3+,Er3+ submicrospheres by varying the Yb3+ concentration. The Commission Internationale de L'Eclairage (CIE) chromaticity coordinates for Gd2O2S:xYb3+,1%Er3+ are represented in Fig. 4. With increasing Yb3+ content, the emission color changes gradually from green to yellow. | ||
| Fig. 3 Room-temperature upconversion fluorescence spectra of the Gd2O2S:Yb,Er with different content of Yb3+ ions. | ||
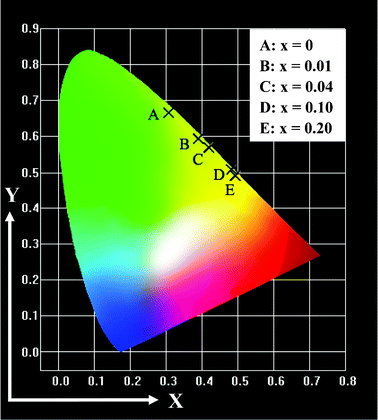 | ||
| Fig. 4 CIE chromaticity diagram for Gd2O2S:xYb3+,1%Er3+ submicrospheres excited at 980 nm. A: (0.308, 0.666); B: (0.389, 0.596); C: (0.417, 0.569); D: (0.483, 0.507); and E: (0.496, 0.490). | ||
It is well known that the UPL intensity (IUPL) is proportional to some power n of the incident excitation power (IP) according to IUPL∝Inp, where superscript n represents the number of pump photons required to populate the emitting states. The number of pumping photons (n) can be determined from the slope of the photoluminescence intensity versus the laser excitation power in a log–log plot.17 These plots are shown in Fig. 5 for the Gd2O2S:10%Yb3+,1%Er3+ submicrospheres. The n values of Gd2O2S:10%Yb3+,1%Er3+ are calculated to be 2.25 and 2.26 for the green and red emissions, respectively. The results show that two-photon process is mainly responsible for green and red upconversion for Gd2O2S:10%Yb3+,1%Er3+ sample. The similar phenomenon was also observed in other Yb3+/Er3+ codoped Gd-based oxide particles, where the upconverted emissions were also two-photon process.18 Therefore, the upconversion mechanism of Yb3+–Er3+ systems in Gd2O2S spheres can be built according to the experimental results and the references,18,19 as shown in Fig. 6.
 | ||
| Fig. 5 Power dependence of UC intensity of Gd2O2S:10%Yb3+,1%Er3+ submicrospheres. | ||
 | ||
| Fig. 6 Energy level diagrams of Yb3+ and Er3+, and possible UC processes. | ||
In principle, three basic population mechanisms may be involved in the upconversion process, namely excited state absorption (ESA), energy transfer upconversion (ET), and photon avalanche. Since no power threshold has been observed, the photon avalanche mechanism may be neglected in our case. Therefore, upconversion luminescence of the Gd2O2S:Er and Gd2O2S:Yb,Er involve ESA and ET processes and their possible schematic diagram is shown in Fig. 6.
For Gd2O2S:1%Er3+ submicrospheres, the excitation wavelength from 980 nm LD matches the absorption transition between the ground state 4I15/2 and the excited level 4I11/2 (GSA). After the first-level excitation, the same wavelength laser pumps the excited ions from the 4I11/2 to the 4F7/2 level (ESA). Finally, radiant transitions from these levels yield the emissions at 524 and 548 nm (2H11/2, 4S3/2→4I15/2) (most strong) and at 671 nm (4F9/2→4I15/2), respectively (Fig. 3). For Gd2O2S:xYb3+,1%Er3+ samples, the Er3+ ion can be excited from the ground-state 4I15/2 to the some excited-states by general multiphoton processes through the ground-state absorption and the energy transfer from the excited Yb3+ ions (4I15/2 (Er) + 2F5/2 (Yb) → 4I11/2 (Er) + 2F7/2 (Yb)). The latter become dominant when the Yb3+ and Er3+ ions are codoped into the host lattices because the Yb3+ ions have a much larger absorption cross section as compared to that of the Er3+ ions around 980 nm. Therefore, the Er3+ ions were first mainly excited to the 4I11/2 level via the energy transfer from the excited Yb3+ ions. Then, the electrons in the 4I11/2 level were excited to the 4F7/2 level by the energy transfer from the Yb3+ ions to the excited Er3+ ions or the ESA process. After that, the excited ions undergo multi-phonon relaxation to luminescent levels 2H11/2 and 4S3/2, which lead to the green 2H11/2→4I15/2 and 4S3/2→4I15/2 emissions. Alternatively, the electrons of some Er3+ ions in the excited state will nonradiatively decay to the 4I13/2 state because of the short lifetime of 4I11/2 state, and then jump to the 4F9/2 level via the energy transfer from the excited Yb3+ ions. The Er3+ ions transit to the ground state and emit red light. If the excitation photon density is high enough, the electron at the 4S3/2 level of the Er3+ ion can absorb another photon and transit to the 2K15/2 level. After nonradiative decay to 4G11/2 state, electrons can populate the 4F9/2 state by energy transfer from the excited Er3+ ions to the ground-state Yb3+ ions through the following process:
4G11/2 (Er) + 2F7/2 (Yb) → 4F9/2 (Er) + 2F5/2 (Yb)
In addition, the electrons also can nonradiatively relax to the 2H9/2 state, resulting in 410 nm luminescence, which should be responsible for the three-photon process. The fact that the red emission is enhanced with increasing Yb3+ concentration reveals that the level 4F9/2 was largely populated. One of the most likely reasons is that introduction of an elevated amount of Yb3+ dopants into the Gd2O2S host lattice would decrease the interatomic distance between the Yb3+ ions and Er3+ ions and thus facilitates the back-energy-transfer process from the Er3+ to Yb3+ ions: 4G11/2 (Er3+) + 2F7/2 (Yb3+) → 4F9/2 (Er3+) + 2F5/2 (Yb3+). The back-energy-transfer should subsequently suppress the population in excited levels of the 4S3/2(2H11/2), resulting in the decrease of the green-light emission (2H11/2/4S3/2 → 4I15/2). Meanwhile, the back-energy-transfer directly populates the 4F9/2 (Er3+) level, producing the enhancement of red (4F9/2→4I15/2) emission. Considering the back-energy-transfer and the nonradiative relaxation processes, the required photon number of upconversion red and green emissions should be more than two, which agrees well with our experimental results.
Conclusion
In summary, a general approach has been developed for the synthesis of the well-disperse hexagonal Gd2O2S:Yb3+,Er3+ submicrospheres. Under the excitation of 980 nm, the red emission (4F9/2–4I15/2) of the Gd2O2S:Yb3+/Er3+ increases with increasing the Yb3+ concentration, while that of the green emission (4S3/2/2H11/2–4I15/2) decreases. The red emission enhancement is attributed to the enhanced population of the 4F9/2 level via the energy transfer (4G11/2 (Er3+) + 2F7/2 (Yb3+) → 4F9/2 (Er3+) + 2F5/2 (Yb3+)), while green emission diminishment is attributed to 4S3/2 + 2F5/2 → 2K15/2 + 2F7/2, which depopulates the excited 4S3/2 level at higher Yb concentrations. So the emission color can be tuned from green to yellow only by changing the Yb3+ concentration. We have also confirmed that the upconversion process in Gd2O2S:Yb3+,Er3+ submicrospheres results from two-photon processes. These materials may have potential applications as bio-probes and displays.Acknowledgements
This work is financially supported by the National Natural Science Foundation of China (Grant 20771098) and the NSFC Fund for Creative Research Group (Grant No. 20921002), and the National Basic Research Program of China (973 Program, Grant 2007CB935502).References
- (a) I. Etchart, A. Huignard, M. Bérard, M. N. Nordin, I. Hernández, R. J. Curry, W. P. Gillin and A. K. Cheetham, J. Mater. Chem., 2010, 20, 3989–3994 RSC; (b) F. Auzel, Chem. Rev., 2004, 104, 139–174 CrossRef CAS.
- (a) T. Hebert, R. Wannemacher, W. Lenth and R. M. Macfarlane, Appl. Phys. Lett., 1990, 57, 1727 CrossRef; (b) Y. Mita, K. Hirama, N. Ando, H. Yamamoto and S. Shionoya, J. Appl. Phys., 1993, 74, 4703 CrossRef CAS; (c) E. Downing, L. Hesselink, J. Ralston and R. Macfarlane, Science, 1996, 273, 1185 CAS.
- (a) F. Vetrone, V. Mahalingam and J. A. Capobianco, Chem. Mater., 2009, 21, 1847–1851 CrossRef CAS; (b) V. Mahalingam, F. Vetrone, R. Naccache, A. Speghini, J. A. Capobianco and J. Mater, Chem., 2009, 19, 3149–3152 CAS; (c) F. Wang, Y. Han, C. S. Lim, Y. Lu, J. Wang, J. Xu, H. Chen, C. Zhang, M. Hong and X. Liu, Nature, 2010, 463, 25 Search PubMed; (d) A. G. Macedo, R. A. S. Ferreira, D. Ananias, M. S. Reis, V. S. Amaral, L. D. Carlos and J. Rocha, Adv. Funct. Mater., 2010, 20, 624–634 CrossRef CAS; (e) G. Jia, H. You, Y. Song, Y. Huang, M. Yang and H. Zhang, Inorg. Chem., 2010, 49, 7721–7725 CrossRef CAS.
- (a) Y. Wei, F. Q. Lu, X. R. Zhang and D. P. Chen, Chem. Mater., 2006, 18, 5733–5737 CrossRef CAS; (b) C. H. Liu, H. Wang, X. R. Zhang and D. P. Chen, J. Mater. Chem., 2009, 19, 489–496 RSC; (c) L. F. Liang, H. F. Xu, Q. Su, H. Konishi, Y. B. Jiang, M. M. Wu, Y. F. Wang and D. Y. Xia, Inorg. Chem., 2004, 43, 1594–1596 CrossRef CAS; (d) F. Zhang, Y. Wan, T. Yu, F. Q. Zhang, Y. F. Shi, S. H. Xie, Y. G. Li, L. Xu, B. Tu and D. Y. Zhao, Angew. Chem., Int. Ed., 2007, 46, 7976–7979 CrossRef CAS.
- (a) C. Zhang, P. Ma, C. Li, G. Li, S. Huang, D. Yang, M. Shang, X. Kang and J. Lin, J. Mater. Chem., 2011, 21, 717–723 RSC; (b) H. J. Guggenheim and L. F. Johnson, Appl. Phys. Lett., 1969, 15, 51 CrossRef CAS.
- G. S. Yi and G. M. Chow, J. Mater. Chem., 2005, 15, 4460–4464 RSC.
- (a) X. Bai, H. Song, G. Pan, Y. Lei, T. Wang, X. Ren, S. Lu, B. Dong, Q. Dai and L. Fan, J. Phys. Chem. C, 2007, 111, 13611–13617 CrossRef CAS; (b) S. K. Singh, K. Kumar and S. B. Rai, J. Appl. Phys., 2009, 106, 093520–093525 CrossRef.
- P. N. Yocom, J. P. Wittke and I. Ladany, Metall. Trans., A, Phys, Metall. Mater. Sci., 1971, 2, 763–767 CAS.
- G. K. Liu, H. Z. Zhuang and X. Y. Chen, Nano Lett., 2002, 2, 535–539 CrossRef CAS.
- G. Wang, Q. Peng and Y. Li, Chem.–Eur. J., 2010, 16, 4923–4931 CrossRef CAS.
- (a) F. Zhao, M. Yuan, W. Zhang and S. Gao, J. Am. Chem. Soc., 2006, 128, 11758 CrossRef CAS; (b) T. Hang, Q. Liu, D. Mao and C. Chang, Mater. Chem. Phys., 2008, 107, 142 CrossRef CAS; (c) J. Thirumalai, R. Chandramohan, R. Divakar, E. Mohandas, M. Sekar and P. Parameswaran, Nanotechnology, 2008, 19, 395703 CrossRef CAS.
- (a) S. Li, H. Feindt, G. Giannaras, R. Scarpino, S. Salamone and R. Sam Niedbala, Proc. SPIE–Int. Soc. Opt. Eng., 2002, 4809, 100 CAS; (b) M. Xing, W. Cao, T. Pang and X. Ling, Solid State Commun., 2009, 149, 911–914 CrossRef CAS.
- T. Hirai and T. Orikoshi, J. Colloid Interface Sci., 2004, 269, 103–108 CrossRef CAS.
- L. Hu, B. Yan, H. Zhang and X. Wang, J. Phys. D: Appl. Phys., 2007, 40, 7519–7522 CrossRef CAS.
- G. S. Yi, H. C. Lu, S. Y. Zhao, G. Yue, W. J. Yang, D. P. Chen and L. H. Guo, Nano Lett., 2004, 4, 2191 CrossRef CAS.
- G. S. Yi, B.Q. Sun, F. Z. Yang, D. P. Chen, Y. X. Zhou and J. Cheng, Chem. Mater., 2002, 14, 2910 CrossRef CAS.
- (a) M. Pollnau, D. R. Gamelin, S. R. Luthi and H. U. Gudel, Phys. Rev. B: Condens. Matter, 2000, 61, 3337 CrossRef CAS; (b) H. You and M. Nogami, Appl. Phys. Lett., 2004, 85, 3432–3434 CrossRef CAS.
- (a) K. Zheng, D. Zhang, D. Zhao, N. Liu, F. Shi and W. Qin, Phys. Chem. Chem. Phys., 2010, 12, 7620–7625 RSC; (b) H. Guo, N. Dong, M. Yin, W. Zhang, L. Lou and S. Xia, J. Phys. Chem. B, 2004, 108, 19205–19209 CrossRef CAS.
- (a) D. Solis, E. De la Rosa, O. Meza, L. A. Diaz-Torres, P. Salas and C. Angeles-Chavez, J. Appl. Phys., 2010, 108, 023103–023111 CrossRef; (b) Y. Li, J. Zhang, X. Zhang, Y. Luo, X. Ren, H. Zhao, X. Wang, L. Sun and C. Yan, J. Phys. Chem. C, 2009, 113, 4413–4418 CrossRef CAS.
| This journal is © The Royal Society of Chemistry 2012 |