One-pot synthesis of ternary CuInS2 quantum dots with near-infrared fluorescence in aqueous solution
Siyu
Liu
a,
Hao
Zhang
a,
Yu
Qiao
b and
Xingguang
Su
*a
aDepartment of Analytical Chemistry, College of Chemistry, Jilin University, Changchun, 130012, China. E-mail: suxg@jlu.edu.cn; Tel: +86-431-5168352
bThe state key laboratory of hydrothermal synthesis, College of Chemistry, Jilin University, Chang Chun, 130012, China
First published on 24th November 2011
Abstract
In this paper, we present a novel and simple hydrothermal synthesis method for preparing water soluble high quality ternary CuInS2 quantum dots (QDs) with mercaptopropionic acid (MPA) as the stabilizer. The influences of various experimental variables, including the precursor concentrations, reaction time, reaction temperature, pH value, the MPA/Cu molar ratio, as well as the kind of capping ligand used on the luminescent properties of the obtained ternary CuInS2 QDs have been systematically investigated. The stable ternary CuInS2 QDs with good photoluminescence emission properties and narrow size distribution can be obtained under optimum experimental conditions. It was used to label liver cancer cells. The optical features and structure of the obtained CuInS2 QDs have been characterized by UV-vis and fluorescence spectroscopy, TEM, XRD, FT-IR and EDX. The proposed synthesis method was simple, low cost, with comparatively low reaction temperature (150 °C), and the as-synthesized near-infrared CuInS2 QDs was proven to have excellent photostability. The synthesized CuInS2 QDs is a promising fluorescent probe for biological and biomedical imaging due to its bandgap in the near infrared and the absence of toxic heavy metal ions.
1. Introduction
The research about semiconductor nanoparticles, also named semiconductor quantum dots (QDs), has got great achievements during the past two decades. QDs were utilized in labeling biomolecules, medical identification and determining heavy metals and cell imaging1–4 owing to their special photophysical and photochemical properties.In comparison with traditional organic dyes and fluorescent proteins, QDs show unique advantages such as size tunable fluorescence, high emission quantum yields, narrow and symmetric emission peaks with a broad excited wavelength, and good chemical and photo stabilities. Among all of the potential applications of QDs, biomedical imaging is of great interest. When the QDs with visible light region are used as fluorescent probes in biomedical analysis, many challenges arise. The emission spectra in the visible region would be attenuated because of the limited penetration depth of visible light through deep-tissue. Due to the light absorption and scattering properties of tissues, the fluorescence signal strength would weaken. Besides, the autofluorescence spectra of some macromolecules in living cells such as collagen largely overlap in the visible region. QDs with the emission wavelength in near-infrared region (NIR), between 650–900 nm, have high transparency of biological tissue in this region,5 and Rayleigh scattering decreases with increasing wavelength. NIR QDs provide enormous potential for non-invasive in vivo biomedical imaging. How to develop novel probes with emission profiles at 650–900 nm is the key of current research. Various kinds of work on the synthesis of NIR QDs have been reported in recent years. The II–VI type QDs (HgTe, CdHgTe, CdTeSe, CdTeSe/CdS), and III–V type QDs (InAs, InP, GaAs, InAs, InAsx P1-x) have been reported widely. Peng and his co-workers prepared highly photoluminescent CdSe/CdTe/ZnSe composite QDs via modified successive ionic layer adsorption and reaction (SILAR) techniques, straight SILAR for peanut-shaped ones and SILAR coupled with thermal-cycling (SILAR-TC) for dot-shaped ones.6 O'Connor and co-workers synthesized crystalline 4.6 nm HgTe QDs, stabilized by 1-thioglycerol ligands, via wet chemical methods.7 The IV–VI type NIR QDs mostly include PbS and PbSe. Hines et al. used oleic acid to dissolve PbO to get a metal precursor to produce PbS QDs.8 Choudhury et al. prepared PbSe nanocomposites that were photoactive at infrared wavelengths and narrow emission bands.9
Near infrared QDs are promising fluorescent probes for several biomedical applications such as optically-guided surgery.4,10 However so far applications of near infrared QDs to the clinical field have been hampered by the high toxicity of the NIR QDs constituents such as Cd, Hg, As, Pb, As. Thus the development of less toxic and more environmentally friendly ternary NIR QDs materials attracted considerable attention.
Work reported about CuInS2 before has been mostly for the synthesis of bulk and large particles using sputtering solvothermal techniques11 and spray method.12 Some strategies for the preparation of CuInS2 QDs were devised in succession13–21 such as single source routes, hot injection techniques, and solvothermal techniques. These ternary semiconductor nanocrystals were mostly obtained in organic solvents by using extremely expensive, relatively high toxic, unstable, hazardous precursors. From a green chemistry viewpoint, the rigorous reaction conditions, the complex synthetic strategy, and the costly reactants restricted the further application of these strategies.
The exploration of simpler and less costly methods is a constant pursuit of researchers. This paper reports a novel and simple scheme for aqueous synthesis of ternary CuInS2QDs, and characterizes their photophysical and structural properties with UV-vis and fluorescence spectroscopy, TEM, XRD, FT-IR and EDX. Compared with previous reports, our strategy only utilizes MPA as the stabilizer, and the inorganic precursors are simple, low cost, convenient and green. The obtained water soluble CuInS2 QDs is a novel class of toxic heavy metal-free NIR emitters.
2. Experimental
2.1 Synthesis of CuInS2 QDs
CuInS2 QDs were synthesized in aqueous solution via a hydrothermal synthesis method. In a typical experiment, CuCl2·2H2O (0.15 mmol) and InCl3·4H2O (0.15 mmol) were dissolved in distilled water (10.5 ml), then MPA (1.8 mmol) was injected into the solution, and then the solution produced yellow granules immediately. The pH value of the mixture solution was adjusted to 11.3 by adding 2 mol L−1NaOH solution with stirring. During this process, the solution changed from turbid to clear pink. After stirring for 10 min, CS (NH2)2(0.30 mmol) was dissolved in the solution. The Cu–to–In–to–S and Cu–to–MPA precursor ratios were 1![[thin space (1/6-em)]](https://www.rsc.org/images/entities/char_2009.gif) :
:![[thin space (1/6-em)]](https://www.rsc.org/images/entities/char_2009.gif) 1
1![[thin space (1/6-em)]](https://www.rsc.org/images/entities/char_2009.gif) :
:![[thin space (1/6-em)]](https://www.rsc.org/images/entities/char_2009.gif) 2 and 1
2 and 1![[thin space (1/6-em)]](https://www.rsc.org/images/entities/char_2009.gif) :
:![[thin space (1/6-em)]](https://www.rsc.org/images/entities/char_2009.gif) 12, respectively. All the above mentioned experimental procedures were performed at room temperature, and then the solution was transferred into a Taflon-lined stainless steel autoclave with a volume of 15 mL. The autoclave was maintained at 150 °C for 21 h and then cooled down to room temperature by a hydrocooling process. The as-prepared CuInS2 QDs were obtained. Before bio-applications, some unreacted chemicals such as excess free MPA in the process of CuInS2 synthesis could be removed via the dialysis process. The CuInS2 QDs powder could be precipitated by ethanol, and the precipitate was isolated by centrifugation, washed with ethanol several times, then the powder was dried at 60 °C for 4–6 h. The obtained powder was used for XRD, TEM, FT-IR and EDX measurements.
12, respectively. All the above mentioned experimental procedures were performed at room temperature, and then the solution was transferred into a Taflon-lined stainless steel autoclave with a volume of 15 mL. The autoclave was maintained at 150 °C for 21 h and then cooled down to room temperature by a hydrocooling process. The as-prepared CuInS2 QDs were obtained. Before bio-applications, some unreacted chemicals such as excess free MPA in the process of CuInS2 synthesis could be removed via the dialysis process. The CuInS2 QDs powder could be precipitated by ethanol, and the precipitate was isolated by centrifugation, washed with ethanol several times, then the powder was dried at 60 °C for 4–6 h. The obtained powder was used for XRD, TEM, FT-IR and EDX measurements.
2.2 Cell cultures and cell imaging
Liver cancer cells (Human osteoblast-like HepG2) were incubated in DMEM supplemented with 10% heat-inactivated FBS at 37 °C in the humidified atmosphere with 5% CO2. Cells for fluorescent imaging were grown on slide glasses in 6-well plates (Corning Incorporated, Corning, NY, US) at a density of 3 × 10⁵cells per well, and 100 μL CuInS2 QDs solution was added into DMEM medium. After 2 h, DMEM medium was taken out and cells were washed with PBS briefly. Then cells were fixed with 4% paraformaldehyde for 20 min and washed with PBS three times.Fluorescent images of the cells were taken by an inverted fluorescence microscope equipped with the Nuance system. All the image cubes were acquired using two multiple filters at 10 nm wavelength intervals with an automatic exposure time. Background and auto-fluorescence were removed from the final images.
2.3 Materials and apparatus
All reagents were analytical grade and used directly without any purification. Copper(II) chloride dehydrate (CuCl2·2H2O), sodium hydroxide (NaOH) and sulfourea (CS (NH2)2) were purchased from Beijing Chemical Works. Mercaptopropionic acid (MPA), 2-mercaptonicotinic acid (MNA), mercaptosuccinic acid (MSA) and indium(III) chloride tetrahydrate (InCl3·4H2O) were purchased from Sigma-Aldrich Corporation. The water used in all experiments had a resistivity higher than 18 MΩ cm−1. Dulbecco's modified Eagle's medium with high glucose (DMEM) was obtained from Invitrogen Corporation. Fetal bovine serum (FBS) was purchased from Hyclone. All the solutions for cells were prepared with triply distilled water.The fluorescence spectra were obtained by using a Shimadzu RF-5301 PC spectrofluorophotometer equipped with a xenon lamp using right-angle geometry. UV-Vis absorption spectra were obtained by a Varian GBC Cintra 10 e UV-Vis spectrometer. In both experiments, a 1 cm path-length quartz cuvette was used. An inverted fluorescence microscope (Olympus FV1000 IX71) equipped with a multispectral imaging system (Nuance, CRI, Woburn, MA, USA) was used to observe the morphological changes of cells for qualitative analysis
Transmission electron microscopy (TEM) experiments were performed on a Philips Tecnai F20 TEM operating at 200 KV acceleration voltage. TEM samples were prepared by dropping the aqueous CuInS2 solution onto carbon-coated copper grids and allowing the excess solvent to evaporate. FT-IR spectra were recorded with a Bruker IFS66V FT-IR spectrometer equipped with a DGTS detector (32 scans). Powder X-ray diffraction (XRD) was carried out with a Rigaku D/MAX 2550 diffractometer with Cu Kα radiation. Energy-Dispersive Spectroscopy (EDS) was obtained by using a JSM-6700F scanning electron microscope equipped with a filed emission gun and operated at 20 KV.
3. Results and discussion
Photochemical properties of QDs are vital for their applications as photoelectronic materials. Though the compositions of QDs are the same, the optical properties may vary because of different size, shape, and surface states. In the process of the synthesis, these factors, as the size, shape and composition, etc., were affected by reaction time, temperature, pH value of the system and concentration of precursor.3.1 Influence of reaction temperature
Traditional single source precursor routes were in the organic systems, and the decomposition temperature was generally between 160 °C and 300 °C. This temperature region was chosen for balancing the activity of Cu2+ and In3+.6,17 In this paper, the effect of reaction temperature on the fluorescence spectra of CuInS2 QDs was studied, and the results are shown in Fig. 1. From Fig. 1, it can be noted that the fluorescence peak appeared at about 630 nm when the reaction temperature was 100 °C, this fluorescence peak was caused by the CuxS (x = 1–2) nanophase.16,22 When the reaction temperature reached 130 °C, the precursors reacted to generate CuInS2 ternary QDs, and another fluorescence peak around 660 nm appeared. The fluorescence intensity at 660 nm increased with increasing temperature until 150 °C, then the fluorescence intensity at 660 nm decreased with the increase of reaction temperature to 160 °C. When the synthesis system was heated at 150 °C for 21 h, only the fluorescence peak around 660 nm appeared, and the fluorescence peak at 630 nm disappeared. The change of fluorescence emission peaks of ternary CuInS2 QDs observed between 130 °C and 150 °C agreed with the reaction activity of Cu2+ and In3+ in this temperature region. Considering indium was hard to participate in the growth of ternary QDs below 130 °C in aqueous solution, a CuxS nanophase is easy to create at high temperature. In this study, 150 °C was chosen as the optimal reaction temperature.![The fluorescence emission spectra of ternary CuInS2 QDs synthesized with MPA as stabilizer at different reaction temperatures in hydrothermal synthesis. The precursor concentration of CuCl2 is 13.6 mmol L−1, and [Cu]:[In]:[S]:[MPA] = 1 : 1 : 2 : 12. A–E represents the reaction temperatures of 100 °C, 130 °C, 140 °C, 150 °C, 160 °C, respectively.](/image/article/2012/RA/c1ra00802a/c1ra00802a-f1.gif) | ||
Fig. 1 The fluorescence emission spectra of ternary CuInS2 QDs synthesized with MPA as stabilizer at different reaction temperatures in hydrothermal synthesis. The precursor concentration of CuCl2 is 13.6 mmol L−1, and [Cu]:[In]:[S]:[MPA] = 1![[thin space (1/6-em)]](https://www.rsc.org/images/entities/char_2009.gif) : :![[thin space (1/6-em)]](https://www.rsc.org/images/entities/char_2009.gif) 1 1![[thin space (1/6-em)]](https://www.rsc.org/images/entities/char_2009.gif) : :![[thin space (1/6-em)]](https://www.rsc.org/images/entities/char_2009.gif) 2 2![[thin space (1/6-em)]](https://www.rsc.org/images/entities/char_2009.gif) : :![[thin space (1/6-em)]](https://www.rsc.org/images/entities/char_2009.gif) 12. A–E represents the reaction temperatures of 100 °C, 130 °C, 140 °C, 150 °C, 160 °C, respectively. 12. A–E represents the reaction temperatures of 100 °C, 130 °C, 140 °C, 150 °C, 160 °C, respectively. | ||
3.2 Influence of the pH value on the reaction system
As previously reported, the synthesis of ternary CuInS2 QDs generally utilized long-chain thiols as the ligands in organic solvent, and the influence of the pH value was seldom discussed. However, the pH value of the medium is important in an aqueous synthesis. In this paper, the influence of the pH value of the reaction is discussed.From Fig. 2, it can be seen that the fluorescence peak of ternary CuInS2 QDs at 660 nm appeared when the pH value of the reaction system reached 10. The fluorescence intensity reached a maximum at pH 11. When the pH value of the solution was 12, some white precipitate appeared, which maybe Cu(OH)2 and In(OH)3. In this paper, a pH value of 11.3 was used in further experiments.
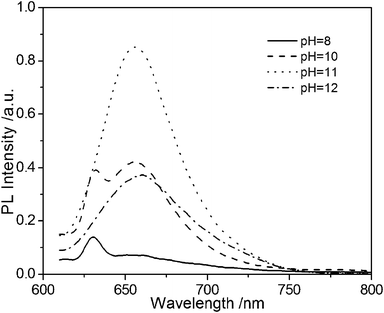 | ||
| Fig. 2 The fluorescence emission spectra of ternary CuInS2 QDs with MPA as stabilizer at different pH values in hydrothermal synthesis. The precursor concentration of CuCl2 is 13.6 mmol L−1. | ||
3.3 Influence of reaction time
The reaction time is a significant parameter for the growth of ternary CuInS2 QDs. If the reaction time was inadequate, the crystalline of the obtained QDs would be poor. In contrast, when the reaction time was too long, the QDs would congregate to grow into bulk. In order to study the effect of reaction time on the formation of ternary CuInS2 QDs, the corresponding precursors were heated at 150 °C for different time intervals to maintain the growth of ternary CuInS2 QDs. Fig. 3 shows typical fluorescence spectra of aqueous ternary CuInS2 QDs with different reaction times. When the reaction time changed from 17 h to 23 h, the fluorescence emission intensity of ternary CuInS2 QDs at around 665 nm increased with increasing time. The ternary CuInS2 QDs synthesized at 150 °C for 23 h have the strongest fluorescence emission intensity. With further prolonging the reaction time, the fluorescence emission intensity decreased. The stability of the obtained CuInS2 QDs decreased when the reaction time was 23 h, which may be caused by the agglomeration of CuInS2 QDs. We chose a reaction time of 21 h in later experiments.![Temporal evolution of fluorescence emission spectra of ternary CuInS2 QDs with MPA as the stabilizer during their growth in hydrothermal synthesis. The precursor concentration of CuCl2 is 13.6 mmol L−1, and [Cu]:[In]:[S]:[MPA] = 1 : 1 : 1 : 12.](/image/article/2012/RA/c1ra00802a/c1ra00802a-f3.gif) | ||
Fig. 3 Temporal evolution of fluorescence emission spectra of ternary CuInS2 QDs with MPA as the stabilizer during their growth in hydrothermal synthesis. The precursor concentration of CuCl2 is 13.6 mmol L−1, and [Cu]:[In]:[S]:[MPA] = 1![[thin space (1/6-em)]](https://www.rsc.org/images/entities/char_2009.gif) : :![[thin space (1/6-em)]](https://www.rsc.org/images/entities/char_2009.gif) 1 1![[thin space (1/6-em)]](https://www.rsc.org/images/entities/char_2009.gif) : :![[thin space (1/6-em)]](https://www.rsc.org/images/entities/char_2009.gif) 1 1![[thin space (1/6-em)]](https://www.rsc.org/images/entities/char_2009.gif) : :![[thin space (1/6-em)]](https://www.rsc.org/images/entities/char_2009.gif) 12. 12. | ||
3.4 Influence of precursor concentration
Generally, in hydrothermal synthesis, nanoparticles can be easily obtained at low precursor concentration, and the bulk would be produced with the increasing concentration. According to previous reports on the aqueous synthesis of QDs,22–24 a certain amount of precursor was added into the distilled water with a fixed precursor ratio of Cu:In:S of 1![[thin space (1/6-em)]](https://www.rsc.org/images/entities/char_2009.gif) :
:![[thin space (1/6-em)]](https://www.rsc.org/images/entities/char_2009.gif) 1
1![[thin space (1/6-em)]](https://www.rsc.org/images/entities/char_2009.gif) :
:![[thin space (1/6-em)]](https://www.rsc.org/images/entities/char_2009.gif) 2, the optimized precursor concentration was investigated in this paper. The fluorescence emission spectra of the as-synthesized CuInS2 QDs at different Cu2+ precursor concentrations are showed in Fig. 4. It can be seen that when the precursor concentration of Cu2+ reached 9.0 mM, the fluorescence peak of CuInS2 QDs at 660 nm appeared, and the fluorescence intensity of CuInS2 QDs increased correspondingly with the increasing concentration of Cu2+ from 9.0 mmol L−1 to 36.4 mmol L−1. When the concentration of Cu2+ was increased to 36.4 mmol L−1, the fluorescence emission peak position showed an obvious red shift, and the obtained CuInS2 QDs easily aggregated. In this study, we chose the precursor concentration of Cu2+ to be 13.6 mmol L−1 to construct CuInS2 QDs with optimum fluorescence emission properties.
2, the optimized precursor concentration was investigated in this paper. The fluorescence emission spectra of the as-synthesized CuInS2 QDs at different Cu2+ precursor concentrations are showed in Fig. 4. It can be seen that when the precursor concentration of Cu2+ reached 9.0 mM, the fluorescence peak of CuInS2 QDs at 660 nm appeared, and the fluorescence intensity of CuInS2 QDs increased correspondingly with the increasing concentration of Cu2+ from 9.0 mmol L−1 to 36.4 mmol L−1. When the concentration of Cu2+ was increased to 36.4 mmol L−1, the fluorescence emission peak position showed an obvious red shift, and the obtained CuInS2 QDs easily aggregated. In this study, we chose the precursor concentration of Cu2+ to be 13.6 mmol L−1 to construct CuInS2 QDs with optimum fluorescence emission properties.
![The fluorescence emission spectra of ternary CuInS2 QDs with MPA as stabilizer at different CuCl2 precursor concentrations. The [Cu]:[In]:[S]:[MPA] = 1 : 1 : 2 : 12. A–D represents CuCl2 precursor concentrations of 9.0 mmol L−1, 13.6 mmol L−1, 18.2 mmol L−1, 36.4 mmol L−1, respectively.](/image/article/2012/RA/c1ra00802a/c1ra00802a-f4.gif) | ||
Fig. 4 The fluorescence emission spectra of ternary CuInS2 QDs with MPA as stabilizer at different CuCl2 precursor concentrations. The [Cu]:[In]:[S]:[MPA] = 1![[thin space (1/6-em)]](https://www.rsc.org/images/entities/char_2009.gif) : :![[thin space (1/6-em)]](https://www.rsc.org/images/entities/char_2009.gif) 1 1![[thin space (1/6-em)]](https://www.rsc.org/images/entities/char_2009.gif) : :![[thin space (1/6-em)]](https://www.rsc.org/images/entities/char_2009.gif) 2 2![[thin space (1/6-em)]](https://www.rsc.org/images/entities/char_2009.gif) : :![[thin space (1/6-em)]](https://www.rsc.org/images/entities/char_2009.gif) 12. A–D represents CuCl2 precursor concentrations of 9.0 mmol L−1, 13.6 mmol L−1, 18.2 mmol L−1, 36.4 mmol L−1, respectively. 12. A–D represents CuCl2 precursor concentrations of 9.0 mmol L−1, 13.6 mmol L−1, 18.2 mmol L−1, 36.4 mmol L−1, respectively. | ||
3.5 Influence of MPA/Cu molar ratio
The addition of MPA to the reaction system plays an important role in the synthesis of ternary CuInS2 QDs. On the one hand, MPA balances the activity of Cu2+ and In3+ by controlling the release rate of Cu2+ and In3+ at the beginning of the reaction, on the other hand, MPA stabilizes the as-synthesized CuInS2 QDs.13,17,19,23 In this paper, the influence of the molar ratio of MPA/Cu on the fluorescence spectra of CuInS2 QDs was studied systematically, and the results are shown in Fig. 5. It can be seen that when the reactant molar ratios Cu/MPA were changed from 1![[thin space (1/6-em)]](https://www.rsc.org/images/entities/char_2009.gif) :
:![[thin space (1/6-em)]](https://www.rsc.org/images/entities/char_2009.gif) 10 to 1
10 to 1![[thin space (1/6-em)]](https://www.rsc.org/images/entities/char_2009.gif) :
:![[thin space (1/6-em)]](https://www.rsc.org/images/entities/char_2009.gif) 30, the fluorescence emission spectra varied accordingly. The fluorescence intensity of CuInS2 QDs at around 660 nm increased with the increasing amount of MPA from MPA/Cu of 10
30, the fluorescence emission spectra varied accordingly. The fluorescence intensity of CuInS2 QDs at around 660 nm increased with the increasing amount of MPA from MPA/Cu of 10![[thin space (1/6-em)]](https://www.rsc.org/images/entities/char_2009.gif) :
:![[thin space (1/6-em)]](https://www.rsc.org/images/entities/char_2009.gif) 1 to MPA/Cu of 12
1 to MPA/Cu of 12![[thin space (1/6-em)]](https://www.rsc.org/images/entities/char_2009.gif) :
:![[thin space (1/6-em)]](https://www.rsc.org/images/entities/char_2009.gif) 1. In fact, when the reactant molar ratio MPA/Cu exceeded 15, the tailed peak of fluorescence emission of obtained CuInS2 QDs appeared, and the CuInS2 QDs were unstable. In this work, the optimal reactant molar ratio of MPA/Cu was chosen 12
1. In fact, when the reactant molar ratio MPA/Cu exceeded 15, the tailed peak of fluorescence emission of obtained CuInS2 QDs appeared, and the CuInS2 QDs were unstable. In this work, the optimal reactant molar ratio of MPA/Cu was chosen 12![[thin space (1/6-em)]](https://www.rsc.org/images/entities/char_2009.gif) :
:![[thin space (1/6-em)]](https://www.rsc.org/images/entities/char_2009.gif) 1 and the PL quantum yield of the ternary QDs synthesized under the reaction condition was 3.3%, which was higher than that synthesized in organic solvent (QY = 3%).17
1 and the PL quantum yield of the ternary QDs synthesized under the reaction condition was 3.3%, which was higher than that synthesized in organic solvent (QY = 3%).17
![The effect of different molar ratios of [MPA]/[CuCl2] on the fluorescence emission spectra of ternary CuInS2 QDs. The precursor concentration of CuCl2 is 13.6 mmol L−1, and [Cu]:[In]:[S] = 1 : 1 : 2.](/image/article/2012/RA/c1ra00802a/c1ra00802a-f5.gif) | ||
Fig. 5 The effect of different molar ratios of [MPA]/[CuCl2] on the fluorescence emission spectra of ternary CuInS2 QDs. The precursor concentration of CuCl2 is 13.6 mmol L−1, and [Cu]:[In]:[S] = 1![[thin space (1/6-em)]](https://www.rsc.org/images/entities/char_2009.gif) : :![[thin space (1/6-em)]](https://www.rsc.org/images/entities/char_2009.gif) 1 1![[thin space (1/6-em)]](https://www.rsc.org/images/entities/char_2009.gif) : :![[thin space (1/6-em)]](https://www.rsc.org/images/entities/char_2009.gif) 2. 2. | ||
3.6 Influence of different stabilizers on the fluorescence emission of CuInS2 QDs
The effect of three kinds of thiol-stabilizer including MPA, MNA, and MSA on the fluorescence emission of CuInS2 QDs was studied. Under the same conditions, the fluorescence emission spectra of CuInS2 QDs synthesized with different stabilizers are shown in Fig. 6. It is clear that the obtained CuInS2 QDs with MPA and MSA as stabilizers exhibit good fluorescence emission spectra. When the stabilizer is changed from MPA to MSA, the fluorescence emission peak of QDs shows an obvious blue shift. Because of the solubility of the MNA, under the same conditions, the product with MNA as the stabilizer underwent bulk precipitation, and then no fluorescence emission signal could be detected.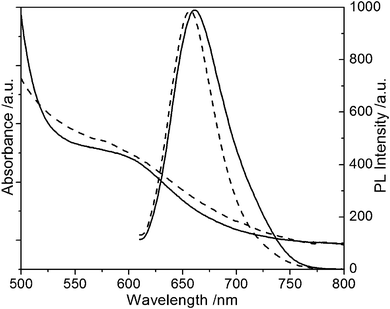 | ||
| Fig. 6 The UV-Vis absorption and fluorescence emission spectra of ternary CuInS2 QDs with MPA and MSA as stabilizers. (A) MPA (solid line), (B) MSA (broken line). | ||
3.7 Photostability of ternary CuInS2 QDs and cell fluorescence imaging with CuInS2 QDs
From a green chemistry viewpoint, the NIR ternary CuInS2 QDs does not contain toxic elements such as Cd, Hg, Se, and As, which is propitious to biomedical imaging and assays. Considering the photostability of the CuInS2 QDs is critical for their practical applications. We utilized a 150 W xenon lamp for continuous intensive excitation at 580 nm for 3 h, and got the photobleaching curves of the ternary CuInS2QDs (Fig. 7). From Fig. 7, we clearly observed that the fluorescence emission intensity of the QDs was almost constant during a 3 h irradiation process. The excellent photostability and no toxic composition allow ternary CuInS2 QDs to be used as a new class of fluorescent labels in biomedical imaging and assays.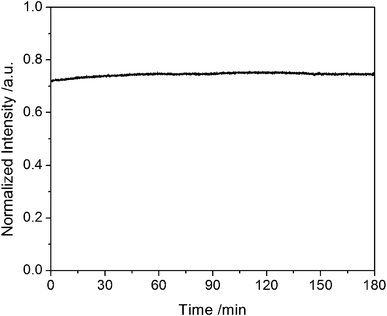 | ||
| Fig. 7 The photobleaching experiment of the ternary CuInS2 QDs in aqueous solution with a 580 nm excitation source. The fluorescence emission wavelength of CuInS2 QDs is at 661 nm. | ||
To explore the suitability of biomedical labeling using the CuInS2 QDs discussed here, a preliminary test was carried out (Fig. 8). CuInS2 QDs were used for the cell fluorescence imaging of Human osteoblast-like HepG2 cells. From Fig. 8, it can be seen that the cells in the field of view of the microscope were labeled by red emission CuInS2 QDs, which indicates that the ternary CuInS2 QDs successfully enter the Human osteoblast-like HepG2 cells. The results show that CuInS2 QDs are able to perform as biomarkers for cancer cell fluorescence imaging which is under further investigations. Compared with cadmium containing QDs, the toxicity from CuInS2 QDs is much less and has more possibilities for future clinical applications. While, the potential toxicity from the MPA in the process of synthesis in aqueous solution cannot be ignored, an effective method is to employ the amphiphilic polymer for further coating on the QDs to alleviate the potential damage on cells and animals.25–26
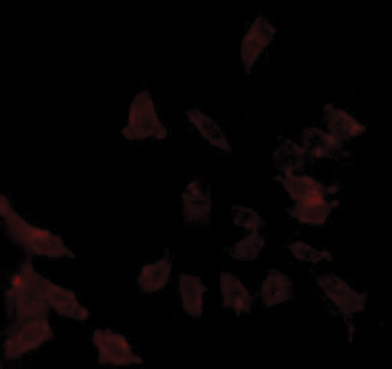 | ||
| Fig. 8 The fluorescence imaging of Human osteoblast-like HepG2 cells labelled with ternary CuInS2 QDs. | ||
3.8 Structure characterization
The morphological and structural analyses of the as-synthesized CuInS2 QDs were undertaken using TEM, XRD, FT-IR, and EDX. TEM observations were employed to study the size of the ternary CuInS2 QDs. Fig. 9 A shows a TEM micrograph of as-synthesized CuInS2 QDs. It can be seen from Fig. 9A, that the size distribution of CuInS2 QDs was reasonably uniform and that the particle size of most CuInS2 QDs was approximate 2 nm, This can be also be proved via hydrodynamic size distribution. From the particle size distribution histogram (Fig. 9B), it can be seen the CuInS2 QDs are nearly monodisperse with diameters from 2 nm to 4 nm, and an average diameter of 2.2 nm.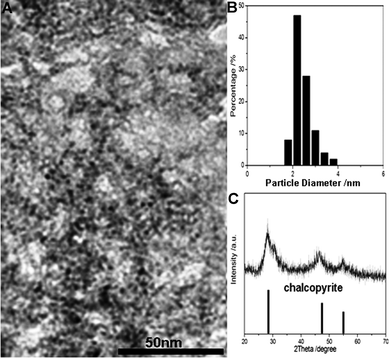 | ||
| Fig. 9 (A) TEM image, (B) hydrodynamic size distribution histogram and (C) XRD pattern of the ternary CuInS2 QDs with MPA as the stabilizer. | ||
Fig. 9 C shows the powder X-ray diffraction patterns of powdered samples of CuInS2 QDs. From the XRD diffractogram, it can be seen that three relatively broad peaks appearing around 28°, 47°, 55°, which were in their expected lattice planes (112), (204/220), and (116/312), were indexed to the appropriate reference pattern (JCDPS #85-1575). So the chalcopyrite tetragonal structure of as-synthesized CuInS2 QDs could be confirmed.27
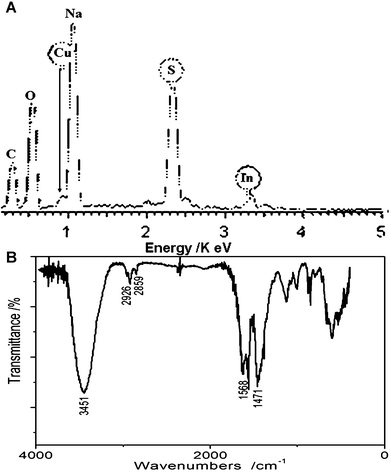
The elemental composition of as-synthesized CuInS2 QDs was determined by EDS (Fig. 10A). The elements C, O, Cu, In and S were respectively probed, and the EDS result revealed that the Cu to In molar ratio was about 1![[thin space (1/6-em)]](https://www.rsc.org/images/entities/char_2009.gif) :
:![[thin space (1/6-em)]](https://www.rsc.org/images/entities/char_2009.gif) 1, which is consistent with the composition of CuInS2. The elements C, O and excessive S might be caused by the MPA capping reagent.
1, which is consistent with the composition of CuInS2. The elements C, O and excessive S might be caused by the MPA capping reagent.
To further characterize the as-synthesized CuInS2 QDs, we carried out FT-IR to investigate the surface composition of CuInS2 QDs. The FT-IR spectra of the ternary QDs capped with MPA is shown in Fig. 10B. Most functional groups of MPA could be clearly found through the characteristic peaks of O–H (3451 cm−1 stretching vibration), –COOH (1568 cm−1 asymmetric stretching vibration, 1471 cm−1 symmetric stretching vibration), and –CH2 (2926 cm−1 asymmetric stretching vibration, 2859 cm−1 symmetric stretching vibration), but the characteristic peak of S–H was not found between 2550–2680 cm−1, which might be caused by the covalent bonds between thiols and metal atoms of the ternary QDs. So we can ascertain that the ternary CuInS2 QDs were capped by the stabilizer MPA.
4. Conclusions
In summary, we have successfully developed a novel and simple hydrothermal method to synthesize ternary CuInS2 QDs with MPA as the stabilizer. The as-synthesized QDs are of chalcopyrite-type, and the hydrophilic CuInS2 QDs capped with MPA are stable for several months in aqueous solution. Compared with the traditional synthetic method in an organic solvent, this method is green, simple, and low cost. Due to the photochemical and hydrophilic properties of the as-synthesized CuInS2 QDs, it is expected that this water-dispersible and non-cadmium CuInS2 can offer promising alternatives to II-VI QDs for in vivofluorescence imaging. Some researchers have successfully coated CuInS2 QDs with a ZnS shell, and the fluorescence quantum yields and photostability of the obtained core–shell QDs improved effectively. However, all the synthesis were processed in mixture of multiple organic solvents, the synthetic process was relatively complex, and the synthesized CuInS2/ZnS QDs could not be directly used in bio-applications. The focus of our next work is to directly coat CuInS2 with a ZnS shell in aqueous solution.Acknowledgements
This work was financially supported by the National Natural Science Foundation of China (No. 20075009, No. 20875036, No. 21075050) and the science and technology development project of Jilin province, China (No. 20110334).References
- B. Cheng and P. Zhong, Anal. Bioanal. Chem., 2005, 381, 986–992 CrossRef.
- M. A. Emril, Y. Zheng, H.-h. Yu and J. Y. Ying, Anal. Chem., 2007, 79, 9452–9258 CrossRef.
- C. Wang, Q. Ma, W. Dou, S. Kanwal, G. Wang, P. Yuan and X. Su, Talanta, 2009, 77, 1358–1364 CrossRef CAS.
- Q. Ma, W. Yu and X. Su, Talanta, 2010, 82, 51–55 CrossRef CAS.
- S. Kim, Y. T. Lim, E. G. Soltesz, A. M. De Grand, J. Lee, A. Nakayama, J. A. Parker, T. Mihaljevic, R. G. Laurence, D. M. Dor, L. H. Cohn, M. G. Bawendi and J. V. Frangioni, Nat. Biotechnol., 2004, 22, 93–97 CrossRef CAS.
- B. Blackan, D. Battaglia and X. Peng, Chem. Mater., 2008, 20(15), 4847–4853 CrossRef.
- E. O'Connor, A. O'Riordan, H. Doyle, S. Moynihan, A. Cuddihy and G. Redmond, Appl. Phys. Lett., 2005, 86, 201114 CrossRef.
- M. A. Hines and G. D. Scholes, Adv. Mater., 2003, 15, 1844 CrossRef CAS.
- K. R. Choudhury, Y. Sahoo, T. Y. Ohulchanskyy and P. N. Prasad, Appl. Phys. Lett., 2009, 87, 073110–073110-3 CrossRef.
- X. Wu and H. Liu, Nat. Biotechnol., 2003, 21, 41–46 CrossRef CAS.
- Y. Jiang, Y. Wu, X. Mo, W. C. Yu, Y. Xie and Y. T. Qian, Inorg. Chem., 2000, 39, 2964 CrossRef CAS.
- R. Scheer a, R. Klenk, J. Klaer and I. Luck, Sol. Energy, 2004, 77, 777–784 CrossRef.
- L. C. Stephanie, G. B. Sheila, P. R. Ryne, K. B. Kulbinder and F. H. Aloysius, J. Phys. Chem. B, 2004, 108, 12429–12435 CrossRef.
- N. Hiroyuki, K. Wataru, U. Masato, N. Katsuhiro, O. Takahisa, O.-Yao-Matsuo Shinya, M. Masaya and M. Hideaki, Chem. Mater., 2006, 18, 3330–3335 CrossRef.
- D. Pan, L. An, Z. Sun, W. Hou, Y. Yang, Z. Yang and Y. Lu, J. Am. Chem. Soc., 2008, 130(17), 5620–5621 CrossRef CAS.
- H. Zhong, Y. Zhou, M. Ye, Y. He, J. Ye, C. He, C. Yang and Y. Li, Chem. Mater., 2008, 20, 6434–6443 CrossRef CAS.
- R. Xie, M. Rutherford and X. Peng, J. Am. Chem. Soc., 2009, 131(15), 5691–5697 CrossRef CAS.
- S. J. Gardner, S. Endrit, C. Wang, D. L. Lau, G. R. Rodriguez and J. J. Pak, J. Nanopart. Res., 2008, 10, 633–641 CrossRef.
- L. Castro Stephanie, G. Bailey Sheila, P. Raffaelle Ryne, K. Banger Kulbinder and F. Hepp Aloysius, Chem. Mater., 2003, 15, 3142–3147 CrossRef.
- S. L. Castro, S. G. Bailey, K. K. Banger and A. F. Hepp, Chem. Mater., 2003, 15, 3142–3147 CrossRef CAS.
- J. J. Nairn, P. J. Schapiro, B. Twamley, T. Pounds, R. V. Wandruszka, M. Williams, C. M. Wang and M. G. Notton, Nano Lett., 2006, 6, 1218–1223 CrossRef CAS.
- G. Nikolai, V. T. Dmitri, A. L. Rogach, H. Kathrin, E. V. Shevchenko, A. Kornowski, E. Alexander and H. Weller, J. Phys. Chem. B., 2002, 106, 7177–7185 Search PubMed.
- Chao Wang, Xue Gao, Qiang Ma and Xingguang Su, J. Mater. Chem., 2009, 19, 7016–7022 RSC.
- D. J. Norris, N. Yao, F. T. Charnock and T. A. Kennedy, Nano Lett., 2001, 1, 3–7 CrossRef CAS.
- W. Yu William, Emmanuel Chang, C. Falkner Joshua, Junyan Zhang, M. Al-Somali Ali, M. Sayes Christie, Judah Johns, Drezek Rebekah and L. Colvin Vicki, J. Am. Chem. Soc., 2007, 129, 2871–2879 CrossRef.
- Hong Ding, Ken-Tye Yong, Wing-Chueng Law, Indrajit Roy, Rui Hu, Fang Wu, Weiwei Zhao, Kun Huang, Erogbogbo Folarin, J. Bergey Earl and N. Prasad Paras, Nanoscale, 2011, 3, 1813–1822 RSC.
- S. C. Abrahams and J. L. Bernstein, J. Chem. Phys., 1973, 59, 5415–5422 CrossRef CAS.
| This journal is © The Royal Society of Chemistry 2012 |

