Electrochemical growth of gold nanostructures on carbon paper for alkaline direct glucose fuel cell†
Sze-Ping
Tung
a,
Ting-Kai
Huang
a,
Chi-Young
Lee
b and
Hsin-Tien
Chiu
*a
aDepartment of Applied Chemistry, National Chiao Tung University, Hsinchu, Taiwan, R. O. C. 30010. E-mail: htchiu@faculty.nctu.edu.tw; Fax: +886- 3-5723764; Tel: +886-3-5131514
bDepartment of Materials Science and Engineering and Center for Nanotechnology, Materials Science, and Microsystems, National Tsing Hua University, Hsinchu, Taiwan, R. O. C., 30043
First published on 5th December 2011
Abstract
Au nanocorals and nanoparticles were grown on carbon papers via a simple two-electrode electrochemical deposition process by reducing HAuCl4 under constant potentials in mixtures containing cetyltrimethylammonium chloride (CTAC) and/or NaNO3. Electrochemical characterizations showed that the nanocoral electrode exhibited high surface area and high electrocatalytic activity towards glucose oxidation in alkaline media. These Au nanostructures were employed as anodes and assembled with anion exchange membranes and Pt cathodes for alkaline direct glucose fuel cell (DGFC) investigations. Open-circuit voltages (OCVs) of the Au nanocoral and nanoparticle electrodes were 0.64 V and 0.61 V, and their maximum power densities were 0.847 mW cm−2 and 0.336 mW cm−2, respectively. The cells showed stable output over 5 h with a small decrease in OCV (6.9%). The electrodes could be refreshed after electrochemical reduction steps.
Introduction
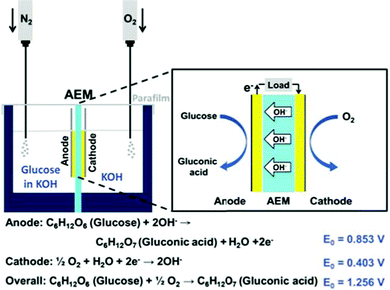
Direct glucose fuel cells (DGFCs) have attracted interests as one of the promising power sources for portable electric devices. This is because the fuel is abundant, cheap, non-toxic and easy to produce and handle.1–7 Recent research found that combining an alkaline electrolyte with anion-exchange membrane (AEM) could enhance the performance of DGFCs by boosting the kinetics of glucose oxidation and oxygen reduction.8,9 Even though platinum-based nanocatalysts have been widely used in low temperature fuel cells for both the anode and the cathode,10–13 there is more and more research focusing on developing low-cost non-platinum group metal (NPGM) catalysts in order to avoid the disadvantages of self-poisoning from CO and other byproducts generated by fuel oxidation.14,15Among them, Au is considered to be a promising NPGM fuel cell catalyst because it is stable and highly active towards glucose oxidation and oxygen reduction in alkaline media.8,16 Previously, we have developed several electrochemical deposition processes to grow gold nanostructures on various substrates.17–19 One of them, Au nanocorals grown on carbon-printed electrodes, with highly exposed Au (110) planes, and a high surface area, showed excellent electrochemical performance for glucose sensing.18 In this study, we wish to fabricate suitable electrodes for DGFC studies by growing the Au nanocorals on carbon papers employing the same electrochemical deposition process. The electrode is employed as the anode in an alkaline medium in the setup shown in Scheme 1. Our findings are discussed below.
Experimental section
Chemicals
HAuCl4·3H2O (Sigma-Aldrich), cetyltrimethylammonium chloride (CTAC, Taiwan Surfactant), NaNO3 (Riedel-de Haën), H2SO4 (J.T. Baker), K3Fe(CN)6 (J.T. Baker), Na2HPO4·2H2O (Sigma-Aldrich), NaH2PO4·H2O (J.T. Baker), KOH (Sigma-Aldrich), D-(+)-Glucose (Sigma-Aldrich), D-(-)-Fructose (Sigma-Aldrich), β-Lactose (Sigma-Aldrich), Sucrose (Sigma-Aldrich), and D-(+)-Maltose monohydrate (Sigma-Aldrich) were used without further purification.Preparation of growth substrates
The carbon papers (GDL 10, SGL Group) composed of carbon fibers were used as the substrates for the growth of gold nanostructures. The SEM image of a carbon paper showing the fibrous structure is displayed in Fig. S1A (ESI†) in the supporting information. The papers were cut into a specific shape shown in Fig. S1B. It contained a 0.4 × 1.0 cm2 and a 1.0 × 1.0 cm2 areas, designed for electrical connection and growth of Au nanostructures, respectively.Growth of gold nanostructures
In a typical reaction, suitable amounts of HAuCl4·3H2O, CTAC and/or NaNO3 were mixed in deionized water. After sonicating the mixture for 5 min, it was placed in a water bath controlled at 290 K. Electrochemical reductions by using a DC power supply was performed in a two-electrode electrochemical cell composed of a carbon paper and a carbon-pasted electrode as the cathode and the anode, respectively. The cell structure is shown in Fig. S2 (ESI†). All of the electrodes were rinsed by deionized water and dried by purging in a stream of N2 before further use. Growth conditions of the gold nanostructures are summarized in Table S1 in the ESI.†Electrode characterizations
The as-prepared samples were investigated by a field emission scanning electron microscope (SEM, JEOL JSM-7491F) at 15 kV, and an X-ray diffractometer (XRD) (D8 ADVANCE, Bruker AXS) with Cu Kα1 radiation. Cyclic voltammetric (CV) experiments were carried out using a CHI 6081C electrochemical potentiostate (CH Instruments Inc.) in a three electrode system that contained a nanostructured gold electrode as the working electrode, a Pt wire as the counter electrode, and a Ag/AgCl half-cell (in 3.00 M KCl) as the reference electrode.Fuel cell assembly and performance
The as-prepared nanostructured gold electrode served as the anode in the fuel cell. The cathode was prepared by immersing the carbon paper in a mixture containing 10% platinum catalyst on active carbon powder (Alfa Aesar) and a Nafion solution (Nafion® 117, Sigma-Aldrich) before it was dried in an oven at 80 °C. The anion exchange membrane (AEM, AMI-7001CR, thickness 0.50 ± 0.025 mm) was purchased from Membrane International Inc. The membrane electrode assembly (MEA), designed to have an active area 1 × 1 cm2, was assembled with the AEM, the anode, and the cathode. The cell setup is displayed in Scheme 1 and Fig. S3 in the ESI.† A deaerated solution containing glucose (0.3 M) and KOH (0.5 M) and an O2–saturated KOH solution (0.5 M) were used as the anodic fuel and the catholyte, respectively. All tests were performed at ambient conditions. The voltage and current responses were measured with a digital multimeter (2410, Keithley Instruments Inc.).Results and discussion
Preparation and characterization of gold nanostructures
Similar processes to fabricate Au nanostructures have been reported.18,19 In this study, the nanostructured Au materials were deposited on carbon paper by reducing HAuCl4 under constant potential in mixtures containing CTAC and/or NaNO3. The growth conditions are summarized in Table S1 (ESI†). Both CTAC and NaNO3 are essential regents to influence the nanostructure growth. The surfactant, CTAC, can act as a capping agent, to reduce the surface energy and to control the growth and the shape of a nanostructure.20–22 Without it, uncontrolled growth produced dendrite structures.23 In addition, the presence of NO3− ions increases the conductivity of the solution and oxidizes less stable Au facets back into AuCl4− ions.24 Therefore, various nanostructures could be grown by combinations of specific concentration and ratio of regents.SEM images of the Au nanocorals grown on the carbon paper are given in Fig. 1. They are uniformly distributed on the carbon fibers as shown in the low-magnification SEM image (Fig. 1A). The structure is a coral-like quasi-one-dimensional nanostructure composed of major stems and branches (Fig. 1B). The width of the coral branches is about 100–200 nm and the thickness of the deposited layer is about 90.6 μm (Fig. S4, ESI†). Layers of the corals provide empty spaces among their branches. This would allow the electrolyte to diffuse into the electrode to increase the electrocatalytic current. In our previous study, we found that the Au nanocorals were polycrystalline with highly exposed Au (110) planes, which exhibited a good ability of glucose electrooxidation.18 For comparison, we also prepared carbon paper electrodes with electrochemically deposited Au nanoparticles (Fig. S5, ESI†) and a sputtered Au film. The particles (50–100 nm) were grown in a mixture containing HAuCl4 and CTAC. The reduction currents employed in the electrochemical depositions of the Au electrodes are shown in Fig. S6 (ESI†. From the data, the weights of Au on the carbon papers were estimated by integrating currents over time. A summary of the deposited weight is listed in Table 1.
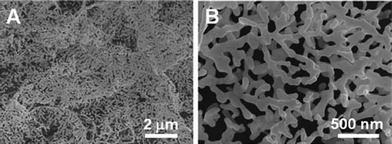 | ||
| Fig. 1 (A) Low- and (B) high-magnification SEM images of Au NCs grown on carbon paper. | ||
| Electrode | Deposition potential (V) | Integrated Current of Au Deposition (C) | Au (μg) | Integrated Current of AuOx Reduction (μC) | RSA (cm2) | RSA per gram (cm2 g−1) |
|---|---|---|---|---|---|---|
| a Not applicable. b Not estimated. | ||||||
| Sputtered Au | N.A.a | N.A.a | —b | 899 | 2.31 | —b |
| Au NPs | 1.8 | 3.49 | 2374 | 5056 | 13.10 | 5517 |
| Au NCs | 1.8 | 4.03 | 2743 | 6866 | 17.79 | 6486 |
Fig. S7 (ESI†) shows the XRD patterns collected from a blank carbon paper, the Au nanoparticles and the nanocorals on carbon papers. The Au nanoparticles and the nanocorals displayed characteristic peaks of the face-centered-cubic (FCC) Au structure at 38.0°, 44.3°, 64.4°, 77.5° and 81.8° (JCPDS 89-3697), which corresponded to the reflections from the planes (111), (200), (220), (331) and (222).
Surface area determination
For electrocatalytic applications, surface areas are an important factor which affect the electrochemical reaction performance. Other factors include, fast transport of electrons and efficient mass transfer of reactants and products.25 Real surface area (RSA) of the Au loading was estimated by calculating the amount of charge consumed during the reduction of the Au surface oxide monolayer.26 Fig. S8 in the ESI† shows the cyclic voltammograms of the Au electrodes employed in this study. The oxidation process at the high potential was due to the formation of Au oxide. The amount of the surface oxide was measured by integrating the oxide reduction peak at 0.9 V in the cathodic scan. Using the literature value of 390 ± 10 μC cm−2 for the surface oxide reduction, we estimated the RSA of the Au nanocoral electrode to be 17.79 cm2. In contrast, the Au nanoparticle and sputtered Au film electrodes exhibited low RSAs, 13.10 and 2.31 cm2, respectively. A summary of the RSA data is listed in Table 1. The specific RSA (RSA per unit weight of gold) of the Au nanocoral electrode was found to be 6486 cm2 g−1, higher than that of the Au nanoparticle electrode (5517 cm2 g−1).Electrocatalytic properties of glucose oxidation on the electrodes
As shown in Fig. 2, electrocatalytic activities of glucose oxidation on the electrodes in an alkaline solution were investigated by cyclic voltammetry (−0.6–0.6 V). Fig. 2A shows the catalytic behavior of the Au nanocorals. In the blank scan, a broad oxidation wave starts at 0.25 V and a reduction current around 0.1 V are attributed to oxidation and reduction of the gold surface, respectively. In addition, tiny redox peaks observed at −0.1 V and −0.2 V are assigned to AuOH active sites formed by chemisorption of OH− anions in alkaline media.27 In the presence of glucose (3 mM), three oxidation peaks (labelled as a, b and c) are observed during the positive scan. Peaks a and b correspond to the oxidation of glucose, in α and β anomeric forms in the solution.28 Peak c at 0.45 V is the oxidation of gluconolactone, a byproduct generated in the processes observed in a and b.29 Further scanning causes oxidation of the gold surface. Consequently, this inhibits the direct electrochemical oxidation of glucose and decreases the current response. In the negative scan, the gold surface oxides are reduced to expose a large number of active sites on the gold surfaces again for direct glucose oxidation. This results in the anodic current peak observed around 0.0 V. For the Au nanoparticle and the sputtered Au film electrodes, the cyclic voltammograms in Fig. 2B and C also show similar characteristics of glucose electrooxidation in the positive and the negative scans.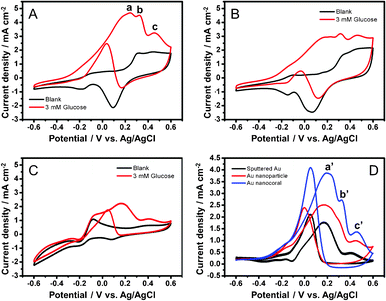 | ||
| Fig. 2 CV diagrams before (black) and after (red) addition of glucose (3 mM) to (A) Au NCs, (B) NPs, and (C) sputtered Au electrodes (0.5 M KOH; scan rate, 50 mV s−1). (D) Responses of glucose oxidation currents after deduction of blank currents. | ||
As shown in Fig. 2A–C, the current responses of the electrodes towards the blank solutions contain both capacitive and redox currents from the chemisorption and desorption of OH− anions. When glucose is added, the current increases are attributed to the glucose electrooxidation process. Hence, to evaluate the currents generated only from the glucose oxidation, we subtracted the blank currents from the currents observed after the additions of glucose. The data are shown in Fig. 2D. Clearly, the oxidation peaks a', b' and c' are seen for the nanocoral electrode can be corresponded to the peaks a, b and c in Fig. 2A. The highest oxidation currents are 3.87 mA cm−2 at 0.20 V for the nanocoral, 2.52 mA cm−2 at 0.17 V for the nanoparticle, and 1.78 mA cm−2 at 0.17 V for the sputtered Au film electrodes, respectively. The current response from the nanocoral is 1.54 times higher than that from the nanoparticle electrode and 2.17 times higher than that from the sputtered Au film electrodes. We define the onset potential when the current density reaches, 0.5 mA cm−2. The onset potential for the three types of electrodes is exhibited at −0.25 V for the nanocorals, −0.22 V for the nanoparticles, and −0.05 V for the sputtered Au film. Clearly, the onset potential of the Au nanocorals shifts more negatively to a lower potential than the others do.
For comparison, we investigated the electrocatalytic activity of glucose oxidation in neutral and acidic solutions. Fig. S9 (ESI†) shows the CV curves of the Au nanocoral electrode in PBS (pH 7.4) and H2SO4 (0.5 M) solutions. The oxidation current of glucose (3 mM) produced 3.44 mA cm−2 at 0.23 V, 73% of the current observed in the alkaline solution. Glucose oxidation did not take place in the acidic solution. In this case, hydrogen evolution was observed below −0.4 V. Therefore, we suggest that the formation of surface AuOH in an alkaline medium is essential to provide the catalytic site for electrocatalytic oxidation of glucose.
Optimization of KOH and glucose concentrations
In order to optimize the cell performance, we carried out experiments to demonstrate the influence of KOH concentrations on the glucose on the oxidation current. Fig. 3A shows the current density responses to the variation of KOH concentrations, from 50 mM to 2 M, in the presence of glucose (3 mM). The data are derived from the CV responses of glucose oxidation obtained in different KOH concentrations (Fig. S10 in the ESI†). In KOH (10 mM), there was no obvious redox current from both the absence and the addition of glucose. With increasing KOH concentration, the corresponding current increases. It reaches the maximum 4.0 mA cm−2 in KOH (0.5 M). The current decreases with further increase in KOH concentration (1.0 M–2.0 M). This suggests that as KOH concentration was increased to 0.5 M, more OH− ions adsorbed on the Au surface to form more catalytic AuOH sites. However, when the KOH concentration was over 0.5 M, the formation of gold oxide passivated the electrodes and decreased the oxidation current responses.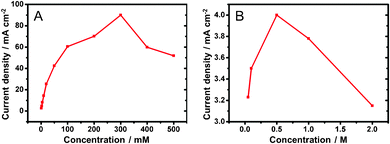 | ||
| Fig. 3 Electro-oxidation current density responses to variations of (A) KOH (3 mM glucose) and (B) glucose (0.5 M KOH) concentrations. | ||
Fig. 3B shows the current density responses in different concentrations of glucose and a constant concentration of KOH (0.5 M), as summarized from the data in Fig. S11 (ESI†). With increasing glucose concentration, the response current increases. It reaches 90.04 mA cm−2 in glucose (0.3 M). Further, increase of glucose concentration causes the oxidation current to decrease. This initial increase of the current is due to the presence of an increased amount of the reactant to decrease the mass transfer barrier. After the maximum performance is achieved, further increase of the reactant concentration becomes ineffective because the electrode surface does not have sufficient active sites for the electrocatalysis. In addition, the byproducts may passivate the electrode surface to decrease its catalytic activity further. Based on the examinations, an optimized condition with glucose (0.3 M) in KOH (0.5 M) was selected as the fuel for DGFC performance test.
Fuel cell performance
The schematic configuration of DGFC is shown in Scheme 1. We used deaerated glucose (0.3 M) in KOH (0.5 M) as the fuel and O2-saturated KOH (0.5 M) as the catholyte. The MEA, with a 1 × 1 cm2 active area, was assembled with an AEM, a Pt cathode and one of the three types of Au electrodes as the anode. Fig. 4A and B show the cell polarization behaviors and the power density curves for the sputtered Au film, the nanoparticle and the nanocoral electrodes. The Au nanocoral electrode shows an open-circuit voltage (OCV) 0.64 V and a short-circuit current density 3.83 mA cm−2. The maximum power density 0.847 mW cm−2 is obtained at 0.31 V. The Au nanoparticle electrode displays a significant current–resistance (IR) drop so that the short-circuit current decreases to 1.61 mA cm−2, even though it has an OCV of 0.61 V, which is close to the nanocoral electrode value. Its maximum power density is 0.336 mW cm−2 at 0.30 V, about 40% of the nanocoral electrode. The sputtered Au film shows the poorest efficiency in all aspects of polarization behavior. The results parallel the CV data. The better performed Au nanocoral electrode is attributed to its high surface area and high electrocatalytic activity for glucose oxidation, which also demonstrated in the former electrochemical experiment. For comparison of the membrane effect, we also employed a commercial cation exchange membrane, Nafion (Alfa Aesar), as the ion-conducting material, together with the Pt cathode and the Au nanocoral anode for the MEA. The result is given in Fig. S12 (ESI†). The polarization curve showed OCV 0.47 V while the maximum power density was 0.341 mW cm−2, only 40% of the power density of the MEA assembled with AEM. The thicknesses of AEM and Nafion are 0.50 ± 0.025 mm and 0.09 mm, respectively. Although AEM is 5.6 times thicker than Nafion, a factor which may decrease its ion-conducting capability, the AEM's performance is still better. The AEM (AMI-7001CR, Membrane International Inc.) is the only commercially available anion conducting membrane we can purchase in the region. We anticipate further improvement of the anion conducting layer may enhance the cell performance more.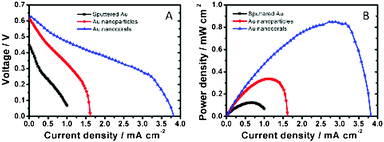 | ||
| Fig. 4 Plots of fuel cell performance showing responses of (A) cell voltage and (B) power density versus current density. | ||
For the durability test, we show the result from a full-discharge experiment at 0.5 mA cm−2 in Fig. 5. An initial potential 0.58 V is provided by the cell. After 5 h, the potential diminishes slightly to 0.54 V, only 6.9% decrease from the initial value. Interestingly, in the second durability test, the output voltage can be recovered from 0.54 V to 0.57 V after the Au nanocoral electrode was processed by linear sweeps from 0.6 V to −0.6 V five times. An average potential 0.52 V is displayed. This result suggests that the passivated gold surface can be refreshed.
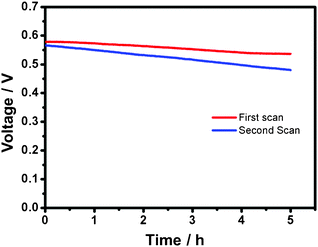 | ||
| Fig. 5 Voltage versus time plots of discharges (0.5 mA) of a cell with fresh (1st scan) and regenerated (2nd scan) electrode surfaces. | ||
Table 2 summarizes the performances of DGFCs from our study and previous reports. It is clear that the OCV and power density values obtained in our study are higher than the other reported ones without using Pt containing catalysts. Consequently, we anticipate that our Au nanocoral electrode will have great potential for further DGFC developments.
| Anode | Cathode | Membrane | Electrolyte | OCV (V) | Pmax (mW cm−2) | Ref. |
|---|---|---|---|---|---|---|
| a Glucose–O2fuel cell. b Glucose–air fuel cell. c Hybrid fuel cell including glucose and hydrogen peroxide. d Biocathode; N/A: No description in the paper; MP: microparticles; C: carbon spheres; CNT: carbon nanotube ABTS: 2,2′-aninobis(3-ethylbenzothiazoline-6-sulfonate)diammonium salt; MP-11: microperoxidase-11. | ||||||
| Au NCsa | Pt | AEM | KOH/0.5 M | 0.64 | 0.847 | This study |
| Au NPsa | Pt | AEM | KOH/0.5 M | 0.61 | 0.336 | This study |
| Au filma | Pt | AEM | KOH/0.5 M | 0.45 | 0.123 | This study |
| Au NPs/Ca | Pt | N/A | KOH/0.3 M | 0.59 | 0.5 | 1 |
| Ag modified Aub | N/A | N/A | NaOH/0.3 M | 0.65 | 0.078 | 2 |
| PtAu/Ca | Laccase/ABTS* | None | PBS | 0.3 | 0.016 | 3 |
| PtRu NPsb | Activated charcoal | None | KOH/1 M | 0.91 | 1.38 | 4 |
| Pt NPs/CNTb | N/A | Nafion | PBS | 0.273 | 0.000768 | 5 |
| Ag MPsb | N/A | None | KOH/1 M | 0.385 | 0.196 | 6 |
| Si c | MP-11 d | None | PBS | 0.28 | 0.0037 | 7 |
Electrocatalytic properties and fuel cell performance for other saccharides
In principle, in addition to glucose, other saccharides can be used as the anodic fuels. In order to determine which one may also provide comparable cell efficiency, we examined the oxidation currents from some monosaccharides and disaccharides in the same MEA with the Au nanocoral electrode in KOH (0.5 M). The cyclic voltammograms are shown in Fig. S13 (ESI†). The oxidation of other saccharides in alkaline media may be similar to the oxidation of glucose, which involves the breaking of the H atom bond to the carbon C1 atom.27 Unlike glucose, fructose does not have the H atom bound to the C1 atom. It was generally accepted that gold catalysts were not able to oxidize fructose.27 Thus, we were surprised to observe the CV response of fructose oxidation shown in Fig. S13B (ESI†). We suggest that the electrocatalysis of fructose may pass through a process different from the one of glucose.Sucrose, lactose and maltose are disaccharides formed from fructose with glucose, galactose with glucose and two units of glucose, respectively. All three types of disaccharides gave similar peak oxidation potentials around 0.2 V and 0.05 V, as shown in Fig. S13C, D and E (ESI†). For the oxidation of the hexodes on a gold catalyst, it had already been reported that glucose displays higher activity than galactose and fructose.27,30 Thus, the current responses of sucrose and lactose are dominated by the glucose portion on these disaccharides. Maltose shows relatively high electrocatalytic activity and oxidation current, because it consists of two molecules of glucose. Therefore, maltose was selected as a promising anodic fuel for further fuel cell tests.
The fuel cell performance is shown in Fig. S14 (ESI†). The polarization curve shows an OCV 0.65 V and a short-circuit current density 5.70 mA cm−2. Although maltose presented high short-circuit current density, there was an apparent IR drop which caused the maximum power density to be only 0.834 mW cm−2. The value is slightly lower than the result of glucose, 0.847 mW cm−2. Maltose is derived from two units of glucose joined with an α (1→4′) linkage. During the oxidation process, the C1–C4, bond was cleaved and generated a large amount of byproducts, e.g.glucose, gluconic acid, formic acid, glycolic acid.31 The complex mixture of the byproducts may adsorb on the electrode surface to cause poisoning problems and increase the internal resistance of the MEA.
Conclusion
A simple electrochemical deposition method has been developed to grow gold nanocorals on carbon paper. It exhibits high surface area and high electrocatalytic properties for glucose oxidation. The best performance of the DGFC assembled using gold nanocorals as the anode, Pt nanoparticles on carbon paper as the cathode, and AEM as the ion-conducting material, shows the OCV to be 0.64 V with a maximum power density 0.847 mW cm−2 in glucose (0.3 M) and KOH (0.5 M). For the durability test, the voltage from this MEA decreases only by 6.9% in five hours. The Au nanocoral electrode can be refreshed by linear sweeps (0.6 V to −0.6 V) for five times. Our observations suggest that the Au nanocoral electrode can perform better than most of the glucose fuel cells employing NPGM containing anodes reported in the literature. Furthermore, we have examined the possibility of employing other saccharides, including fructose, lactose, sucrose and maltose, as anodic fuels. Among them, maltose appears to be promising. Its polarization curve shows an OCV of 0.65 V and a short-circuit current density of 5.70 mA cm−2. We anticipate further improvement of our MEA, such as looking for a more suitable AEM, improving the catalyst efficiency, and employing various saccharides as the fuels will increase the performance. Research is in progress.Acknowledgements
We thank the supports from the National Science Council, “Aim for the Top University Plan” of the National Chiao Tung University, and the Ministry of Education of Taiwan, the Republic of China. Also, we thank Dr Ming-Yu Yen and Toplus Energy Corporation for fuel cell assistance.References
- M. Guerra-Balcazar, D. Morales-Acosta, F. Castaneda, J. Ledesma-Garcia and L. G. Arriaga, Electrochem. Commun., 2010, 12, 864–867 CrossRef CAS.
- C. C. Jin and I. Taniguchi, Mater. Lett., 2007, 61, 2365–2367 CrossRef CAS.
- A. Habrioux, E. Sibert, K. Servat, W. Vogel, K. B. Kokoh and N. Alonso-Vante, J. Phys. Chem. B, 2007, 111, 10329–10333 CrossRef CAS.
- D. Basu and S. Basu, Electrochim. Acta, 2010, 55, 5775–5779 CrossRef CAS.
- J. Ryu, H. S. Kim, H. T. Hahn and D. Lashmore, Biosens. Bioelectron., 2010, 25, 1603–1608 CrossRef CAS.
- P. Schechner, E. Kroll, E. Bubis, S. Chervinsky and E. Zussman, J. Electrochem. Soc., 2007, 154, B942–B948 CrossRef CAS.
- Y. K. Choi, G. Wang, M. H. Nayfeh and S. T. Yau, Biosens. Bioelectron., 2009, 24, 3103–3107 CrossRef CAS.
- R. W. Zurilla, R. K. Sen and E. Yeager, J. Electrochem. Soc., 1978, 125, 1103–1109 CrossRef CAS.
- T. Yano, D. A. Tryk, K. Hashimoto and A. Fujishima, J. Electrochem. Soc., 1998, 145, 1870–1876 CrossRef CAS.
- W. Z. Li, C. H. Liang, W. J. Zhou, J. S. Qiu, Z. H. Zhou, G. Q. Sun and Q. Xin, J. Phys. Chem. B, 2003, 107, 6292–6299 CrossRef CAS.
- Z. L. Liu, X. H. Lin, J. Y. Lee, W. Zhang, M. Han and L. M. Gan, Langmuir, 2002, 18, 4054–4060 CrossRef CAS.
- S. Mukerjee, S. Srinivasan, M. P. Soriaga and J. McBreen, J. Electrochem. Soc., 1995, 142, 1409–1422 CrossRef CAS.
- U. A. Paulus, T. J. Schmidt, H. A. Gasteiger and R. J. Behm, J. Electroanal. Chem., 2001, 495, 134–145 CrossRef CAS.
- E. Herrero, A. Fernandezvega, J. M. Feliu and A. J. Aldaz, J. Electroanal. Chem., 1993, 350, 73–88 CrossRef CAS.
- P. Waszczuk, A. Wieckowski, P. Zelenay, S. Gottesfeld, C. Coutanceau, J. Leger and C. J. Lamy, J. Electroanal. Chem., 2001, 511, 55–64 CrossRef CAS.
- S. Biella, G. L. Castiglioni, C. Fumagalli, L. Prati and M. Rossi, Catal. Today, 2002, 72, 43–49 CrossRef CAS.
- T.-K. Huang, Y.-C. Chen, H.-C. Ko, H.-W. Huang, C.-H. Wang, H.-K. Lin, F.-R. Chen, J.-J. Kai, C.-Y. Lee and H.-T. Chiu, Langmuir, 2008, 24, 5647–5649 CrossRef CAS.
- T.-M. Cheng, T.-K. Huang, H.-K. Lin, S.-P. Tung, Y.-L. Chen, C.-Y. Lee and H.-T. Chiu, ACS Appl. Mater. Interfaces, 2010, 2, 2773–2780 CAS.
- Y.-C. Yang, T.-K. Huang, Y.-L. Chen, J. Y. Mevellec, S. Lefrant, C.-Y. Lee and H.-T. Chiu, J. Phys. Chem. C, 2011, 115, 1932–1939 CAS.
- B. Nikoobakht and M. A. El-Sayed, Langmuir, 2001, 17, 6368–6374 CrossRef CAS.
- D. V. Leff, P. C. Ohara, J. R. Heath and W. M. Gelbart, J. Phys. Chem., 1995, 99, 7036–7041 CrossRef CAS.
- J. X. Gao, C. M. Bender and C. J. Murphy, Langmuir, 2003, 19, 9065–9070 CrossRef CAS.
- K. Fukami, S. Nakanishi, H. Yamasaki, T. Tada, K. Sonoda, N. Kamikawa, N. Tsuji, H. Sakaguchi and Y. J. Nakato, J. Phys. Chem. C, 2007, 111, 1150–1160 CAS.
- T. Herricks, J. Y. Chen and Y. N. Xia, Nano Lett., 2004, 4, 2367–2371 CrossRef CAS.
- A. J. Bard and L. R. Faulkner, Electrochemical Methods: Fundamentals and Applications; 2nd ed.; John Wiley & Sons, Inc.: New York, 2001 Search PubMed.
- S. Trasatti and O. A. Petrii, Pure Appl. Chem., 1991, 63, 711–734 CrossRef CAS.
- M. W. Hsiao, R. R. Adzic and E. B. Yeager, J. Electrochem. Soc., 1996, 143, 759–767 CrossRef CAS.
- F. Largeaud, K. B. Kokoh, B. Beden and C. Lamy, J. Electroanal. Chem., 1995, 397, 261–269 CrossRef.
- M. Tominaga, T. Shimazoe, M. Nagashima and I. Taniguchi, Electrochem. Commun., 2005, 7, 189–193 CrossRef CAS.
- A. Mirescu and U. Prusse, Appl. Catal., B, 2007, 70, 644–652 CrossRef CAS.
- P. Parpot, V. P. Muiuane, V. Defontaine and A. P. Bettencourt, Electrochim. Acta, 2010, 55, 3157–3163 CrossRef CAS.
Footnote |
| † Electronic Supplementary Information (ESI) available: SEM images, diagram of electrodeposition system, photos of the cell, XRD patterns, variations of reduction current versus time, CV diagrams, and fuel cell performance plots. See DOI: 10.1039/c1ra00611h/ |
| This journal is © The Royal Society of Chemistry 2012 |

