DOI:
10.1039/C1RA00595B
(Paper)
RSC Adv., 2012,
2, 1009-1013
Periodical structural conversion and its mechanism in hematite: from nanospindles, to nanotubes, to nanotires†
Received
16th August 2011
, Accepted 11th October 2011
First published on 1st December 2011
Abstract
By employing a high throughput method under hydrothermal conditions, nanospindles, nanotubes, nanotires, and nanospindles, occurring periodically in hematite with increasing reaction time, were investigated. A formation–dissolution–reformation mechanism of periodical structural conversion during the growth process was put forward based on X-ray diffraction (XRD), scanning electron microscopy (SEM), transmission electron microscopy (TEM), and high-resolution transmission electron microscopy (HRTEM). Phosphate ions play an important role in converting nanostructures of hematite from nanospindles, to nanotubes, to nanotires, owing to their selective adsorption on the different crystallographic planes of hematite and the coordination effect with Fe3+. The mesophase of Fe4(PO4)3(OH)3 balances the concentration of OH− anions and determines the dissolution and reformation process of the subsequent reactions. Thus, the morphology transition from nanotires to nanospindles takes place, and the periodical structural conversion phenomenon occurs. The results from magnetic measurements indicated that the nanostructures observed herein did not show a Morin transition between 2 and 350 K.
1. Introduction
Hematite (α-Fe2O3), as an n-type semiconductor (Eg = 2.1 eV),1 is environmentally friendly, nontoxic, weakly ferromagnetic, thermally stable, corrosion resistant and easily obtainable. The extensive applications of α-Fe2O3 have been demonstrated in the production of catalysts,2 sensors,3 pigments,4 and semiconductors.5 To date, α-Fe2O3 nanostructures have been synthesized by utilizing numerous techniques, including chemical precipitation,6 sol–gel processing,7 micro-emulsion,8 forced hydrolysis,9 and hydrothermal synthesis (HTS).10 HTS is one of the best methods to control the size and shape of nanoparticles under various conditions (temperature, pressure and reaction time). In addition, continuous and high-throughput HTS has become a cheap and convenient method for commercial nanoscale production.11–14
Stimulated by both the promising applications of iron oxides and the novel properties of nanoscale materials, considerable efforts have been made in the synthesis of hematite one-dimensional (1D),1,15 particle-like,16 plate-shaped,17 acicular,18 airplane-like,19 shuttle-like,20 and flower-like superstructures,21hematite nanotubes,22 tube-in-tube nanostructures,23 and hollow spheres.24 However, it remains a challenge to fabricate nanoscale hematite with more distinct morphologies and with periodically convertible structure under changeable time conditions.
In this paper, we report a viable and controllable synthesis of multiple hematite nanostructures (nanospindles, nanotubes, and nanotires) by a conventional hydrothermal procedure. Interestingly, nanospindles, nanotubes, nanotires, and nanospindles were generated periodically as the reaction time increased. The morphologies of the hematite nanostructures, such as filled nanospindles, obtuse nanospindles, concave nanospindles, nanotubes and nanotires, are characterized in detail. A periodical structural conversion mechanism is proposed according to various evidence. Magnetic properties of the as-synthesized products are studied using a superconducting quantum interface device magnetometer.
2. Experimental section
The solution, prepared by mixing 3 ml 0.5 mol l−1iron chloride (FeCl3) aqueous solution with 3 ml 0.02 mol l−1 salt solution (NH4)2HPO4, was stirred for ten minutes at room temperature. Then, during the stirring process, distilled water was added to achieve a final volume of 60 ml solution. The solution was transferred into a 100 ml Teflon-lined stainless-steel autoclave and heated at 220 °C for different reaction times. After the treatment, precipitates were collected by centrifugation, washed with distilled water and absolute ethanol several times, and dried in air at 70 °C for 4 h. The parameters essential for the different morphology formation and its mechanism were examined by increasing the reaction time from 3 to 84 h to illustrate the periodical morphology evolution.
X-Ray powder diffraction analysis was conducted to identify and estimate hematite phase formation on a Rigaku D/max-rA X-ray diffractometer at a step width of 0.02° with 2θ ranging from 10 to 80°, equipped with a rotating anode and a Cu-Kα1 radiation source (λ = 1.5406 Å). To observe the morphologies and nanoparticle sizes of hematite nanospindles, nanotubes and nanotires, electron microscopy images were collected with a field emission scanning electron microscope (JEOL JSM-6700F) and a transmission electron microscope (JEOL-2010, 200 kV), as well as using high-resolution transmission electron microscopy (HRTEM) and selected area electron diffraction (SAED). The HRTEM and SAED were performed with a field emission gun (FEG) JEOL 2010F microscope. Magnetic measurements of the products were carried out using a superconducting quantum interface device magnetometer (Quantum Design MPMS-XL7).
3. Results and discussion
3.1 Recurring formation of nanospindles, nanotubes and nanotires
The XRD patterns of the as-synthesized products (Fig. 1) are in good agreement with that of hematite in the literature (JCPDS card No. 33-0664), confirming that the nanospindles, nanotubes and nanotires are all the hexagonal α-Fe2O3. It is interesting to note that other apparent peaks are also identified for the reaction times of 48, 60 and 84 h, indicating that there exists a compound phase Fe4(PO4)3(OH)3 (JCPDS card No. 42-0429) alongside the main α-Fe2O3 phase at some specific growth stages.
![Comparison of XRD patterns of the hematite products prepared at 220 °C during different reaction times. [FeCl3] = 0.5 mol l−1, [(NH4)2HPO4] = 0.02 mol l−1.](/image/article/2012/RA/c1ra00595b/c1ra00595b-f1.gif) |
| | Fig. 1 Comparison of XRD patterns of the hematite products prepared at 220 °C during different reaction times. [FeCl3] = 0.5 mol l−1, [(NH4)2HPO4] = 0.02 mol l−1. | |
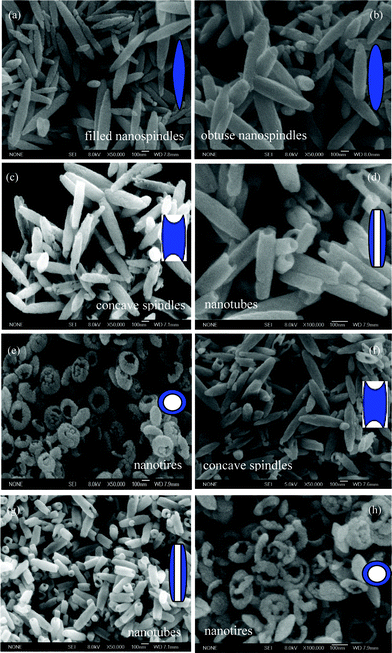
SEM images and schematic inset representations of the nanoparticles prepared at 220 °C for the different reaction times are provided in Fig. 2. A rich variation of morphologies, including filled nanospindles, obtuse nanospindles, concave nanospindles, nanotubes, and nanotires are observed successively with the reaction time increasing from 3 to 48 h (Fig. 2a–e). Interestingly, nanospindles, nanotubes, and nanotires recur with the reaction times of 60, 72 and 84 h (Fig. 2f–h), respectively, indicating the obviously periodical morphology evolution during the process of hematite fabrication, with a cycle time of 36 h.
 |
| | Fig. 2
SEM images of the products prepared at 220 °C for (a) 3 h, (b) 12 h, (c) 24 h, (d) 36 h, (e) 48 h, (f) 60 h, (g) 72 h, and (h) 84 h. The insets correspond to schematic representations. | |
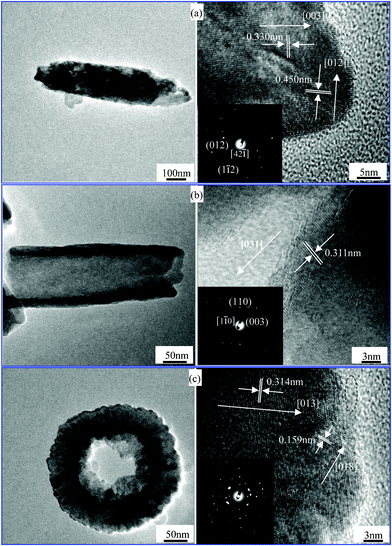
TEM investigations were employed to gain further insight into the hematite nanostructures of the products prepared at 220 °C for 60 h, 72 h and 84 h. TEM and HRTEM images of these hematite nanostructures and their inset SAED patterns are shown in Fig. 3. Three recurring morphologies of hematite nanospindles, nanotubes and nanotires are shown in the left of Fig. 3 and the high single-crystallinity of this series of products is represented by lattice fringes of nanostructures in the right of Fig. 3. These spindle-like nanostructures grow along the [001] direction (Fig. 3a) in view of the lattice spacing of 0.330 nm for the (003) planes of the rhombohedral hematite structure along the longitudinal axis. Notably, the nanotube wall along the [031] direction with 0.311 nm interplanar spacing is shown in Fig. 3b. The SAED pattern in Fig. 3c is more complicated than that of pure hematite in Fig. 3a–b. It is identified that, from the 0.233 nm fringe spacing within the dash ellipse from the HRTEM image in Fig. 3c, the Fe4(PO4)3(OH)3 phase was generated for the reaction time of 84 h. This result is in good agreement with the XRD result in the previous section (Fig. 1g).
 |
| | Fig. 3
TEM and HRTEM images of the products prepared at 220 °C for (a) 60 h, (b) 72 h, (c) 84 h; SAED images are shown in the insets of (a)–(c), respectively. | |
3.2 Mechanism of nanostructure formation and the periodical structural conversion
Based on the characteristics of the corundum structure with a close-packed lattice for the hematite crystal (Fig. 4a), it is quite different for the surface hydroxyl group configuration of the various crystallographic planes such as (100), (110) and (001) of hematite.25 The surface hydroxyl functions are all doubly coordinated for the (001) planes, whereas singly coordinated surface hydroxyl groups are present for other planes that commonly occur at the surface of natural and artificial hematite crystals, such as the (100) and (110) planes. Hence, the adsorption capacities and affinities for phosphate to hematite of the (100) and (110) planes are much higher than those for the (001) planes.26 However, the adsorbed phosphate ions can prevent further reactions on the (100) and (110) planes and promote the hematite growth along the long axis [001]. This structural factor contributes to the initial formation of the spindle-like nanoparticles.
![(a) Structural characteristics of α-Fe2O3 viewed along [010]; (b) schematic illustration of the recurring formation process.](/image/article/2012/RA/c1ra00595b/c1ra00595b-f4.gif) |
| | Fig. 4 (a) Structural characteristics of α-Fe2O3 viewed along [010]; (b) schematic illustration of the recurring formation process. | |
With increasing reaction time, the dissolution mechanism during the growth process of the hematite products has been put forward in a previous study.27 The spindle-like precursors (Fig. 2a) were gradually dissolved from the tips toward the interior along the long axis [001], resulting in a sequential formation of obtuse nanospindles, concave nanospindles, nanotubes and nanotires (Fig. 2b–e). The selective adsorption of phosphate ions, which are generated during the reaction process, on the different crystallographic planes of hematite as well as their coordination effect with Fe3+, induces the preferential dissolution of the hematite spindle precursors along the long axis [001] from the tips down to the interior. As a result, nanotubes, and nanotires of hematite are fabricated one by one with increasing reaction time. The following reactions from [eqn (1)] to [eqn (6)] take place:27
| | | H2O + HPO2−4 ↔ OH− + H2PO−4 | (1) |
| | | H2O + H2PO−4 ↔ OH− + H3PO4 | (2) |
| | | 2Fe(OH)3 ↔ Fe2O3 + 3H2O | (4) |
| | | Fe2O3 + 6H+ ↔ 2Fe3+ + 3H2O | (5) |
| | | Fe3+ + HPO2−4 ↔ [Fe(HPO4)]+ | (6) |
| | | Fe3+ + 3[Fe(HPO4)]+ + 3OH− ↔ Fe4(PO4)3(OH)3 + 3H+ | (7) |
As the nanotires are fabricated, the reduced concentration of OH− anions promotes both eqn (7) and (5) toward the left-hand side, which weakens the dissolution of the nanotires. Thus, the spindle-like nanostructures of hematite are reproduced along the [001] axis for a long reaction time of 60 h (Fig. 2f). As the reaction time increases, the concentration of OH− anions increases and beyond a critical value, which enables both eqn (6) and (4) to move toward the right-hand side. Thereafter, the dissolution process dominates so that nanotubes (Fig. 2g) as well as nanotires (Fig. 2h) occur again. It should be noted that the dissolution mechanism of spindle-like nanostructures after 60 h cannot be interpreted by the previous H+ attacking process,27 but by the varied concentration of OH− anions during the reaction process. A schematic illustration of the recurring formation process is shown in Fig. 4b.
3.3 Magnetic properties
Fig. 5 shows the magnetic behavior of the multiple α-Fe2O3 nanostructures which are prepared by hydrothermal treatment at 220 °C for 3 h, 24 h and 36 h (Fig. 1 and 2a, c, and d). Generally, the Morin transition of bulk hematite from the low-temperature antiferromagnetic (AFM) phase to a weakly ferromagnetic (FM) phase at 260 K occurs.28–30 The decrease in Morin transition temperature (TM) has usually been observed in nanocrystalline α-Fe2O3 due to crystallinity and surface properties.31–33,21a The variable-temperature (2∼350 K) magnetization (Fig. 5c–e) displays the characteristic behavior for α-Fe2O3 without a TM, which is determined by the sharp peak in the dχ/dT curves (in our case, no sharp peak available, see insets). This behavior was also verified from the previous literature.34–37 The hysteresis loops at both 300 and 20 K (Fig. 5a and b) confirm the absence of an AFM state, indicating the same magnetic state, but the magnetization parameters (e.g. coercivity, magnetization, and remnant magnetization) are larger in the case of 20 K. The coercivities for concave nanospindles, filled spindle-like nanostructures and tubular hematite are 960, 720 and 200 Oe at 300 K and 1820, 1610 and 1040 Oe at 20 K, respectively. The concave nanospindles have the maximum coercivity values at either 300 K or 20 K. This might be caused by the different shape anisotropy.38,21a
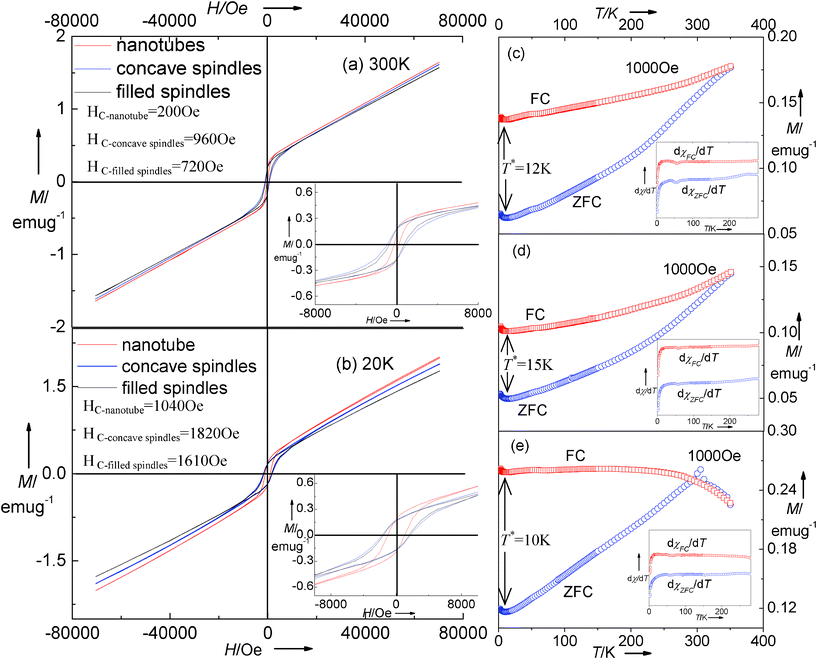 |
| | Fig. 5 Magnetic hysteresis loops of as-synthesized hematite measured at (a) 300 K and (b) 20 K. The insets are the magnified magnetic hysteresis loops. ZFC/FC magnetization curves of as-synthesized (c) filled spindle-like, (d) concave spindle-like and (e) tubular hematite measured at 1000 Oe. The insets are the dχ/dT versus T curves. | |
The temperature T*, marked in the cryogenic interval in the ZFC/FC curves (see Fig. 5c–e), demonstrates the presence of low-temperature magnetic phase transformations in the structures,39–42 which has also been observed in nanocrystals due to surface spin disorder.39 The non-saturated characteristic of the magnetization in Fig. 5a and b as well as clusters adsorbed on the particle surface would induce the disorder surface spins.40 On the contrary, the surface spins become ordered, and the magnetization accordingly increases because the ever-increasing exchange interaction among each particle dominates at a sufficiently low temperature. It should be noted that T* is in relation with the hematite morphologies ( ), which maintains the same variation tendency as that of the coercivities.
4. Conclusion
Nanospindles, nanotubes, and nanotires of hematite were synthesized by a facile, one-step hydrothermal method. By increasing the reaction time, a recurring structural conversion from nanospindles, to nanotubes, to nanotires is observed. Based on the evidence and analysis of electron microscope images (SEM, TEM, HRTEM and SAED) and XRD results, a periodic formation–dissolution–reformation mechanism is proposed. The selective adsorption of phosphate ions on the different crystallographic planes of hematite and their coordination effect with Fe3+ are key factors for the structural conversion from nanospindles, to nanotubes, to nanotires. The formation of Fe4(PO4)3(OH)3, which is vital to the periodical morphology evolution, balances the concentration of OH− anions and determines the dissolution and reformation process of the subsequent reactions. Then nanospindles recur and are converted from nanotires, and a periodical structural conversion phenomenon occurs. All the as-synthesized products illustrate a magnetic phase transformation at extremely low temperatures, and show no apparent Morin transition in the range 2∼350 K.
Acknowledgements
We would like to express our deep gratitude to Shijiang Liu for performing the magnetic characterization of the samples. The authors are grateful for the financial aid from the National Natural Science Foundation of China (NSFC No. 51072086).
References
- X. G. Wen, S. H. Wang, Y. Ding, Z. L. Wang and S. H. Yang, J. Phys. Chem. B, 2005, 109, 215 CrossRef CAS
 .
.
-
(a) B. C. Faust, M. R. Hoffmann and D. W. Bahnemann, J. Phys. Chem., 1989, 93, 6371 CrossRef CAS ;
(b) A. S. S. Brown, J. S. J. Hargreaves and B. Rijniersce, Catal. Lett., 1998, 53, 7 CrossRef CAS ;
(c) S. Y. Lian, E. B. Wang, L. Gao, D. Wu, Y. L. Song and L. Xu, Mater. Res. Bull., 2006, 41, 1192 CrossRef CAS .
-
(a) L. H. Huo, Q. Li, H. Zhao, L. J. Yu, S. Gao and J. G. Zhao, Sens. Actuators, B, 2005, 107, 915 CrossRef ;
(b) J. Chen, L. Xu, W. Li and X. Gou, Adv. Mater., 2005, 17, 582 CrossRef CAS ;
(c) J. S. Han, T. Bredow, D. E. Davey, A. B. Yu and D. E. Mulcahy, Sens. Actuators, B, 2001, 75, 18 CrossRef ;
(d) H. T. Sun, C. Cantalini, M. Faccio, M. Pelino, M. Catalano and L. Tapfer, J. Am. Ceram. Soc., 1996, 79, 927 CrossRef CAS .
-
R. M. Cornell and U. Schwertmann, The Iron Oxides. Structure, Properties, Reactions, Occurrence and Uses, VCH, Weinheim, 1996, p. 464 Search PubMed .
- Y. C. Lee, Y. L. Chueh, C. H. Hsieh, M. T. Chang, L. J. Chou, Z. L. Wang, Y. W. Lan, C. D. Chen, H. Kurata and S. Isoda, Small, 2007, 3, 1356 CrossRef CAS .
- R. D. Zysler, M. Vasquez-Mansilla, C. Arciprete, M. Dimitrijewits, D. Rodriguez-Sierra and C. Saragovi, J. Magn. Magn. Mater., 2001, 224, 39 CrossRef CAS .
- X. Q. Liu, S. W. Tao and Y. S. Shen, Sens. Actuators, B, 1997, 40, 161 CrossRef .
- D. O. Yener and H. Giesche, J. Am. Ceram. Soc., 2001, 84, 1987 CrossRef CAS .
- Q. Li and Y. Wei, Mater. Res. Bull., 1998, 33, 779 CrossRef CAS .
- X. Liu, G. Qiu, A. Yan, Z. Wang and X. Li, J. Alloys Compd., 2007, 433, 216 CrossRef CAS .
- E. Lester, P. Blood, J. Denyer, D. Giddings, B. Azzopardi and M. Poliakoff, J. Supercrit. Fluids, 2006, 37, 209 CrossRef CAS .
- C. Xu and C. X. Teja, J. Supercrit. Fluids, 2008, 44, 85 CrossRef CAS .
- T. P. Caremans, C. E. A. Kirschhock, P. Verlooy, J. S. Paul, P. A. Jacobs and J. A. Martens, Microporous Mesoporous Mater., 2006, 90, 62 CrossRef CAS .
- N. Stock and T. Bein, Solid State Sci., 2003, 5, 1207 CrossRef CAS .
-
(a) Y. L. Chueh, M. W. Lai, J. Q. Liang, L. J. Chou and Z. L. Wang, Adv. Funct. Mater., 2006, 16, 2243 CrossRef CAS ;
(b) C. Pascal, J. L. Pascal, F. Favier, M. L. E. Moubtassim and C. Payen, Chem. Mater., 1999, 11, 141 CrossRef CAS ;
(c) Y. Zhu, J. C. Zhang, J. Zhai and L. Jiang, Thin Solid Films, 2006, 510, 271 CrossRef CAS .
-
(a) X. Liang, X. Wang, J. Zhuang, Y. T. Chen, D. S. Wang and Y. D. Li, Adv. Funct. Mater., 2006, 16, 1805 CrossRef CAS ;
(b) K. K. Sahu, C. Rath, N. C. Mishra, S. Anand and R. P. Das, J. Colloid Interface Sci., 1997, 185, 402 CrossRef .
- Y. Ni, X. Ge, Z. Zhang and Q. Ye, Chem. Mater., 2002, 14, 1048 CrossRef CAS .
- L. Suber, D. Fiorani, P. Imperatori, S. Foglia, A. Montone and R. Zysler, Nanostruct. Mater., 1999, 11, 797 CrossRef CAS .
- S. Z. Li, H. Zhang, J. B. Wu, X. Y. Ma and D. R. Yang, Cryst. Growth Des., 2006, 6, 351 CAS .
-
(a) A. T. Ngo and M. P. Pileni, J. Appl. Phys., 2002, 92, 4649 CrossRef CAS .
-
(a) M. H. Cao, T. F. Liu, S. Gao, G. B. Sun, X. L. Wu, C. W. Hu and Z. L. Wang, Angew. Chem., 2005, 117, 4269 CrossRef ;
(b) L. P. Zhu, H. M. Xiao, X. M. Liu and S. Y. Fu, J. Mater. Chem., 2006, 16, 1794 RSC .
- S. B. Wang, Y. L. Min and S. H. Yu, J. Phys. Chem. C, 2007, 111, 3551 CAS .
- C. J. Jia, L. D. Sun, Z. G. Yan, Y. C. Pang, L. P. You and C. H. Yan, J. Phys. Chem. C, 2007, 111, 13022 CAS .
- L. L. Li, Y. Chu, Y. Liu and L. H. Dong, J. Phys. Chem. C, 2007, 111, 2123 CAS .
- V. Barrón and J. Torrent, J. Colloid Interface Sci., 1996, 177, 407 CrossRef .
- X. Huang, J. Colloid Interface Sci., 2004, 271, 296 CrossRef CAS .
- C. T. Liu, J. Ma and Y. L. Liu, Sci. China Chem., 2011, 54, 1607 CrossRef CAS .
- F. J. Morin, Phys. Rev., 1950, 78, 819 CrossRef CAS .
- C. G. Shull, W. A. Strauser and E. O. Wollan, Phys. Rev., 1951, 83, 333 CrossRef CAS .
- P. J. Besser, A. H. Morrish and C. W. Searle, Phys. Rev., 1967, 153, 632 CrossRef CAS .
- N. Amin and S. Arajs, Phys. Rev. B, 1987, 35, 4810 CrossRef CAS .
- L. R. Meng, W. M. Chen, C. P. Chen, H. P. Zhou, Q. Peng and Y. D. Li, Cryst. Growth Des., 2010, 10, 479 CAS .
- D. Schroeer and R. C. Nininger, Phys. Rev. Lett., 1967, 19, 632 CrossRef CAS .
- R. D. Zysler, D. Fiorani and A. M. Testa, J. Magn. Magn. Mater., 2001, 224, 5 CrossRef CAS .
- W. Kündig, H. Bömmel, G. Constabaris and R. H. Lindquist, Phys. Rev., 1966, 142, 327 CrossRef .
- F. Bødker, M. F. Hansen, C. B. Koch, K. Lefmann and S. Mørup, Phys. Rev. B: Condens. Matter, 2000, 61, 6826 CrossRef .
- Y. Y. Xu, X. F. Rui, Y. Y. Fu and H. Zhang, Chem. Phys. Lett., 2005, 410, 36 CrossRef CAS .
- T. P. Raming, A. J. A. Winnubst, A. C. M. van Kats and A. P. Philipse, J. Colloid Interface Sci., 2002, 249, 346 CrossRef CAS .
- Y. H. Gao, Y. P. Bao, M. Beerman, A. Yasuhara, D. Shindo and K. M. Krishnan, Appl. Phys. Lett., 2004, 84, 3361 CrossRef CAS .
- A. E. Berkowitz, J. A. lahut, I. S. Jacobs, L. M. Levinson and D. W. Forester, Phys. Rev. Lett., 1975, 34, 594 CrossRef CAS .
- R. H. Kodama, A. E. Berkowitz, E. J. McNiff and S. Foner, Phys. Rev. Lett., 1996, 77, 394 CrossRef CAS .
- Y. M. Zhao, C. W. Dunnill, Y. Q. Zhu, D. H. Gregory, W. Kockenberger, Y. H. Li, W. B. Hu, I. Ahmad and D. G. McCartney, Chem. Mater., 2007, 19, 916 CrossRef CAS .
Footnote |
| † Electronic supplementary information (ESI) available: TEM images of the products prepared at 220 °C. See DOI: 10.1039/c1ra00595b |
|
| This journal is © The Royal Society of Chemistry 2012 |
Click here to see how this site uses Cookies. View our privacy policy here.