Bioaugmentation of an electrochemically active strain to enhance the electron discharge of mixed culture: process evaluation through electro-kinetic analysis
S. Veer
Raghavulu
,
P. Suresh
Babu
,
R. Kannaiah
Goud
,
G. Venkata
Subhash
,
S.
Srikanth
and
S. Venkata
Mohan
*
Bioengineering and Environmental Centre (BEEC), Indian Institute of Chemical Technology (CSIR-IICT), Hyderabad, 500 607, India. E-mail: vmohan_s@yahoo.com; Tel: 0091-40-27191664
First published on 18th November 2011
Abstract
The functional role of electrochemically active bacteria (EAB), Shewanella haliotis ATCC 49138 as biocatalyst for bioaugmentation onto anodic native microflora (anaerobic) was evaluated to enhance the electrogenic activity of microbial fuel cell (MFC). Fuel cell operation with S. haliotis (MFC-S) alone as anodic biocatalyst showed relatively higher power output (295 mV; 2.13 mA at 100 Ω) than mixed culture (MFC-M; 233 mV; 1.35 mA at 100 Ω) which might be attributed to the higher electron discharge capability of the EAB. Cyclic voltammetry profiles and Tafel slope analysis documented significant variation in bio-electrochemical behaviour and electro-kinetic aspects of fuel cells with the function of anodic biocatalyst. Two-fold higher capacitance and exchange current was observed with MFC-S operation compared to MFC-M. Lower Tafel slope and polarisation resistance observed with MFC-S operation indicated higher electron discharge capability of S. haliotis over the mixed consortia operation. However, the extent of power generation period and substrate degradation efficiency was comparatively higher with mixed culture operation. After augmentation with S. haliotis (MFC-SA), anodic microflora showed rapid enhancement in the fuel cell performance in terms of power output (378 mV; 2.73 mA) and bio-electrochemical behaviour. After augmentation, fifteen-fold higher exchange current density, ten-fold lower electron transfer coefficient and hundred-fold lower polarization resistance was observed compared to MFC-M operation. The syntrophic association of S. haliotis with native anodic biocatalyst showed positive influence on the electron discharge capabilities due to reduction in the activation losses. The stable and high electron discharge pattern observed with augmented system throughout the operation indicates the system stability in current generation.
1. Introduction
Energy is vital to global prosperity, yet we depend on fossil fuels as our primary energy source. Recently, significant stress was observed on alternative and sustainable energy, where bioenergy documented higher visibility. In this direction, application of microbial fuel cells (MFCs) has been proclaimed to be one of the viable options to generate sustainable energy through simultaneous waste treatment.1 The power generation capacity of MFC depends on the catabolic activity of the anodic biocatalyst and its electron transfer efficacy to the anode. However, the transfer of electrons between the biocatalyst and the solid surface of the anode (electrode) is low because of the sluggish kinetics which subsequently result in a low power yield.2 Power output of MFC can be improved by enhancing the electron transfer efficiency between the biocatalyst and the anode. Electrochemically active bacteria (EAB) or exoelectrogens can be defined by their efficiency in discharging the electrons into the exterior environment through direct or mediated mechanisms.3,4 Different possible routes of electron discharge were reported from the biocatalyst to the anode such as external appendages like pili, membrane bound organelles, primary and secondary metabolites, etc., are reported.1,5–9 On the other hand, the mechanisms like quorum sensing also facilitate both inter and intra species electron transport.10 Some microorganisms use more than one electron transfer mechanism simultaneously for transferring the electrons to the anode. Interaction among the microorganisms is one of the key factors for efficient electron transfer during MFC operation.11 Synergistic association of Brevibacillus sp. with Pseudomonas sp. in MFC showed improved power output. Higher and effective electron transfer was achieved with Brevibacillus sp. in the presence of Pseudomonas sp. and was attributed to the mediators produced by Pseudomonas sp. enabling Brevibacillus sp. to achieve extracellular electron transfer.12In this context, the present study was designed to evaluate the fate of the electron transfer of native anaerobic biocatalyst after augmenting with an EAB, Shewanella haliotis ATCC 49138. The synergistic association of EAB with the other cultures was much less reported12 and with a mixed culture was not yet reported. This study reports the bioaugmentation of EAB on the native microflora to enhance the power generation potential. Bioaugmentation is considered to be a successful strategy used to improve the overall process efficiency of biological system by enhancing the required characteristics of the process and by improving the interaction among the native species, subsequently leading to process enhancement.13 Indigenous or allochthonous wild type or genetically modified organisms were used for augmentation. In particular, bioaugmentation was more popularly used to accelerate the treatment efficiency of hazardous waste sites or bioreactors for the effective removal of undesired compounds. Application of bioaugmentation has been previously applied to improve the start-up of a bioreactor,14 to enhance reactor performance,15,16 to protect the existing microbial community against adverse effects,17–21 to accelerate the onset of degradation21,22–28 or to compensate for organic or hydraulic overloading.29
The rationale behind bioaugmentation application to MFC is, augmentation of catabolically relevant organisms having specialized characteristics by which it can improve the bioelectricity generation. Successful application of bioaugmentation ultimately depends on the identification of appropriate microbial strains and their subsequent survival and activity once released into the target habitat. However, it can be equally reasoned that introduction of robust strains, containing desired characteristics, that persist long term in a habitat, would have greater opportunities to transfer the desired characteristics to other microorganisms. Shewanella sp. is an exoelectrogen capable of producing electron shuttles, which permit them to reduce insoluble metal oxides without direct cell–electron acceptor contact.30–32 Electron shuttles are soluble molecules comprised of membrane vesicles containing redox proteins that are released from gram negative microorganisms.33Shewanella sp. are able to function under diverse environmental conditions and can synthesize redox mediators which are involved in the direct electron transfer to anodes.32–34S. oneidensis MR-1 was recently identified to have c-type cytochromes in the genome and was shown to be localized in the periplasm, in the outer membranes of species and in pilus like assemblages. The investigation also focused on evaluating the relative electron transfer efficiency of S. haliotis alone in comparison with native microflora and bioaugmented microflora with S. haliotis based on their bio-electrochemical and electro-catalytical properties. Studies were performed separately in three independent and dimensionally similar fuel cells.
2. Experimental methodology
2.1 Biocatalysts
The lyophilized microbial stain, S. haliotis ATCC 49138 (formerly Shewanella putrifaciens) culture (S) purchased from Microbiologics, was used as the anodic biocatalyst for augmenting the anodic chamber of MFC operating with native microflora. The lyophilized cultures were inoculated and grown in Luria Broth for overnight (yeast extract 5 g l−1, casein peptone 10 g l−1, sodium chloride 10 g l−1; pH 7). A loop full overnight grown culture was inoculated into the nutrient broth and incubated at 37 °C for 18 h. 2 ml of the culture was taken from the broth in to eppendorf tube and centrifuged at 5000 g to pellet out the bacterial cells. The bacterial pellet was washed twice in saline buffer (5000 g for 7 min, 20 °C) followed by re-suspension into designed synthetic wastewater (DSW; dextrose 3 g l−1; NH4Cl 0.5 g l−1, KH2PO4 0.25 g l−1, K2HPO4 0.25 g l−1, MgCl2 0.3 g l−1, CoCl2 25 mg l−1, ZnCl2 11.5 mg l−1, CuCl2 10.5 mg l−1, CaCl2 5 mg l−1, MnCl2 15 mg l−1, NiSO4 0.16 g l−1, FeCl3 0.03 g l−1) under anaerobic microenvironment, (120 rpm; 48 h) prior to augmentation into the anodic chamber of the respective fuel cells. Anaerobic consortium (M)acquired from anaerobic suspended growth reactor treating industrial wastewater in our laboratory was used as innoculum to startup the mixed culture and augmented MFCs. Prior to inoculation, 5 g of anaerobic sludge was washed thrice in saline buffer and enriched in DSW under anaerobic conditions.2.2 Microbial fuel cells
Three single chambered MFCs were designed and fabricated using a "Perspex" material (total/working volume, 0.50/0.45 l). Non-catalyzed graphite plates (5 × 5 cm; 10 mm thick; surface area 70 cm2 (plain cathode) and 83.5 cm2 (perforated anode; 0.1 cm diameter)) were used as electrodes. The anode was completely immersed in the substrate, while the top portion of the cathode was exposed to air (open-air cathode) and the bottom portion was in contact with the substrate. Proton exchange membrane (Nafion117, Sigma-Aldrich) was sandwiched between the electrodes. The top portion of the anode was fixed below the PEM–cathode assembly over the liquid layer where the bottom surface was in contact with the anolyte. Copper wires were used for contact with electrodes after sealing with epoxy sealant. Leak proof sealing was employed to maintain an anaerobic microenvironment in the anode compartment. Fuel cells were operated without using any synthetic mediators.2.3 Operation
Among the three MFCs operated, two were inoculated with anaerobic mixed culture, wherein one system was used to evaluate the efficiency of anaerobic culture (MFC-M) while another system is used to study the function of biaougmentation with S. haliotis on native anodic microflora (MFC-SA). The third fuel cell evaluates the functional role of S. haliotis alone on fuel cell performance (MFC-S). The anodic compartments were inoculated with respective cultures along with DSW. All the MFCs were operated using DSW with an organic load (OL) of 2.88 kg COD/m3 (3.2 mg COD/l) at ambient temperature (29 ± 2 °C). Prior to feeding, pH of the wastewater was adjusted to 6 using concentrated orthophosphoric acid (88%)/ 0.1 N NaOH. MFCs were operated in fill and draw (fed-batch) mode. Before every feeding event, the inoculum was allowed to settle down (30 min; settling) and the exhausted feed (320 ml) was decanted (decanted; 15 min) under anaerobic conditions. The inoculum settled at the bottom (40 ml by volume) was used for subsequent operations. Feeding, decanting, and recirculation operations were performed by peristaltic pumps. DSW was fed through an inlet port provided at the bottom of the anode chamber to facilitate the flow in an upward direction. Anodic content (anolyte) was continuously recirculated (0.35 l h−1) in the direction of flow to avoid the formation of a concentration gradient during operation. The anode chamber was sparged with oxygen free N2 gas for 2 min to maintain an anaerobic microenvironment after every feeding and sampling event. Constant voltage outputs and substrate (COD) removal efficiency were considered as indicators to assess the stabilized performance of the fuel cells. After achieving stable performance, the fuel cell was fed with fresh feed (Fig. 1).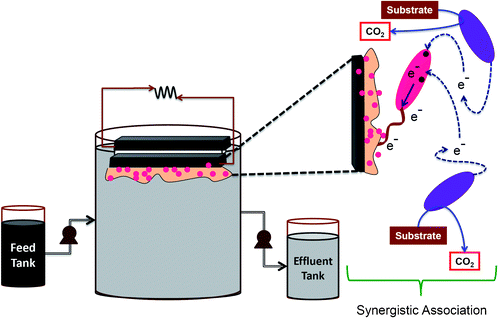 | ||
| Fig. 1 Schematic details of the MFC operation and the mechanism of synergistic association | ||
2.4 Bio-electrochemical analysis
The performance of the MFC was assessed based on fuel cell behavior in terms of open circuit voltage (OCV), current and electron discharge. A polarization curve was plotted with the function of current density against potential and power density measured at different resistances (30 kKΩ to 0.05 kΩ) for all the experimental variations studied. Anodic oxidation potential and electron motive force (emf) were also measured across various resistances (30 kΩ to 0.05 kΩ). Sustainable power calculations were also made, after the MFC reached a stable cell potential at respective experimental conditions. A relative change in the anodic oxidation potential (RDAP) was calculated to evaluate the sustainable power generation. Cyclic voltammetry (CV) was employed to evaluate the electron discharge properties of the biocatalyst employing a potentiostat-glavanostat system (PGSTAT12, Ecochemie). All the electrochemical assays were performed in situ by considering the anode and cathode as working and counter electrodes against a Ag/AgCl (S) reference electrode in DSW electrolyte. CV was performed by applying a potential ramp to the working electrode (anode) at a scan rate of 30 mV s−1 over the range from + 0.5 to − 0.5 V. Tafel analysis was made from the voltammetric profiles using GPES (version 4.0) software and conclusions were drawn in terms of the Tafel slope and polarization resistance. Volatile fatty acids (VFA), pH and chemical oxygen demand (COD) were analyzed according to the standard methods.35![[thin space (1/6-em)]](https://www.rsc.org/images/entities/char_2009.gif) :ethanol (1:1) solution to store at −20 °C. 10 μl of the fixed sample was applied in a well of a gelatin-coated glass-side, dried for 1 h at 46 °C and subsequently dehydrated in solutions of 50%, 80% and 96% ethanol each for 3 min. To start hybridization, 9 μl of hybridization buffer [5 M NaCl (18 μl), 1 M Tris.HCl (2 μl), 0.5 M EDTA (100 μl), 10% SDS (100 μl) make up to 10 ml with distilled water] and 1 μl of fluorescent labelled probe (50 ng ml−1) were added to the well. Hybridization was conducted for 2 h at 46 °C in a humidified chamber. Following hybridization, a washing step was performed for 20 min at 48 °C using washing buffer (1 ml of 1 M Tris-HCl and 6.3 ml of 5 M NaCl make up to 50 ml with distilled water). The oligonucleotide probe, 5′GTTGCCAGGCACCCCCAT 3′ specific to S. haliotis was labelled with 5′-CY3 modification (MWG–Biotech AG) and used to track the augmented culture. The fluorescent stained bacterial smears were visualized with epifluorescent microscope (Nikon Eclipse-80i) at 400× magnification under Cy3 and DAPI filters. The photomicrographs were captured with an encompassed digital camera (YIM-smt, 5.5 mega pixels) using NIS-elements (D3.0) software. Counting of Cy3-stained bacterial cells was done in a single microscopic field using a Cy3 filter followed by DAPI-stain cell counting (DAPI-filter). The bacterial cell count was done randomly on the selected fields (more than 10) of the smears.
:ethanol (1:1) solution to store at −20 °C. 10 μl of the fixed sample was applied in a well of a gelatin-coated glass-side, dried for 1 h at 46 °C and subsequently dehydrated in solutions of 50%, 80% and 96% ethanol each for 3 min. To start hybridization, 9 μl of hybridization buffer [5 M NaCl (18 μl), 1 M Tris.HCl (2 μl), 0.5 M EDTA (100 μl), 10% SDS (100 μl) make up to 10 ml with distilled water] and 1 μl of fluorescent labelled probe (50 ng ml−1) were added to the well. Hybridization was conducted for 2 h at 46 °C in a humidified chamber. Following hybridization, a washing step was performed for 20 min at 48 °C using washing buffer (1 ml of 1 M Tris-HCl and 6.3 ml of 5 M NaCl make up to 50 ml with distilled water). The oligonucleotide probe, 5′GTTGCCAGGCACCCCCAT 3′ specific to S. haliotis was labelled with 5′-CY3 modification (MWG–Biotech AG) and used to track the augmented culture. The fluorescent stained bacterial smears were visualized with epifluorescent microscope (Nikon Eclipse-80i) at 400× magnification under Cy3 and DAPI filters. The photomicrographs were captured with an encompassed digital camera (YIM-smt, 5.5 mega pixels) using NIS-elements (D3.0) software. Counting of Cy3-stained bacterial cells was done in a single microscopic field using a Cy3 filter followed by DAPI-stain cell counting (DAPI-filter). The bacterial cell count was done randomly on the selected fields (more than 10) of the smears.
3. Results and discussion
3.1 Electrogenesis
The fuel cell operated with an anaerobic mixed culture (MFC-M) as the anodic biocatalyst showed gradual increment in power generation and documented almost similar power output (OCV, 218 ± 19 mV; current, 1.36 ± 0.51 mA at 100 Ω) during the stable phase of operation (Fig. 2). The fuel cell operated with Shewanella haliotis (MFC-S) as the anodic biocatalyst showed higher power output (295 mV; 2.13 mA) compared to mixed culture (MFC-M; 233 mV; 1.35 mA) which might be due to the higher electron discharge capabilities of the electrochemically active strain. However, the extent of power generation period was relatively low with S. haliotis rather than with mixed culture. After achieving a stable performance, the mixed anodic microflora was augmented with S. haliotis (MFC-SA) and operated under similar conditions. After augmentation, the fuel cell documented significant improvement in overall power output (OCV, 378 mV; 2.73 mA at 100 Ω). Among the three fuel cells studied, an augmented system showed higher and stable power output and electron discharge (ED). The power generation time was also extended during the fuel cell operation after augmentation which might be attributed to the synergistic association between EAB and the native anodic consortia (Fig. 1 and 2). One of the prerequisites to assess the success of bioaugmentation is the long-term survival of the augmented strain in the targeted habitat. The survival of S. haliotis in fuel cell after augmentation was traced by FISH analysis. The microscopic images revealed the persistence of S. haliotis even after four cycles of operation without much variation (Fig. 3). 213 bacterial cells were hybridized with Cy3 fluorescent labelled PB-00426 probe specific for Shewanella sp. among the 469 DAPI fluorescent cells were counted in selected fields. Long-term persistance of the augmented strain in the targeted system will have greater opportunities to transfer the desired characteristics to native microorganisms.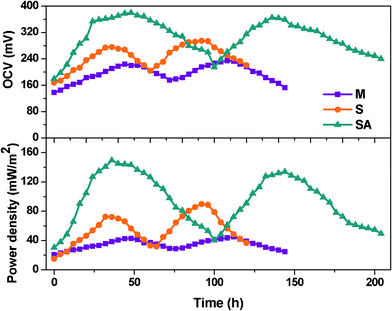 | ||
| Fig. 2 Open circuit voltage (OCV) and power density with the function of time. | ||
![Photomicrographs of (a) DAPI-stained (M); (b) Monolabelled probe (Cy3; PB-00426) hybridized cells; (c) merged photomicrograph a and b [Cy3; PB-00426 (red) and DAPI (blue)]; (d) Variation in bacterial count during MFC-SA operation. (The photomicrographs were captured with a scale bar of 200 μm; 400× magnification).](/image/article/2012/RA/c1ra00540e/c1ra00540e-f3.gif) | ||
| Fig. 3 Photomicrographs of (a) DAPI-stained (M); (b) Monolabelled probe (Cy3; PB-00426) hybridized cells; (c) merged photomicrograph a and b [Cy3; PB-00426 (red) and DAPI (blue)]; (d) Variation in bacterial count during MFC-SA operation. (The photomicrographs were captured with a scale bar of 200 μm; 400× magnification). | ||
Substrate degradation varied with the function of anodic biocatalyst used in the fuel cell. MFC-M showed good substrate (COD) removal efficiency (54.69%) accounting for a substrate degradation rate (SDR) of 0.53 kg COD m−3 day−1 which after augmentation with S. haliotis showed marginal improvement (55.06%; 0.41 kg COD m−3 day−1). On the contrary, substrate degradation was relatively low with S. haliotis operated system (36.88%). S. haliotis is a gram-negative facultative anaerobe which can survive under dark-fermentative conditions producing different metabolic intermediates viz., acetate, succinate, lactate, ethanol, etc. depending on the pathway it undergoes. The higher substrate exhaustion was observed especially with mixed culture might be attributed to the multiple metabolic reactions manifested due to syntrophic association of the microorganism which might not be feasible with single strain metabolism. On the contrary, MFC-SA showed higher specific power production (138 mW/Kg CODR) followed by MFC-S (131 mW/Kg CODR) and MFC-M (50 mW/Kg CODR).
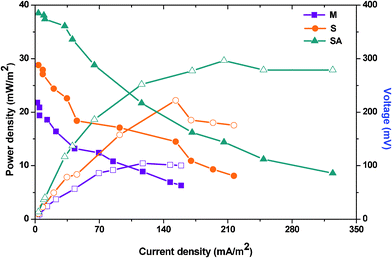 | ||
| Fig. 4 Polarization curve measured at various resistances generated during stabilized performance of three MFCs. | ||
The polarization curve also helps to understand the electron losses during their transfer from the biocatalyst to the anode and then to the cathode (Fig. 4). Electron transfer (direct or mediated) from bacteria towards the anode is normally hampered by the anodic over-potentials which impact the energy efficiency of the fuel cell.7 Three different losses viz., activation, ohmic and concentration are normally possible during MFC operation. Oxidation of substrate at the anode or reduction of a compound at the bacterial surface or in the bacterial interior requires certain activation energy which incurs a potential loss generally described as the activation loss. It is apparent that activation losses are considered in the lower range of current densities and are crucial. The possibility to undergo multiple metabolic reactions/pathways simultaneously with mixed culture incurs a high energy resulting in activation losses. This also facilitates electron quenching which normally arises due to the competition between the metabolic pathways. On the contrary, fuel cell operated with S. haliotis showed lower activation losses due to the possibility of undergoing limited metabolic interactions. After augmentation, a significant reduction in activation losses was observed on the polarization profile. Ohmic losses caused by the electrical resistances of the electrodes, electrolyte, membrane, etc., can be reduced by high electrolyte conductivity. Especially after augmenting with electrochemically active strain, the ohmic losses decreased significantly due to the increased electron transfer which also improved the power output. A large oxidative force of the anode creates concentration losses where substrate oxidation is faster at the anode, generating more electrons than that can be transported to the anode surface and to the cathode, especially at lower resistances. This was not observed during three fuel cell operations which might be due to the operation at a lower organic load that might not contribute for the concentration losses.
A plot between variation in percent deviation of anodic oxidation potential (RDAP) with the function of applied external resistance was used to evaluate the external resistor to measure the maximum sustainable power of MFC.37 The performance of the fuel cell is considered to be in a steady state if the power generated by the system equals the power consumption for an extended time and at steady state power production is considered to be sustainable.37–39 When external resistance is high, the RDAP increases linearly with decreasing external resistance because the electron delivery to the cathode is limited by the external resistance. However, when a low external resistance is applied, the electron delivery to the cathode is limited by kinetic and/or mass transfer (or internal resistance). Mixed culture showed higher sustainable resistance (10 kΩ) compared to S. haliotis (8 kΩ) operation (Fig. 5). After augmenting, the sustainable resistance decreased to 6 kΩ indicating a decrease in the kinetic and/or mass transfer or internal resistances, and increases in the transfer of electrons to the cathode and then generates high power with sustainability. This also supports the longer duration of power sustainability observed during the operation of fuel cells especially after augmentation (100 h) compared to MFC-S (60 h) and MFC-M (72 h) (Fig. 2).
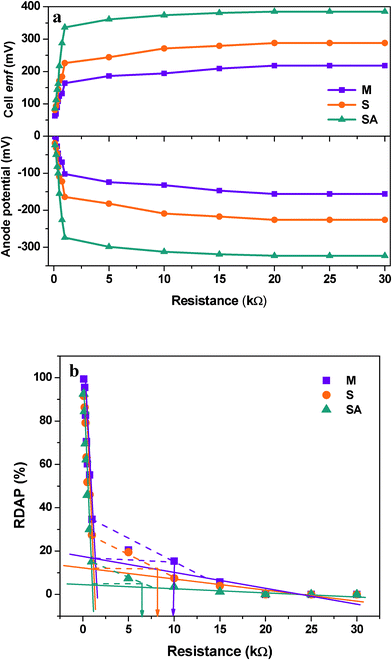 | ||
| Fig. 5 (a) Effect of external resistance on the anodic potential with respect to applied external resistance under variable experimental conditions; (b) effect of external resistance on the variation of percent deviation of anodic potential with respect to applied external resistance for evaluating sustainable power | ||
By summing up, fuel cells operating with mixed culture (MFC-M) showed maximum power output (218 ± 19 mV; 1.36 ± 0.51 mA at 100 Ω) at 24 h along with good substrate degradation (54.69%) (Table 1). Whereas, the fuel cell operating with S. haliotis (MFC-S) alone showed a two-fold higher power output (295 mV; 2.13 mA at 100 Ω) than the mixed culture at 36 h due to its inherent electrochemical activity. MFC-S showed relatively low substrate degradation capability (36.88%) and moreover took a longer time to stabilize because of its limited metabolic pathway in spite of higher specific power yield than the mixed culture. Upon augmentation of native microflora with S. haliotis, the fuel cell performance improved significantly (378 mV; 2.73 mA at 100 Ω) at 18 h along with good substrate degradation (55.06%; 138 mW kg−1CODR) compared to MFC-M and MFC-S. The polarization profile of the augmented system evidenced CDP at a lower resistance (300 Ω) with significantly higher power output of 29.64 mW m−2 against a power density of 10.44 mW m−2 at 300 Ω (MFC-M) and 22.21 mW m−2 at 400 Ω (MFC-S). RDAP analysis documented lower sustainable resistance (6 kΩ) with the augmented system compared to MFC-M (10 kΩ) and MFC-S (8 kΩ) indicating a decrease in losses and an increase in system sustainability. The bioaugmented fuel cell showed stable and high electron discharge pattern throughout the operation indicating the system stability in current generation efficiency than the fuel cells operating with mixed consortia or pure culture. The syntrophic association of S. halophiate with native anodic microflora showed a significant positive impact on the electron discharge capabilities.
| Anodic biocatalyst | Oxidative charge (C) | Total charge (C) | Oxidative capacitance (F) | Total capacitance (F) | No. of electrons (n) | Oxidative slope βa (V/dec) | Reductive slope βc (V/dec) | Polarization resistance RP (Ω) | Electron Transfer Coefficient (αa) | OCV (mV) | Current (mA) | Substrate removal efficiency (%) |
|---|---|---|---|---|---|---|---|---|---|---|---|---|
| Mixed culture | 5.34 × 10⁻³ | 1.06 × 10⁻² | 1.07 × 10⁻² | 2.13 × 10⁻² | 6.65 × 10¹⁶ | 0.094 | 0.56 | 498 | 3.63 × 10⁻²⁰ | 233 | 1.35 | 54.59 |
| Shewanella sp. | 9.33 × 10⁻³ | 2.10 × 10⁻² | 1.87 × 10⁻² | 4.19 × 10⁻² | 1.30 × 10¹⁷ | 0.085 | 0.953 | 174 | 1.66 × 10⁻²⁰ | 295 | 2.13 | 36.88 |
| Shewanella sp. augmented culture | 8.15 × 10⁻² | 1.04 × 10⁻¹ | 1.63 × 10⁻¹ | 2.08 × 10⁻¹ | 6.51 × 10¹⁷ | 0.082 | 0.563 | 41 | 3.23 × 10⁻²¹ | 378 | 2.73 | 55.06 |
3.2 Bio-electrochemical evaluation
Bio-electrochemistry involves the understanding of biocatalytic phenomena associated with charge separation which often leads to charge transfer, which can occur homogeneously in solution, or heterogeneously on electrode surfaces. Electrode reactions generally take place in the interfacial region between electrode and the solution where charge distribution differs from that of the bulk phases. The electrode acts as a source of electrons transferred (acceptor) which can be affected by the nature and structure of the electrode.40 However, all the three MFCs have no variation in the electrode material or their sizes, so, effect of electrode on the charge separation and distribution was observed. This indicates that the change in charge distribution is due to the substrate metabolism and biocatalyst nature where the initial substrate was similar indicating the specific role of the biocatalyst. The substrate metabolism varied among the mixed culture and S. halophiate.A few microbial species have the capability to discharge reducing powers (H+ and e−) generated during the metabolic activity via bacterial membrane bound organelles or soluble mediators. In situ evaluation of electron discharge employing cyclic voltametry (Vs Ag/AgCl (S)) with time helps to understand the metabolic changes and the electron carriers involved in their transfer. Electrochemical evaluation visualized the marked variation in the electron discharge properties with respect to the biocatalyst used (Fig. 6). S. halophiate recorded higher catalytic currents (oxidation, 1.26 mA; reduction, −2.39 mA) compared to the mixed culture (oxidation, 1.07 mA; reduction, −1.19 mA) in both the oxidation and reduction sweeps. However, reduction was slightly higher than the oxidation in both cases. The mixed culture showed negligible variation in the catalytic currents through out the operation in both the sweeps but S. halophiate showed significant variation in the catalytic currents. Having the advantages of S. halophiate, marked increment in the oxidation currents were observed after augmentation, while reduction currents showed little increment (MFC-SA; oxidation, 12.8 mA; reduction, −4.98 mA). This is a direct evidence for the syntrophic association of the augmented electrochemically active strain with the native anodic mixed microflora avoiding the electron losses prior to reaching the anode. The electron discharge pattern was similar among the oxidation and reduction sweeps against time with all the biocatalysts studied in spite of the variations in the catalytic currents.
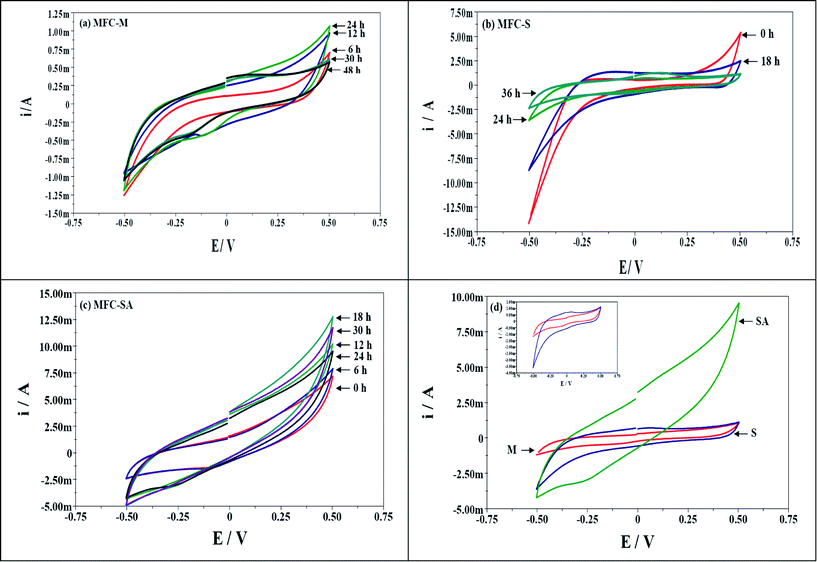 | ||
| Fig. 6 Cyclic voltammogram profile of MFCs operated with (a) mixed culture (MFC-M); (b) Schewanella haliotis (MFC-S); (c) Schewanella haliotis augmented mixed culture (MFC-SA) with the function of operation time; (d) comparative plot at maximum performance conditions (inset: voltammograms of MFC-M and MFC-S) | ||
The charge represents the number of electrons present at a particular instance on the anode surface during oxidation. Charge distribution (Fig. 7a) was observed to vary with time and metabolic nature of the biocatalyst used (Table 1). Voltammetric profiles showed a higher charge (Fig. 7a) with augmented system operation (104 mC) followed by S. halophiate (21 mC) and mixed culture (10.6 mC) which indicates higher availability of electrons on the anode surface which yields higher power output than other two systems. Ten-fold and five-fold higher charge distribution was observed with the augmented system than MFC-M and MFC-S respectively. This might be due to the variation in the relevant energy levels of the biocatalyst, electron transfer efficiencies and participation of the soluble redox species. Charge separation can also be represented by the capacitance and the difficulty of charge transfer by its resistance. Capacitance is the ability of a cell to hold electrical charge and is a measure of the amount of electrical energy stored at an applied electric potential given by
| C = Q/V | (1) |
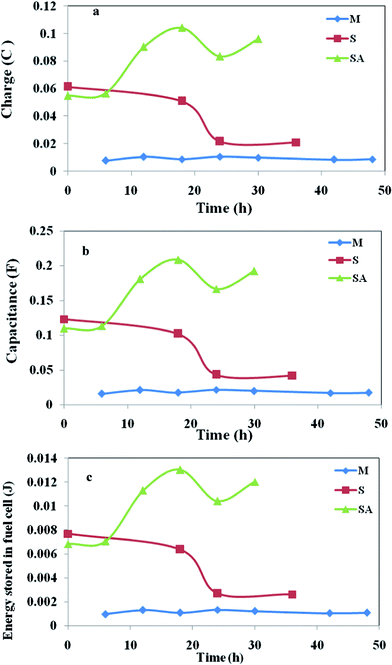 | ||
| Fig. 7 Variations in (a) Charge; (b) capacitance; (c) energy stored, with respect to time obtained from the voltammetric profiles during MFC operation. | ||
The energy stored in a capacitor is equal to the work done to charge it. Considering a capacitor of capacitance C, holding a charge Q and dW = Q/C dQ upon integration gives the following equation (eqn 2), where, W represents work done (J), Q is the charge (C) and C is the capacitance (F).
| Wcharging = ∫ Q/C dQ = Q2/2C = CV2/2 | (2) |
The energy stored in the MFC-SA is ten-fold higher than that of MFC-M and five-fold higher than that of MFC-S (Fig. 7c). It is apparent that after augmentation with an electrochemically active strain, the energy levels of mixed culture increased to ten times with two-fold increment in power output.
Peaks were not detected on CV sweeps, which might be due to the usage of non-catalyzed graphite as working electrode and wastewater as electrolyte might have interfered with the detection of redox signals. However, voltammograms of a S. halophiate operated fuel cell recorded oxidative peak at a midpoint potential of 0.111 V (Fig. 7b). These oxidative peaks might be attributed to glucose dehydrogenase enzyme.41 This enzyme belongs to the family of oxidoreductases, specifically those acting on the CH–OH group of donor with NAD+ or NADP+ as acceptor. Electron transfer from the biocatalyst to the anode can be distinguished between direct electron transfer (DET) and mediated electron transfer (MET) mechanisms which is helpful in avoiding electron losses between the biocatalyst and anode.6 The documented mediator indicates electron transferviaMET. Also, the additional soluble mediators present in mixed culture might also involved in the electron transfer in MFC-SA. Recent studies showed the capability of Shewanella sp. and Geobacter sp. to form filamentous pili as the third mechanism for extracellular electron transfer through biological nanowires.6Shewanella sp. have the capability to transfer electrons viaDET (conductive bacterial pili)6 and MET (secondary metabolites).3 An electrochemically active strain can discharge electrons effectively into the exterior environment, while in the case of mixed culture, there are number of interferences resulting in the total electron losses. The electron released might undergo neutralization prior to reaching the anode.
Electrochemical analysis enumerated higher electron transfer efficiencies with the augmented system contributing for higher power output. MFC-M showed marginal variation in the redox catalytic currents (oxidation, 1.07 mA; reduction, −1.19 mA) with charge/capacitance of 10.6 mC/21.3 mF and energy stored in the cell of 1.33 mJ. Where as with S. halophiate the fuel cell showed higher catalytic currents (oxidation, 1.26 mA; reduction, −2.39 mA) along with two-fold higher charge (21.6 mC) and capacitance (41.9 mF) compared to mixed culture. The energy stored in the cell was also two-fold (2.62 mJ) higher than that of MFC-M. Operation of MFC-S revealed the participation of mediators with higher energy for efficient electron transport causing higher power output. Augmented consortia documented marked increment in currents (oxidation, 12.8 mA; reduction, −4.98 mA). The charge (104 mC), capacitance (208 mF) and the energy stored (13 mJ) in the system were ten-fold higher than MFC-M and five-fold higher than that of MFC-S. Higher energy levels were observed when augmented with S. halophiate contributing to higher power generation. The mediators of S. halophiate and additional mediators of mixed consortia could also result in higher electron transport.
The electrochemically active nature of a microorganism supports the effective pumping out of redox power (H+ and electrons) from the outer membrane of the microorganism and transfer of redox powers through membrane-bound proteins (direct electron transfer) or soluble shuttlers (mediated electron transfer) or some times through a conductive biofilm (nanowires)3,30,42 which might be some of the probable reasons for the higher sustainability observed with the augmented system in this study. Addition of mediators along with anolyte is one of the strategies used to overcome the electron losses.1 After augmenting the fuel cell with an electrochemically active strain, the possibility of mediator release might also have functioned for effective electron carrier. Furthermore, the multiple metabolic interactions occurring within the mixed culture and with the augmented strain might have helped in maintaining the redox power shuttling between metabolic intermediates leading to the high potential maintenance for longer periods.
3.3 Electro-kinetic evaluation
Electrical energy can be obtained from fuel cell operation only when a reasonable current is drawn, but the actual cell potential is decreased from its equilibrium potential because of irreversible losses present in the fuel cell.43,44Electron transfer from the biocatalyst to the anode is generally hampered by different losses which lower the conversion efficiency of the fuel cell.6 Especially at lower current densities activation losses are considered to be crucial during MFC operation. As the flow of electrons increases in the circuit, activation losses show some decrement. Activation losses appear when the rate of an electrochemical reaction at an electrode surface is controlled by electrode kinetics.43 In other words, activation losses can be directly correlated to the rates of bio-electrochemical reactions. Electrons generated from the substrate degradation need to overcome various barriers to transfer from the biocatalyst to the anode and then to the cathode prior to getting reduced at the cathode, which incurs energy loss and can account under activation losses.44 There is a close similarity between bio-electrochemical and biochemical reactions wherein both encounter an activation barrier that must be overcome by the reacting species or biocatalyst.40 These losses result in a cell voltage (V) that is less than its ideal potential, E (V = E-Losses). Voltage drop due to activation losses can be expressed by a semi-empirical Tafel equation (eqn 3).43,44
| ln i = i0 + αa nEF/RT | (3) |
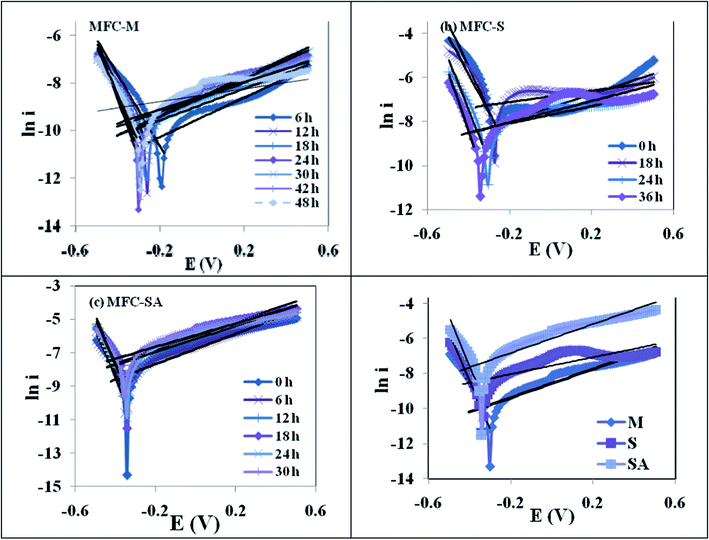 | ||
| Fig. 8 Tafel plots during MFC operation with (a) mixed culture (MFC-M); (b) Schewanella haliotis (MFC-S); (c) Schewanella haliotis augmented mixed culture (MFC-SA) (d) comparative Tafel slope of three MFC operations at maximum performance. | ||
The electron transfer coefficient, (α) describes the symmetry between the forward and reverse electron transfer steps, according to the Butler–Volmer model of electrode kinetics. If one thinks in terms of energy barriers between the oxidized form of the species and the reduced form, the free energy of the reactants can be changed by increasing or decreasing the potential applied to the electrode. The extent to which the free energy change contributes to a change in the activation energy is dependent on the magnitude of α, which ranges in value from 0 to 1. The electron transfer coefficient, αa, was calculated by αa = βaRT/nF, where βa is the slope of the linear fitting (also called the Tafel slope) and n is the number of electrons transferred at the rate limiting step (Fig. 9). The augmented fuel cell showed a lower Tafel slope (0.082 V/dec) followed by S. halophiate (0.085 V/dec) and mixed culture (0.094 V/dec), indicating that the higher electron discharge capabilities of augmented system under the applied lower potential (Fig. 9). A clear dependence on the magnitude of α was noticed with the corresponding change in activation losses represented in the polarization profile (Fig. 4). Lower Tafel slope indicates the higher bio-electro catalytic activity and electron transfer efficiencies. Substrate utilization was also observed to be higher with MFC-SA (55.94%) followed by MFC-M (54.69%) and MFC-S (36.88%) supporting the higher metabolic activities. However, a negligible variation was observed in the substrate utilization of the mixed culture before and after augmentation indicating the limited role of S. halophiate in substrate utilization. On the contrary, αa was observed to be higher with MFC-SA (3.23 × 10⁻²¹) followed by the MFC-S (1.66 × 10⁻²⁰) and MFC-M (3.63 × 10⁻²⁰). This indicates a higher electron transfer co-efficient with the augmented culture supporting higher power generation efficiencies. Charge obtained from the voltammetric profiles also showed similar pattern of electron availability which strongly supports the αa and electron transfer efficiencies.
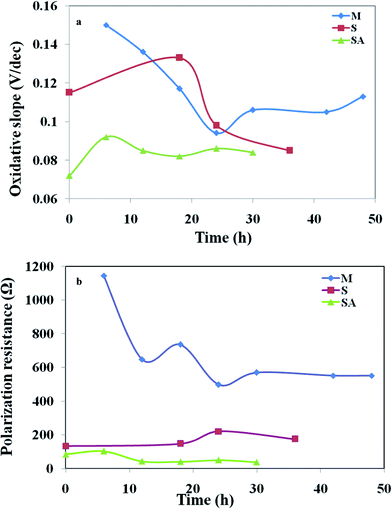 | ||
| Fig. 9 Variations in (a) oxidative slope (βa); (b) polarization resistance (Rp) of the MFCs with respect to operation time. | ||
High polarization resistance was observed with mixed culture (RP, 498 Ω) followed by S. halophiate (174 Ω) and augmented biocatalyst (41 Ω) (Fig. 9). This indicates the drop in resistance for the electron discharge after augmenting the electrochemically active strain. The αa and Rp varied with time in each experiment, where Rp was observed to be initially quite high and dropped with time prior to increasing again at the end of the experiment. Inversely proportion to the Rp, αa showed a gradual increment from the initial lower value and dropped at the end of the experiment irrespective of the biocatalysts nature. This pattern indicates the proportional variation of αa and Rp with the metabolic activities of the biocatalyst. There is no significant variation in the substrate conversion of the native mixed culture before and after augmentation. The αa also does not vary much (∼0.1 only) indicating a similar electron generating capability among the three systems. However, a marked drop in Rp was noticed (from 498 Ω to 41 Ω) after augmentation with an electrochemically active strain which might be due to the syntrophic association of S. halophiate with the anodic microflora in discharging the electrons efficiently along with overcoming the losses prior to reaching the anode. A higher number of electrons generated during the substrate metabolism by the mixed culture might also have helped in the enhancement of power generation after augmenting with the electrochemically active strain. Variation in the electron discharge observed on the voltammogram strongly supports the same. A significant increment in the electrogenesis was also observed after augmenting with an electrochemically active strain. A marked decrement observed in the electron losses strongly supports the reduction in the polarization resistance and increment in the power generation. Tafel analysis helped in understanding the variations in the number of electrons present as well as electron transfer resistance for correlating the overall performance.
Tafel slope analysis depicted exchange current density (i0) of 0.185 mA m−2, Tafel slope (βa) of 0.094 V/dec, electron transfer coefficient (αa) of 3.63 × 10⁻²⁰ and the polarization resistance (Rp) of 498 Ω with mixed culture operation (Fig. 9). Where as MFC-S showed a three-fold higher exchange current density (0.526 mA m−2), lower Tafel slope (0.085 V/dec), two-fold higher electron transfer coefficient (1.66 × 10⁻²⁰) and two-fold lower polarization resistance (174 Ω). After augmentation, the exchange current density (2.458 mA m−2) was fifteen-fold higher than MFC-M and four-fold higher than MFC-S, the Tafel slope (0.082) was lower than MFC-M than MFC-S, the electron transfer coefficient (3.23 × 10⁻²¹) was ten-fold lower than MFC-M and twenty-fold lower than that of MFC-S and the polarization resistance (41 Ω) was hundred-fold lower than MFC-M and forty-fold lower than that of MFC-S. The S. halophiate operated cell showed comparatively higher electro-catalytic activity than the mixed culture. Upon augmenting S. halophiate to the mixed culture, a significant improvement in the bio-electrochemical activity was noticed due to reduction in the activation losses as per the Tafel slope analysis.
4. Conclusion
Experiments documented the efficacy of a microbial fuel cell bioaugmented with electrochemically active strain, Shewanella haliotis ATCC 49138. The augmented system documented stable and higher electrogenic activity throughout the operation indicating the system stability and efficiency in power generation than the fuel cells operated with mixed consortia and S. haliotis alone. Tafel slope analysis illustrated significant variation in bio-electrochemical behaviour of the three fuel cells. The fuel cell operated with mixed culture showed higher substrate degradation capability along with power generation. The fuel cell operated with S. haliotis alone showed relatively higher power output but with lower substrate degradation compared to the mixed consortia. After augmenting with S. haliotis, significant improvement in power output as well as bio-electrochemical behaviour was observed. Tafel slope and polarization resistance showed marked reduction after augmentation with S. haliotis. The syntrophic association of augmented strain with native culture has resulted in maintenance of high potential difference for longer periods and thus yielding higher electron discharge efficiencies which might be due to reduction in the activation losses. Multiple metabolic interactions possible within the mixed consortia might also have helped in shuttling of the redox powers between metabolic intermediates resulting in potential difference. Higher power output for longer periods, stable electron discharge throughout operation, presence of reduction signals and high substrate degradation supports the practical utility of augmentation in fuel cell operation.Acknowledgements
The authors wish to thank the Director, CSIR-IICT for his support and encouragement in carrying out this work. SVR duly acknowledges Indian Council of Medical Research (ICMR), New Delhi and PSB, RKG, GVS and SS duly acknowledges Council of Scientific and Industrial Research (CSIR), New Delhi for providing research fellowships.References
- U. Schroder, Phys. Chem. Chem. Phys., 2007, 9, 2619–2629 RSC.
- N. Mano, F. Mao and A. Heller, J. Am. Chem. Soc., 2003, 125, 6588–6594 CrossRef CAS.
- E. Marsili, D. B. Baron, I. D. Shikhare, D. Coursolle, J. A. Gralnick and D. R. Bond, Proceedings of National Acadamy of Science, USA, 2008, 105, 3968–3973 Search PubMed.
- B. E. Logan, Nat. Rev. Microbiol., 2009, 7, 375–381 CrossRef CAS.
- D. R. Bond and D. R. Lovley, Appl. Environ. Microbiol., 2003, 69, 1548–1555 CrossRef CAS.
- Y. A. Gorby, S. Yanina, J. S. McLean, K. M. Rosso, D. Moyles, A. Dohnalkova, T. J. Beveridge, I. S. Chang, B. H. Kim, K. S. Kim, D. E. Culley, S. B. Reed, M. F. Romine, D. A. Saffarini, E. A. Hill, L. Shi, D. A. Elias, D. W. Kennedy, G. Pinchuk, K. Watanabe, S. Ishii, B. E. Logan, K. H. Nealson and J. K. FredricksonProc. Natl. Acad. Sci., USA., 2006, 103, 11358–11363 Search PubMed.
- K. Rabaey, G. Lissens and W. VerstraeteRenewable energy from biomass fermentation, in Biofuels for Fuel Cells, ed. P. Lens, P. Westermann, M. Haberbauer, A. Moreno, IWA publishing, 2005, sec IIID, ch. 20, pp. 375–396 Search PubMed.
- S. Srikanth, S. Venkata Mohan and P. N. Sarma, Bioresour. Technol., 2010, 101, 5337–5344 CrossRef CAS.
- S. Venkata Mohan, S. Veer Raghavulu and P. N. Sarma, Biosens and Bioelectrons, 2008, 23 (9), 1326–1332 Search PubMed.
- Y-C. Yong, Y. Y. Yu, C. M. Li, J. J. Zhong, H. Song, Biosens. Bioelectron., In Press, DOI:10.1016/j.bios.2011.08.032.
- D. R. Lovley, Curr. Opin. Biotechnol., 2006, 17, 327–332 CrossRef CAS.
- H. Pham, N. Boon, P. Aelterman, P. Clauwaert, L. De Schamphelaire, L. Vanhaecke, K. De Maeyer, M. Hofte, W. Verstraete and K. Rabaey, Appl. Microbiol. Biotechnol., 2008, 77, 1119–1129 CrossRef.
- H. V. Limbergen, E. M. Top and W. Verstraete, Appl. Microbiol. Biotechnol., 1998, 50, 16–23 CrossRef.
- P. Wilderer, M. A. Rubio and L. Davids, Water Res., 1991, 25, 1307–1313 CrossRef CAS.
- D. Stephenson and T. Stephenson, Biotechnol. Adv., 1992, 10, 549–559 CrossRef CAS.
- W. Jianlong, Q. Xianghun, W. Libo, Q. Yi and W. Hegemann, Biochem., 2002, 38, 777–781 Search PubMed.
- K. T. Hajji, F. Lepine, J. G. Bisaillon, R. Beaudet, J. Hawari and S. R. Guiot, Biotechnol. Bioeng., 2000, 67, 418–423 CrossRef.
- X. Quan, H. Shi, J. Wang and Y. Qian, Chemosphere, 2003, 50, 1069–1074 CrossRef CAS.
- S. Venkata Mohan, C. Falkentoff, V. V. Nacharaiah, B. S. McSwain, P. Wattiau, P. A. Wilderer, S. Wuertz and M. Hausner, Biores. Technol., 2009, 100(5), 1746–1753 CrossRef.
- S. Venkata Mohan, N. Chandrasekhara Rao, K. K. Prasad and P. N. Sarma, Process Biochem., 2005, 40, 2849–2857 CrossRef.
- S. Venkata Mohan, S. Shailaja, M. Ramakrishna, K. B. Reddy and P. N. Sarma, Process Biochem., 2006, 41, 644–652 CrossRef.
- S. Bathe, N. Schwarzenbeck and M. Hausner, Lett. Appl. Microbiol., 2005, 41, 242–247 CrossRef CAS.
- X. Hu, A. Li, J. Fan, C. Deng and Q. Zhang, Bioresour. Technol., 2008, 9, 4529–4533 CrossRef.
- S. Venkata Mohan, G. Mohanakrishna, S. V. Raghavulu and P. N. Sarma, Int. J. Hydrogen Energy, 2007, 32, 3284–3292 CrossRef.
- S. Venkata Mohan, D. Prasanna, B. Purushotham Reddy and P. N. Sarma, Int. Biodeterior. Biodegrad., 2008, 62, 162–169 CrossRef.
- S. Venkata Mohan, B. Purushotham Reddy and P. N. Sarma, Bioresour. Technol., 2009, 100, 164–172 CrossRef CAS.
- S. Shailaja, M. Ramakrishna, S. Venkata Mohan and P. N. Sarma, Bioresour. Technol., 2007, 98, 1561–1566 CrossRef CAS.
- D. Park, D. S. Lee, Y. M. Kim and J. M. Park, Bioresour. Technol., 2008, 99, 2092–2096 CrossRef CAS.
- N. Chong, S. Pai and C. Chen, Bioresour. Technol., 2007, 59, 235–240 CrossRef.
- D. K. Newman and R. A. Kolter, Nature, 2000, 405, 94–97 CrossRef CAS.
- D. P. Lies, M. E. Hernandez, A. Kappler, R. E. Mielke, J. A. Gralnick and D. K. Newman, Appl. Environ. Microbiol., 2005, 71, 4414–4426 CrossRef CAS.
- J. K. Fredrickson, M. F. Romine, A. S. Beliaev, J. M. Auchtung, M. E. Driscoll, T. S. Gardner, K. H. Nealson, A. L. Osterman, G. Pinchuk, J. L. Reed, D. A. Rodionov, J. L. M. Rodrigues, D. A. Saffarini, M. H. Serres, A. M. Spormann, I. B. Zhulin and J. M. Tiedje, Nat. Rev. Microbiol., 2008, 6, 592–603 CrossRef CAS.
- H. Richter, M. Lanthier, K. P. Nevin and D. R. Lovley, Appl. Environ. Microbiol., 2007, 73(16), 5347–5353 CrossRef CAS.
- S. K. Lower, J. Bacteriol., 2007, 189, 4944–4952 CrossRef.
- APHA, Standard methods for the examination of water and wastewater, 20th edn American Public Health Association/American water works Association/Water environment federation. Washington DC, USA, 1998 Search PubMed.
- R. I. Amann, W. Ludwig and K. H. Schleifer, Microbiol. Rev., 1995, 59, 143–169 CAS.
- J. Menicucci, H. Beyenal, E. Marsili, R. A. Velcuchamy, G. Demir and Z. Lewandowski, Environ. Sci. Technol., 2006, 40, 1062–1068 CrossRef CAS.
- S. Venkata Mohan, G. Mohanakrishna and P. N. Sarma, Environ. Sci. Technol., 2008, 42(21), 8088–8094 CrossRef CAS.
- M. Venkateswar Reddy, S. Srikanth, S. Venkata Mohan and P. N. Sarma, Bioelectrochemistry, 2010, 77, 125–132 CrossRef.
- M. A. C. Brett and A. M. O, in Electro chemistry, Oxford university press, New York, USA, 1993 ch.1, pp 25–26 Search PubMed.
- G. Unden and J. Bongaerts, Biochim. Biophys. Acta, Bioenerg., 1997, 1320(3), 217–34 CrossRef CAS.
- H. S. Lee, C. I. Torres and B. E. Rittmann, Environ. Sci. Technol., 2009, 43, 7571–7577 CrossRef CAS.
- E. G. & G. Services Parsons, in Fuel Cell Handbook (Fifth Edition), U.S. Department of Energy Office of Fossil Energy National Energy Technology Laboratory, Morgantown, 2000, ch. 2, pp 2–23–2–26 Search PubMed.
- S. Venkata Mohan and S. Srikanth, Biores. Technol., 2011, 102(22), 10210–10220 CrossRef.
| This journal is © The Royal Society of Chemistry 2012 |