Investigation on performance of Pd/Al2O3–C catalyst synthesized by microwave assisted polyol process for electrooxidation of formic acid
Wei-Li
Qu
ab,
Zhen-Bo
Wang
*a,
Zheng-Zhi
Jiang
ac,
Da-Ming
Gu
c and
Ge-Ping
Yin
a
aSchool of Chemical Engineering and Technology, Harbin Institute of Technology, No. 92 West-Da Zhi Street, Harbin, 150001, China. E-mail: wangzhenbo1008@ yahoo.com.cn
bSchool of Chemistry and Chemical Engineering, Harbin Normal University, No. 1 Normal University South Road, Harbin, 150001, China
cSchool of Science, Harbin Institute of Technology, No. 92 West-Da Zhi Street, Harbin, 150001, China
First published on 7th November 2011
Abstract
A Pd/Al2O3–C catalyst with α-Al2O3 and Vulcan XC-72 carbon black as a mixture support for direct formic acid fuel cell (DFAFC) has been prepared by a microwave-assisted polyol process for the first time. The as-prepared Pd/Al2O3–C catalysts with different mass ratios of α-Al2O3 to XC-72 carbon have been characterized by XRD, EDAX, XPS, TEM, HRTEM, and electrochemical measurements in this study. The results show that the activity of the catalyst with α-Al2O3 as the support is lower than that of the catalyst with carbon black as the support, owing to α-Al2O3 having poor electrical conductivity. However, the activity of the catalyst with α-Al2O3 and Vulcan XC-72 carbon black as a mixture support is evidently enhanced. The Pd/Al2O3–C catalyst with a mass ratio of α-Al2O3 to XC-72 carbon of 1![[thin space (1/6-em)]](https://www.rsc.org/images/entities/char_2009.gif) :
:![[thin space (1/6-em)]](https://www.rsc.org/images/entities/char_2009.gif) 2 presents the narrowest particle size distribution on the surface of the mixture support, which exhibits the best activity and stability for formic acid electrooxidation among all the samples. Its current density of the positive anodic peak of formic acid electrooxidation is up to 36.97 mA cm−2. Pd/Al2O3–C catalyst with a suitable ratio of α-Al2O3 to XC-72 carbon shows a better catalytic activity for formic acid electrooxidation and a higher stability than Pd/C, resulting from the addition of α-Al2O3 improving its electrooxidation ability for formic acid due to an anti-corrosion property of α-Al2O3 and a metal–support interaction between the Pd nanoparticles and the α-Al2O3.
2 presents the narrowest particle size distribution on the surface of the mixture support, which exhibits the best activity and stability for formic acid electrooxidation among all the samples. Its current density of the positive anodic peak of formic acid electrooxidation is up to 36.97 mA cm−2. Pd/Al2O3–C catalyst with a suitable ratio of α-Al2O3 to XC-72 carbon shows a better catalytic activity for formic acid electrooxidation and a higher stability than Pd/C, resulting from the addition of α-Al2O3 improving its electrooxidation ability for formic acid due to an anti-corrosion property of α-Al2O3 and a metal–support interaction between the Pd nanoparticles and the α-Al2O3.
1. Introduction
In recent years, direct formic acid fuel cells (DFAFC) have been attracting great attention as a promising alternative portable power source. Pd-based catalysts were found to show superior catalytic activity for formic acid oxidation reaction compared to Pt catalysts.1–4 To further increase the catalytic activity and decrease the noble metal loading, great efforts were devoted to develop highly dispersed Pd nanoparticles on the supporting materials. In direct methanol/formic acid fuel cells, highly conductive carbon materials, such as XC-72, graphite,5graphite nanofibers,6 ordered porous carbon,7–12 and carbon nanotubes,13–15 provide a high dispersion of metal nanoparticles and facilitate electron transfer, resulting in better catalytic activity. The most widely used catalyst support is XC-72 carbon black with high surface area. However, amorphous carbon as a catalyst support could be corroded chemically and/or electrochemically.16 To further improve the catalytic activity and stability of a catalyst, the carbon support materials were modified with semiconducting oxides, such as WO3,17TiO2,18–23 and CeO2.24 In searching for more stable supports for the noble metal catalysts, α-Al2O3 comes into sight because of the unique physical and chemical properties and high stability in acidic and alkaline solutions. Alumina is the most cost effective and widely used material in the family of engineering ceramics. So far, there are few reports focused on α-Al2O3 as an electrocatalyst support due to its poor electron conductivity. In this study, we utilize α-Al2O3 and XC-72 carbon black as a mixture support to enhance electron conductivity of α-Al2O3, hydrophilicity, wettability and anti-corrosion ability of carbon and then deposit the Pd particles on the mixture support by a microwave-assisted ethylene glycol process.2. Experimental
2.1. Preparation of Pd/Al2O3–C catalyst by microwave-assisted polyol process
The preparation method of the catalyst is as follows. The appropriate amounts of the α-Al2O3 and Vulcan XC-72 carbon black were dispersed into 20 mL ethylene glycol and 5 mL isopropyl alcohol in a 100 mL beaker. Then, the suspension obtained was sonicated for 1 h and stirred mechanically for 3 h, then 20.8 mg PdCl2 was dispersed into 20 mL of ethylene glycol and was added into the slurry for 3 h. The pH value of the ink was adjusted by introducing a 1 mol L−1NaOH–EG solution drop by drop until its pH value reached 10 under vigorous stirring. Argon gas was fed into the ink for 15 min to remove oxygen. Then the beaker was placed in the center of a microwave oven (2450 MHz, 800 W, WD800CTL23-2H) and heated consecutively for 50 s for the complete reduction of the Pd compound precursor. The solution was allowed to cool down to room temperature with continuous stirring, and then 0.1 mol L−1HNO3 solution was added into the cooled mixture to adjust its pH value to about 3–4. The mixture was stirred for 12 h in order to thoroughly allow the Pd nanoparticles to be fixed on the support. Then the product was washed repeatedly with ultrapure water until no Cl− ions were detected. The Pd/Al2O3–C catalysts were dried for 3 h at 80 °C in a vacuum oven and then stored in a vacuum vessel. All chemicals used were of analytical grade. The theoretical loading of Pd metal is 20 wt.% in all the samples. The mass ratios of α-Al2O3 to XC-72 carbon are 1![[thin space (1/6-em)]](https://www.rsc.org/images/entities/char_2009.gif) :
:![[thin space (1/6-em)]](https://www.rsc.org/images/entities/char_2009.gif) 2, 1
2, 1![[thin space (1/6-em)]](https://www.rsc.org/images/entities/char_2009.gif) :
:![[thin space (1/6-em)]](https://www.rsc.org/images/entities/char_2009.gif) 1, 2
1, 2![[thin space (1/6-em)]](https://www.rsc.org/images/entities/char_2009.gif) :
:![[thin space (1/6-em)]](https://www.rsc.org/images/entities/char_2009.gif) 1, denoted as Pd/Al2O3–C (1
1, denoted as Pd/Al2O3–C (1![[thin space (1/6-em)]](https://www.rsc.org/images/entities/char_2009.gif) :
:![[thin space (1/6-em)]](https://www.rsc.org/images/entities/char_2009.gif) 2), Pd/Al2O3–C (1
2), Pd/Al2O3–C (1![[thin space (1/6-em)]](https://www.rsc.org/images/entities/char_2009.gif) :
:![[thin space (1/6-em)]](https://www.rsc.org/images/entities/char_2009.gif) 1), and Pd/Al2O3–C (2
1), and Pd/Al2O3–C (2![[thin space (1/6-em)]](https://www.rsc.org/images/entities/char_2009.gif) :
:![[thin space (1/6-em)]](https://www.rsc.org/images/entities/char_2009.gif) 1), respectively. The Pd/C and Pd/Al2O3 catalysts were prepared using a similar procedure mentioned above.
1), respectively. The Pd/C and Pd/Al2O3 catalysts were prepared using a similar procedure mentioned above.
2.2. Electrode preparation and electrochemical measurement
2.3. Characterizations of physical properties
3. Results and discussion
Fig. 1 shows the XRD patterns of Pd/C, Pd/Al2O3, and Pd/Al2O3–C catalysts with different mass ratios of α-Al2O3 and XC-72 carbon black in the mixture supports, respectively. Representative diffraction peaks of Pd[(111), (200), (220), and (311)] are distinctly observed in the Pd/C spectrum, which means that Pd forms the face-centered cubic (fcc) crystal structure. From the XRD patterns, it can be observed that Pd and α-Al2O3 both coexist in the Pd/Al2O3–C catalysts. The peak intensities of α-Al2O3 in XRD patterns increase with the increasing of the content of α-Al2O3. The crystal lattice parameters of the Pd/Al2O3–C catalysts with the mass ratios of α-Al2O3 and C of 1![[thin space (1/6-em)]](https://www.rsc.org/images/entities/char_2009.gif) :
:![[thin space (1/6-em)]](https://www.rsc.org/images/entities/char_2009.gif) 0, 2
0, 2![[thin space (1/6-em)]](https://www.rsc.org/images/entities/char_2009.gif) :
:![[thin space (1/6-em)]](https://www.rsc.org/images/entities/char_2009.gif) 1, 1
1, 1![[thin space (1/6-em)]](https://www.rsc.org/images/entities/char_2009.gif) :
:![[thin space (1/6-em)]](https://www.rsc.org/images/entities/char_2009.gif) 1, and 1
1, and 1![[thin space (1/6-em)]](https://www.rsc.org/images/entities/char_2009.gif) :
:![[thin space (1/6-em)]](https://www.rsc.org/images/entities/char_2009.gif) 2 are 0.38916, 0.38952, 0.38934, and 0.38935 nm, respectively. They decrease in comparison with that of Pd/C (0.38990 nm) to some extent, indicating that there is the interaction of Pd metal and α-Al2O3 in mixed supports. There is the maximum interaction of Pd metal and α-Al2O3 in mixed supports. When the mass proportion of α-Al2O3 and C is 1
2 are 0.38916, 0.38952, 0.38934, and 0.38935 nm, respectively. They decrease in comparison with that of Pd/C (0.38990 nm) to some extent, indicating that there is the interaction of Pd metal and α-Al2O3 in mixed supports. There is the maximum interaction of Pd metal and α-Al2O3 in mixed supports. When the mass proportion of α-Al2O3 and C is 1![[thin space (1/6-em)]](https://www.rsc.org/images/entities/char_2009.gif) :
:![[thin space (1/6-em)]](https://www.rsc.org/images/entities/char_2009.gif) 1 in the Pd/Al2O3–C catalyst, the change of crystal lattice parameters is the biggest. In other words, the interaction of Pd metal and α-Al2O3 is the strongest. When the mass proportion of α-Al2O3 and C is 1
1 in the Pd/Al2O3–C catalyst, the change of crystal lattice parameters is the biggest. In other words, the interaction of Pd metal and α-Al2O3 is the strongest. When the mass proportion of α-Al2O3 and C is 1![[thin space (1/6-em)]](https://www.rsc.org/images/entities/char_2009.gif) :
:![[thin space (1/6-em)]](https://www.rsc.org/images/entities/char_2009.gif) 2, carbon content increases, which weakens the interaction of the Pd metal and α-Al2O3, resulting in the slight increase of the lattice parameter of Pd/Al2O3–C (1
2, carbon content increases, which weakens the interaction of the Pd metal and α-Al2O3, resulting in the slight increase of the lattice parameter of Pd/Al2O3–C (1![[thin space (1/6-em)]](https://www.rsc.org/images/entities/char_2009.gif) :
:![[thin space (1/6-em)]](https://www.rsc.org/images/entities/char_2009.gif) 2).
2).
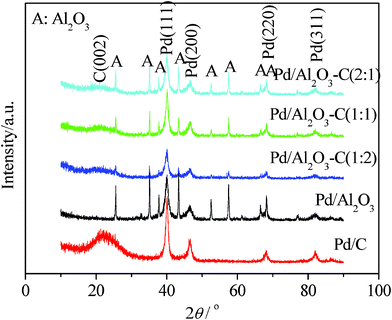 | ||
| Fig. 1 XRD patterns of the Pd/C, Pd/Al2O3, and Pd/Al2O3–C catalysts with different mass ratios of α-Al2O3 and C. | ||
The EDAX analysis of the Pd/Al2O3–C catalyst further proves coexistence of Pd and α-Al2O3 as shown in Fig. 2. It can be seen that the peaks of the Pd element are distinct in all patterns, which further proves that Pd nanoparticles were deposited onto the supports in our experimental conditions. The Pd contents are 20.44, 22.97, 17.78, 20.37, and 19.66 wt.% in Pd/C, Pd/Al2O3 and Pd/Al2O3–C catalysts with different mass ratios of α-Al2O3 and C of 2![[thin space (1/6-em)]](https://www.rsc.org/images/entities/char_2009.gif) :
:![[thin space (1/6-em)]](https://www.rsc.org/images/entities/char_2009.gif) 1, 1
1, 1![[thin space (1/6-em)]](https://www.rsc.org/images/entities/char_2009.gif) :
:![[thin space (1/6-em)]](https://www.rsc.org/images/entities/char_2009.gif) 1, 1
1, 1![[thin space (1/6-em)]](https://www.rsc.org/images/entities/char_2009.gif) :
:![[thin space (1/6-em)]](https://www.rsc.org/images/entities/char_2009.gif) 2, respectively, which are similar to the theoretical values.
2, respectively, which are similar to the theoretical values.
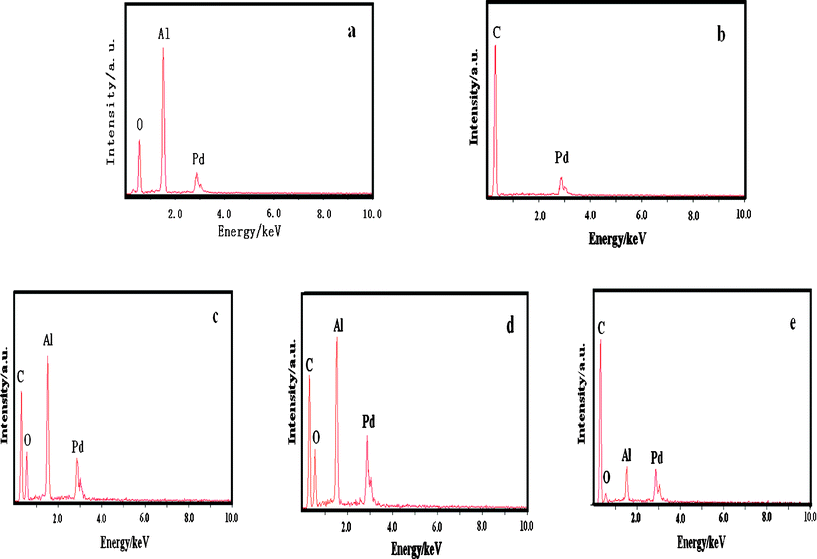 | ||
Fig. 2
EDAX patterns of the Pd/Al2O3 (a), Pd/C (b), Pd/Al2O3–C2![[thin space (1/6-em)]](https://www.rsc.org/images/entities/char_2009.gif) : :![[thin space (1/6-em)]](https://www.rsc.org/images/entities/char_2009.gif) 1 (c), Pd/Al2O3–C1 1 (c), Pd/Al2O3–C1![[thin space (1/6-em)]](https://www.rsc.org/images/entities/char_2009.gif) : :![[thin space (1/6-em)]](https://www.rsc.org/images/entities/char_2009.gif) 1 (d), and Pd/Al2O3–C1 1 (d), and Pd/Al2O3–C1![[thin space (1/6-em)]](https://www.rsc.org/images/entities/char_2009.gif) : :![[thin space (1/6-em)]](https://www.rsc.org/images/entities/char_2009.gif) 2 (e) catalysts. 2 (e) catalysts. | ||
The XPS test was employed to analyze the surface composition and oxidation state of the metals on the Pd/C, Pd/Al2O3, and Pd/Al2O3–C catalysts with different mass ratios of α-Al2O3 and C. The Pd 3d photoelectron core level spectra of Pd/C, Pd/Al2O3, and Pd/Al2O3–C show a double contribution from the binding energy of 332–348 eV. In order to quantify the possible oxidation states of Pd element, Pd 3d doublet splitting spectra have been fitted. The XPS spectra for elements Pd 3d and Al 2p core level regions in the Pd/C, Pd/Al2O3, and Pd/Al2O3–C catalysts are shown in Fig. 3, and their deconvoluted results are summarized in Table 1. The Pd 3d spectrum can be deconvoluted into three doublets with the low binding energies at 336.20, 337.40, and 338.90 eV, corresponding to metallic Pd, Pd(II), and Pd(IV) species in the Pd/Al2O3–C(1![[thin space (1/6-em)]](https://www.rsc.org/images/entities/char_2009.gif) :
:![[thin space (1/6-em)]](https://www.rsc.org/images/entities/char_2009.gif) 2) catalyst, respectively. The Pd(0) peaks of Pd/Al2O3–C catalyst show a positive shift of the Pd 3d binding energy by about 0.30 eV in comparison with that of Pd/C, indicating further metal–support interaction between Pd nanoparticles and α-Al2O3. The Pd(0) peaks of the Pd/Al2O3 catalyst show a negative shift of the Pd 3d binding energy by about 0.90 eV in comparison with that of Pd/C, possibly resulting in CO adsorption strength increasing and poor conductivity. Consequently, the Pd/Al2O3 catalyst has poor catalytic activity for formic acid electrooxidation. Moreover, the content of Pd(0) (62.55%) in the Pd/Al2O3–C (1
2) catalyst, respectively. The Pd(0) peaks of Pd/Al2O3–C catalyst show a positive shift of the Pd 3d binding energy by about 0.30 eV in comparison with that of Pd/C, indicating further metal–support interaction between Pd nanoparticles and α-Al2O3. The Pd(0) peaks of the Pd/Al2O3 catalyst show a negative shift of the Pd 3d binding energy by about 0.90 eV in comparison with that of Pd/C, possibly resulting in CO adsorption strength increasing and poor conductivity. Consequently, the Pd/Al2O3 catalyst has poor catalytic activity for formic acid electrooxidation. Moreover, the content of Pd(0) (62.55%) in the Pd/Al2O3–C (1![[thin space (1/6-em)]](https://www.rsc.org/images/entities/char_2009.gif) :
:![[thin space (1/6-em)]](https://www.rsc.org/images/entities/char_2009.gif) 2) catalyst increases in comparison with that of Pd/C (57.50%) by 5.05%, demonstrating that the Pd/Al2O3–C catalyst has a greater stability due to a greater corrosion resistance of Pd(0). For Al 2p, α-Al2O3 phase remains unchanged in the Pd/Al2O3–C and Pd/Al2O3 catalysts.
2) catalyst increases in comparison with that of Pd/C (57.50%) by 5.05%, demonstrating that the Pd/Al2O3–C catalyst has a greater stability due to a greater corrosion resistance of Pd(0). For Al 2p, α-Al2O3 phase remains unchanged in the Pd/Al2O3–C and Pd/Al2O3 catalysts.
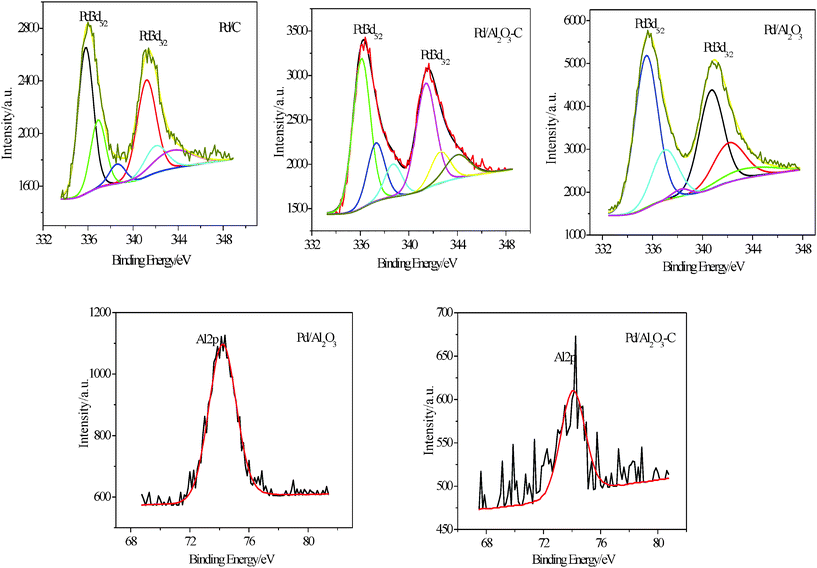 | ||
| Fig. 3 Deconvoluted Pd 3d and Al 2p peaks from XPS analysis of Pd/C, Pd/Al2O3, and Pd/Al2O3–C catalysts. | ||
![[thin space (1/6-em)]](https://www.rsc.org/images/entities/char_2009.gif) :
:![[thin space (1/6-em)]](https://www.rsc.org/images/entities/char_2009.gif) 2) catalysts
2) catalysts
| Catalyst | Peak | Binding energy (eV) | Species | Relative ratio (%) |
|---|---|---|---|---|
| Pd/C | Pd 3d | 343.50 | Pd(IV) | 4.36 |
| 342.00 | Pd(II) | 14.28 | ||
| 341.00 | Pd metal | 23.38 | ||
| 338.70 | Pd(IV) | 3.92 | ||
| 336.80 | Pd(II) | 19.44 | ||
| 335.80 | Pd metal | 34.12 | ||
| Pd/Al2O3 | Pd 3d | 343.50 | Pd(IV) | 2.79 |
| 341.70 | Pd(II) | 13.52 | ||
| 340.20 | Pd metal | 26.94 | ||
| 337.80 | Pd(IV) | 5.59 | ||
| 336.10 | Pd(II) | 20.91 | ||
| 334.90 | Pd metal | 30.24 | ||
Pd/Al2O3–C (1![[thin space (1/6-em)]](https://www.rsc.org/images/entities/char_2009.gif) : :![[thin space (1/6-em)]](https://www.rsc.org/images/entities/char_2009.gif) 2) 2) |
Pd 3d | 344.00 | Pd(IV) | 7.82 |
| 342.60 | Pd(II) | 8.23 | ||
| 341.40 | Pd metal | 27.57 | ||
| 338.70 | Pd(IV) | 7.71 | ||
| 337.30 | Pd(II) | 13.68 | ||
| 336.10 | Pd metal | 34.98 |
Fig. 4 shows the TEM images and histograms of the metal particle size distribution of the Pd/C and Pd/Al2O3–C catalysts with different mass ratios of α-Al2O3 and C of 1![[thin space (1/6-em)]](https://www.rsc.org/images/entities/char_2009.gif) :
:![[thin space (1/6-em)]](https://www.rsc.org/images/entities/char_2009.gif) 2, 1
2, 1![[thin space (1/6-em)]](https://www.rsc.org/images/entities/char_2009.gif) :
:![[thin space (1/6-em)]](https://www.rsc.org/images/entities/char_2009.gif) 1, and 2
1, and 2![[thin space (1/6-em)]](https://www.rsc.org/images/entities/char_2009.gif) :
:![[thin space (1/6-em)]](https://www.rsc.org/images/entities/char_2009.gif) 1, respectively. It can be observed that the metal particles on the Pd/C and different Pd/Al2O3–C catalysts are uniformly dispersed on the supports without severe agglomeration. The average particle sizes of the Pd/C and Pd/Al2O3–C catalysts with different mass ratios of α-Al2O3 and C of 1
1, respectively. It can be observed that the metal particles on the Pd/C and different Pd/Al2O3–C catalysts are uniformly dispersed on the supports without severe agglomeration. The average particle sizes of the Pd/C and Pd/Al2O3–C catalysts with different mass ratios of α-Al2O3 and C of 1![[thin space (1/6-em)]](https://www.rsc.org/images/entities/char_2009.gif) :
:![[thin space (1/6-em)]](https://www.rsc.org/images/entities/char_2009.gif) 2, 1
2, 1![[thin space (1/6-em)]](https://www.rsc.org/images/entities/char_2009.gif) :
:![[thin space (1/6-em)]](https://www.rsc.org/images/entities/char_2009.gif) 1, and 2
1, and 2![[thin space (1/6-em)]](https://www.rsc.org/images/entities/char_2009.gif) :
:![[thin space (1/6-em)]](https://www.rsc.org/images/entities/char_2009.gif) 1 are estimated to be about 5.64, 4.32, 4.49, and 4.66 nm, which are much smaller than those from XRD patterns estimated from Debye–Scherrer's equation25 to be about 8.6, 5.1, 6.5, and 5.2 nm.
1 are estimated to be about 5.64, 4.32, 4.49, and 4.66 nm, which are much smaller than those from XRD patterns estimated from Debye–Scherrer's equation25 to be about 8.6, 5.1, 6.5, and 5.2 nm.
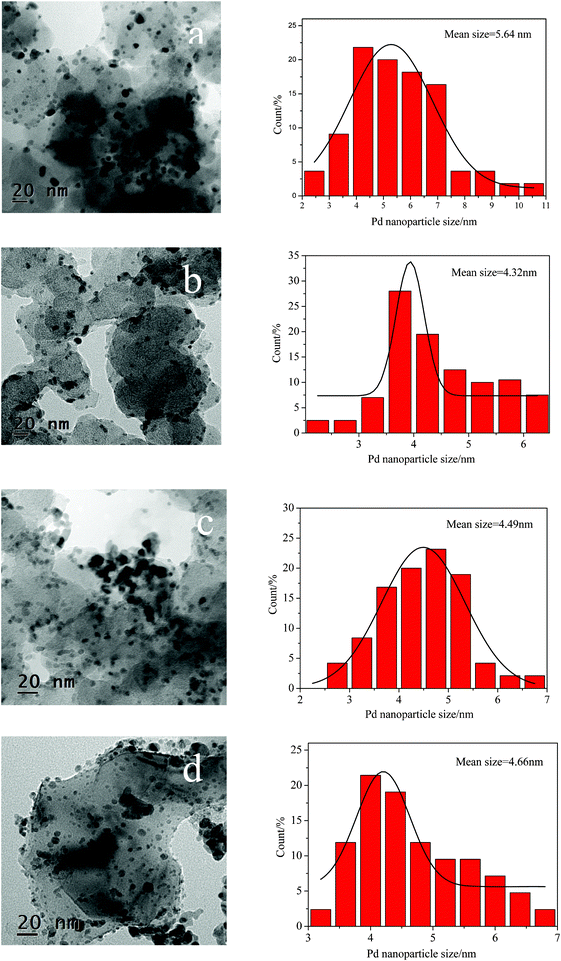 | ||
Fig. 4
TEM images and corresponding particle size distribution histograms of Pd/C (a), Pd/Al2O3–C (1![[thin space (1/6-em)]](https://www.rsc.org/images/entities/char_2009.gif) : :![[thin space (1/6-em)]](https://www.rsc.org/images/entities/char_2009.gif) 2) (b), Pd/Al2O3–C (1 2) (b), Pd/Al2O3–C (1![[thin space (1/6-em)]](https://www.rsc.org/images/entities/char_2009.gif) : :![[thin space (1/6-em)]](https://www.rsc.org/images/entities/char_2009.gif) 1) (c), and Pd/Al2O3–C (2 1) (c), and Pd/Al2O3–C (2![[thin space (1/6-em)]](https://www.rsc.org/images/entities/char_2009.gif) : :![[thin space (1/6-em)]](https://www.rsc.org/images/entities/char_2009.gif) 1) (d). 1) (d). | ||
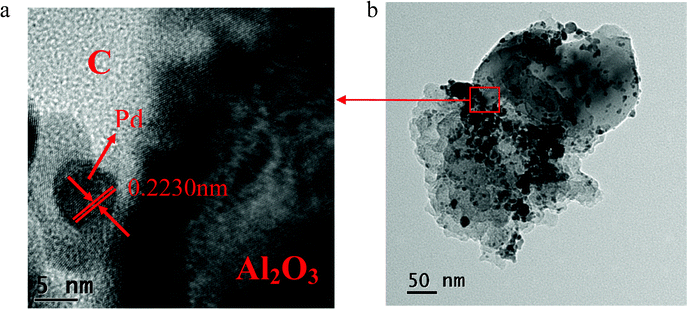
Fig. 5a shows a HRTEM image of Pd/Al2O3–C (1![[thin space (1/6-em)]](https://www.rsc.org/images/entities/char_2009.gif) :
:![[thin space (1/6-em)]](https://www.rsc.org/images/entities/char_2009.gif) 2) catalysts. Fig. 5b displays a corresponding low magnification TEM image to show the overview of the catalyst to know where the region in the HRTEM picture is. It can be clearly seen that a lattice distance of 0.2230 nm is obtained corresponding to the (111) planes of face centered cubic (fcc) Pd. It can also be distinctly seen from Fig. 5a that Pd nanoparticles were deposited on the boundaries of carbon black and α-Al2O3.
2) catalysts. Fig. 5b displays a corresponding low magnification TEM image to show the overview of the catalyst to know where the region in the HRTEM picture is. It can be clearly seen that a lattice distance of 0.2230 nm is obtained corresponding to the (111) planes of face centered cubic (fcc) Pd. It can also be distinctly seen from Fig. 5a that Pd nanoparticles were deposited on the boundaries of carbon black and α-Al2O3.
Fig. 6 shows the cyclic voltammogram curves of formic acid electrooxidation on the Pd/C, Pd/Al2O3, and Pd/Al2O3–C catalysts with different mass ratios of α-Al2O3 and C in the mixture supports in an Ar-saturated solution of 0.5 mol L−1H2SO4 containing 0.5 mol L−1formic acid at a scanning rate of 50 mV s−1 at 25 °C. The peak current densities in the positive direction are 24.55, 9.67, 36.97, 31.35, and 21.78 mA cm−2 at the Pd/C, Pd/Al2O3, Pd/Al2O3–C (1![[thin space (1/6-em)]](https://www.rsc.org/images/entities/char_2009.gif) :
:![[thin space (1/6-em)]](https://www.rsc.org/images/entities/char_2009.gif) 2), Pd/Al2O3–C (1
2), Pd/Al2O3–C (1![[thin space (1/6-em)]](https://www.rsc.org/images/entities/char_2009.gif) :
:![[thin space (1/6-em)]](https://www.rsc.org/images/entities/char_2009.gif) 1), and Pd/Al2O3–C (2
1), and Pd/Al2O3–C (2![[thin space (1/6-em)]](https://www.rsc.org/images/entities/char_2009.gif) :
:![[thin space (1/6-em)]](https://www.rsc.org/images/entities/char_2009.gif) 1) catalysts, respectively. Obviously, their activity order is as follows: Pd/Al2O3–C (1
1) catalysts, respectively. Obviously, their activity order is as follows: Pd/Al2O3–C (1![[thin space (1/6-em)]](https://www.rsc.org/images/entities/char_2009.gif) :
:![[thin space (1/6-em)]](https://www.rsc.org/images/entities/char_2009.gif) 2) > Pd/Al2O3–C (1
2) > Pd/Al2O3–C (1![[thin space (1/6-em)]](https://www.rsc.org/images/entities/char_2009.gif) :
:![[thin space (1/6-em)]](https://www.rsc.org/images/entities/char_2009.gif) 1) > Pd/C > Pd/Al2O3–C (2
1) > Pd/C > Pd/Al2O3–C (2![[thin space (1/6-em)]](https://www.rsc.org/images/entities/char_2009.gif) :
:![[thin space (1/6-em)]](https://www.rsc.org/images/entities/char_2009.gif) 1) > Pd/Al2O3. The current density of the main anodic peak of formic acid at the Pd/Al2O3 catalyst electrode is the lowest, indicating that the Pd/Al2O3 catalyst has the worst electrocatalytic activity for formic acid electrooxidation. Because α-Al2O3 possesses a poorer electrical conductivity than XC-72 carbon black, this results in the catalyst having a low activity for formic acid electrooxidation. The content of α-Al2O3 in the Pd/Al2O3–C catalyst evidently affects the catalytic activity for formic acid electrooxidation. When the mass ratio of α-Al2O3 and C is 1
1) > Pd/Al2O3. The current density of the main anodic peak of formic acid at the Pd/Al2O3 catalyst electrode is the lowest, indicating that the Pd/Al2O3 catalyst has the worst electrocatalytic activity for formic acid electrooxidation. Because α-Al2O3 possesses a poorer electrical conductivity than XC-72 carbon black, this results in the catalyst having a low activity for formic acid electrooxidation. The content of α-Al2O3 in the Pd/Al2O3–C catalyst evidently affects the catalytic activity for formic acid electrooxidation. When the mass ratio of α-Al2O3 and C is 1![[thin space (1/6-em)]](https://www.rsc.org/images/entities/char_2009.gif) :
:![[thin space (1/6-em)]](https://www.rsc.org/images/entities/char_2009.gif) 2, the electrocatalytic activity of the Pd/Al2O3–C catalyst for formic acid electrooxidation is the greatest among all the catalysts due to the synergistic effect and the increasing of support conductivity. The peak current density of formic acid electrooxidation on the Pd/Al2O3–C (1
2, the electrocatalytic activity of the Pd/Al2O3–C catalyst for formic acid electrooxidation is the greatest among all the catalysts due to the synergistic effect and the increasing of support conductivity. The peak current density of formic acid electrooxidation on the Pd/Al2O3–C (1![[thin space (1/6-em)]](https://www.rsc.org/images/entities/char_2009.gif) :
:![[thin space (1/6-em)]](https://www.rsc.org/images/entities/char_2009.gif) 2) electrode is nearly 1.5 times greater than that on Pd/C. The result indicates that a proper addition of α-Al2O3 may significantly improve catalytic activity for formic acid electrooxidation. However, the performance of the catalyst declines with an excess amount of α-Al2O3 due to the decrease of the support conductivity and the blockage of the active sites on the Pd surface, which impedes the further formic acid electrooxidation and results in the current decay on it.
2) electrode is nearly 1.5 times greater than that on Pd/C. The result indicates that a proper addition of α-Al2O3 may significantly improve catalytic activity for formic acid electrooxidation. However, the performance of the catalyst declines with an excess amount of α-Al2O3 due to the decrease of the support conductivity and the blockage of the active sites on the Pd surface, which impedes the further formic acid electrooxidation and results in the current decay on it.
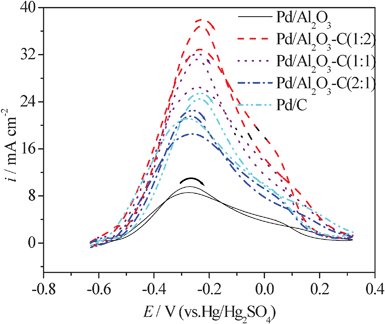 | ||
| Fig. 6 CV curves of formic acid electrooxidation on the Pd/Al2O3–C catalysts with different mass ratios of α-Al2O3 and C in the 0.5 mol L−1HCOOH + 0.5 mol L−1H2SO4 solution at 50 mV s−1 and 25 °C. | ||
The amperometric i–t technique was widely applied to explore the catalytic stability and reactive mechanism.26,27 Herein, the amperometric i–t curves probe the influence of α-Al2O3 on the stability of the Pd nanoparticles. Fig. 7 shows typical i–t responses for formic acid electrooxidation under constant potential of −0.4 V in 0.5 mol L−1H2SO4 containing 0.5 mol L−1HCOOH at 25 °C. As observed, it is apparent that there are sharp drops in activity of Pd/C and Pd/Al2O3 catalysts during the whole range compared to the Pd/Al2O3–C ones. After 3600 s, the current densities on Pd/Al2O3–C (1![[thin space (1/6-em)]](https://www.rsc.org/images/entities/char_2009.gif) :
:![[thin space (1/6-em)]](https://www.rsc.org/images/entities/char_2009.gif) 2), Pd/Al2O3–C (1
2), Pd/Al2O3–C (1![[thin space (1/6-em)]](https://www.rsc.org/images/entities/char_2009.gif) :
:![[thin space (1/6-em)]](https://www.rsc.org/images/entities/char_2009.gif) 1), Pd/Al2O3–C (2
1), Pd/Al2O3–C (2![[thin space (1/6-em)]](https://www.rsc.org/images/entities/char_2009.gif) :
:![[thin space (1/6-em)]](https://www.rsc.org/images/entities/char_2009.gif) 1), Pd/C, and Pd/Al2O3 catalysts are 2.013, 1.728, 1.296, 1.296, and 0.579 mA cm−2, indicating the proper addition of α-Al2O3 into the catalysts can significantly enhance the stability of Pd nanoparticles toward formic acid electrooxidation. The possible reason for this is that the presence of α-Al2O3 alleviates the poisoning of strongly adsorptive intermediates (such as COads, COOHads and so on), thus improving the catalytic activity and the stability of Pd nanoparticles.
1), Pd/C, and Pd/Al2O3 catalysts are 2.013, 1.728, 1.296, 1.296, and 0.579 mA cm−2, indicating the proper addition of α-Al2O3 into the catalysts can significantly enhance the stability of Pd nanoparticles toward formic acid electrooxidation. The possible reason for this is that the presence of α-Al2O3 alleviates the poisoning of strongly adsorptive intermediates (such as COads, COOHads and so on), thus improving the catalytic activity and the stability of Pd nanoparticles.
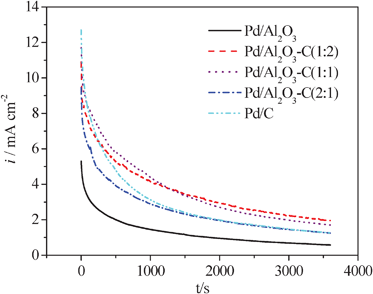 | ||
| Fig. 7 Amperometric i–t curves at −0.4 V for the Pd/C, Pd/Al2O3, Pd/Al2O3–C catalysts with different mass ratios of α-Al2O3 and C in an Ar-saturated solution of 0.5 mol L−1HCOOH and 0.5 mol L−1H2SO4, 25 °C. | ||
Electrochemical impedance spectroscopy (EIS) is an effective measurement to determine the charge transfer resistance,28 which reflects the activity of a catalyst for formic acid electrooxidation. Fig. 8 shows the impedance plots for the catalysts in a solution of 0.5 mol L−1H2SO4 containing 0.5 mol L−1HCOOH. In the spectra, the smaller the diameter of an arc is, the better the catalytic activity is. A large arc reveals a slow reaction rate of formic acid dehydrogenation oxidation. It is understood that the slow kinetics are caused by the intermediate COads from formic acid dehydrogenation which are strongly adsorbed on Pd sites and block continuous adsorption and dehydrogenation of formic acid molecules.29–31 It can be seen from Fig. 8 that compared to Pd/C and Pd/Al2O3 alone, the semicircles of the Pd/Al2O3–C catalysts are smaller. The Pd/Al2O3–C (1![[thin space (1/6-em)]](https://www.rsc.org/images/entities/char_2009.gif) :
:![[thin space (1/6-em)]](https://www.rsc.org/images/entities/char_2009.gif) 2) exhibits the smallest semicircle, showing the electrooxidation rate on it is much faster than other catalysts. The proper addition of α-Al2O3 decreases the charge transfer resistance, indicating an improved catalytic activity towards formic acid electrooxidation. EIS studies provide an additional evidence for the promoting effect of α-Al2O3.
2) exhibits the smallest semicircle, showing the electrooxidation rate on it is much faster than other catalysts. The proper addition of α-Al2O3 decreases the charge transfer resistance, indicating an improved catalytic activity towards formic acid electrooxidation. EIS studies provide an additional evidence for the promoting effect of α-Al2O3.
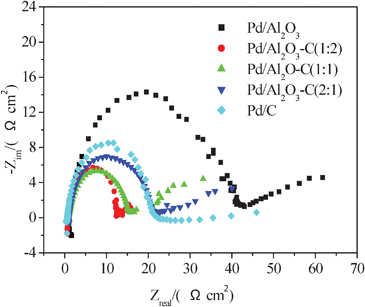 | ||
| Fig. 8 Nyquist plots of EIS for formic acid electrooxidation on the Pd/C, Pd/Al2O3 and Pd/Al2O3–C catalysts with different ratios of α-Al2O3 and C in 0.5 mol L−1HCOOH and 0.5 mol L−1H2SO4 at 25 °C. Potential at −0.45 V. | ||
4. Conclusions
In summary, Pd loaded on a mixture support of α-Al2O3 and Vulcan XC-72 carbon black provides a novel Pd electrocatalyst for DFAFC. The activity of the catalyst with α-Al2O3 as the support is worse than that of the catalyst with carbon black as the support, owing to the poor electrical conductivity of α-Al2O3. However, the activity of the catalyst with α-Al2O3 and Vulcan XC-72 carbon black as a mixture support is evidently enhanced in comparison with that of the catalyst with carbon black as the support. The results of physicochemical and electrochemical tests prove that the Pd/Al2O3–C catalyst with a suitable ratio of α-Al2O3 and C shows a greater dispersion of Pd nanoparticles, better catalytic activity for formic acid electrooxidation and superior stability than the Pd/C catalyst. The Pd/Al2O3–C catalyst with a mass ratio of α-Al2O3 and C of 1![[thin space (1/6-em)]](https://www.rsc.org/images/entities/char_2009.gif) :
:![[thin space (1/6-em)]](https://www.rsc.org/images/entities/char_2009.gif) 2 exhibits the best catalytic activity for formic acid electrooxidation. Its improvement is the results of the inherently excellent mechanical resistance, stability of α-Al2O3 in acid environment and metal–support interaction between Pd nanoparticles and α-Al2O3.
2 exhibits the best catalytic activity for formic acid electrooxidation. Its improvement is the results of the inherently excellent mechanical resistance, stability of α-Al2O3 in acid environment and metal–support interaction between Pd nanoparticles and α-Al2O3.
Acknowledgements
This research is financially supported by the National Natural Science Foundation of China (Grant No. 20606007), the Scientific Research Foundation for the Returned Overseas Chinese Scholars, State Education Ministry (2008), and Scientific Research Foundation for Returned Scholars of Heilongjiang Province of China (LC08C33).References
- Y. M. Zhu, K. Zakia and R. I. Masel, J. Power Sources, 2005, 139, 15–20 CrossRef CAS.
- X. G. Zhang, A. Toshihide, M. Yasushi, Y. Kiyochika and T. Yoshio, Electrochim. Acta, 1995, 40, 1889–1897 CrossRef CAS.
- S. Ha, R. Larsen, Y. Zhu and R. I. Masel, Fuel Cells, 2004, 4, 337–343 CrossRef CAS.
- X. Yu and P. G. Pickup, J. Power Sources, 2008, 177, 124–132 CrossRef.
- A. Bhattacharya, A. Hazra, S. Chatterjee, P. Sen, S. Laha and I. Basumallick, J. Power Sources, 2004, 136, 208–210 CrossRef CAS.
- E. S. Steigerwalt, G. A. Deluga, D. E. Cliffel and C. M. Lukehart, J. Phys. Chem. B, 2001, 105, 8097–8101 CrossRef CAS.
- G. Chai, S. B. Yoon, S. Kang, J. H. Choi, Y. E. Sung, Y. S. Ahn, H. S. Kim and J. S. Yu, Electrochim. Acta, 2004, 50, 823–826 CrossRef CAS.
- J. Ding, K. Y. Chan, J. W. Ren and F. S. Xiao, Electrochim. Acta, 2005, 50, 3131–3141 CrossRef CAS.
- M. C. Gutierrez, M. J. Hortigulela, J. M. Amarilla, R. Jimenez, M. L. Ferrer and F. D. Monte, J. Phys. Chem. C, 2007, 111, 5557–5560 CAS.
- F. B. Su, J. H. Zeng, Y. S. Yu, L. Lv, J. Y. Lee and X. S. Zhao, Carbon, 2005, 43, 2368–2373 Search PubMed.
- G. S. Chai, S. B. Yoon, J. S. Yu, J. H. Choi and Y. E. Sung, J. Phys. Chem. B, 2004, 108, 7074–7079 CrossRef CAS.
- M. L. Anderson, R. M. Stroud and D. R. Rolison, Nano Lett., 2002, 2, 235–240 CrossRef CAS.
- W. Z. Li, C. H. Liang, J. S. Qiu, W. J. Zhou, H. M. Han, Z. B. Wei, G. Q. Sun and Q. Xin, Carbon, 2002, 40, 787–803 CrossRef.
- J. J. Wang, G. P. Yin, Y. G. Chen, R. Y. Li and X. L. Sun, Int. J. Hydrogen Energy, 2009, 34, 8270–8275 CrossRef CAS.
- C. Kim, Y. J. Kim, Y. A. Kim, T. Yanagisawa, K. C. Park and M. Endo, J. Appl. Phys., 2004, 96, 5904–5907 Search PubMed.
- Z. W. Chen and M. Waje, Angew. Chem., Int. Ed., 2007, 46, 4060–4063 CrossRef CAS.
- Z. H. Zhang, Y. J. Huang, J. J. Ge, C. P. Liu, T. H. Lu and W. Xing, Electrochem. Commun., 2008, 10, 995–999 CrossRef.
- K. Drew, G. Girishkumar, K. Vinodgopal and P. V. Kamat, J. Phys. Chem. B, 2005, 109, 11851–11857 CrossRef CAS.
- S. Shanmugam and A. Gedanken, Small, 2007, 7, 1189–1193 CrossRef.
- H. Q. Song, X. P. Qiu, X. X. Li, F. S. Li, W. T. Zhu and L. Q. Chen, J. Power Sources, 2007, 170, 50–54 CrossRef CAS.
- X. Liu, J. Chen, G. Liu, L. Zhang, H. M. Zhang and B. L. Yi, J. Power Sources, 2010, 195, 4098–4103 CrossRef CAS.
- D. M. He, L. X. Yang, S. Y. Kuang and Q. Y. Cai, Electrochem. Commun., 2007, 9, 2467–2472 CrossRef CAS.
- Z. Z. Jiang, Z. B. Wang, Y. Y. Chu, D. M. Gu and G. P. Yin, Energy Environ. Sci., 2011, 4, 728–735 CAS.
- D. M. Gu, Y. Y. Chu, Z. B. Wang, Z. Z. Jiang, G. P. Yin and Y. Liu, Appl. Catal., B, 2011, 102, 9–18 CrossRef CAS.
- C. Z. He, H. R. Kunz and J. M. Fenton, J. Electrochem. Soc., 1997, 144, 970–979 CrossRef.
- M. C. Zhao, C. Rice, R. I. Masel, P. Waszczuk and A. Wieckowskib, J. Electrochem. Soc., 2004, 151, A131–A136 CrossRef CAS.
- E. Herrero, K. Franaszczuk and A. Wieckowski, J. Phys. Chem., 1994, 98, 5074–5083 CrossRef CAS.
- J. H. Kim, H. Y. Ha, I. H. Oh, S. A. Hong, H. N. Kim and H. I. Lee, Electrochim. Acta, 2004, 50, 801–806 CrossRef CAS.
- Z. B. Wang, G. P. Yin, Y. Y. Shao, B. Q. Yang, P. F. Shi and P. X. Feng, J. Power Sources, 2007, 165, 9–15 CrossRef CAS.
- I. M. Hsing, X. Wang and Y. J. Leng, J. Electrochem. Soc., 2002, 149, A615–621 CrossRef CAS.
- G. Wu, L. Li and B. Q. Xu, Electrochim. Acta, 2004, 50, 1–10 CrossRef CAS.
| This journal is © The Royal Society of Chemistry 2012 |

