Static light scattering of triaxial nanoparticle suspensions in the Rayleigh-Gans-Debye regime: application to cellulose nanocrystals†
Esteban E.
Ureña-Benavides
and
Christopher L.
Kitchens
*
Department of Chemical and Biomolecular Engineering, Clemson University, Clemson, South Carolina 29634, USA. E-mail: ckitche@clemson.edu; Fax: 864-656-0784; Tel: 864-656-2131
First published on 16th December 2011
Abstract
A simple method has been developed to measure the dimensions of triaxial nanoparticles through light scattering data. The application of Debye's expansion of the form factor has been extended beyond the second moment of the difference of distances (radius of gyration). Analytical expressions have been derived for the fourth and sixth moments that are valid for all nanoparticle shapes. The moments provide information about the aspect ratio of the nanoparticles regardless of the geometry. If a shape is assumed, simple algebraic expressions for the moments can be obtained for monodisperse and polydisperse samples, which can be used to solve for specific nanoparticle dimensions. The methods described here have been applied to static light scattering measurements of dilute aqueous suspension of triaxial cellulose nanocrystals isolated from cotton. When the polydispersity is included, the dimensions determined from light scattering data (6.4 × 28 × 152 nm) are in close agreement with atomic force microscopy measurements. This methodology can be easily applied to nanoparticles of complex shapes and extended to other scattering techniques; it would be especially useful for polymer based nanoparticles and biological macromolecules.
Introduction
Nanomaterials have infiltrated virtually all areas of current technology. They have been used for reinforcement and property enhancement of different materials,1–3 catalysis,4 targeted drug delivery,5,6 sensing devices,7etc. The diverse applications have a commonality in their dependence on the size, shape, polydispersity, and interparticle interactions. Thus appropriate characterization of these properties is fundamental for the synthesis, processing, design and application of nanomaterials.The size and morphology of nanoparticles are commonly determined by transmission electron microscopy (TEM), scanning electron microscopy (SEM) or atomic force microscopy (AFM); however several difficulties exist. Obtaining good contrast with TEM can be difficult for bio-based and polymer based particles; requiring the use of high atomic number staining agents that vary depending on surface chemistry.8SEM imaging of nonconductive materials requires conductive coatings to avoid charging, which frequently mask nanosized details; moreover SEM in general has lower resolution than TEM and AFM.8Electron microscopy techniques do not provide information about interparticle interactions and require high vacuum. On the other hand, AFM images are a convolution of the tip shape and the sample being analyzed which can overestimate the lateral dimensions of the particles.8 Even though AFM measures forces between the tip and a surface, determination of nanoscale interparticle interactions is still not feasible with AFM. All of these techniques are destructive, consider only a small fraction of the sample and cannot be done in situ. They require drying a nanoparticle suspension on a surface which can induce agglomeration; cryo-TEM is an alternative, but tradeoffs include reduced contrast, solvent sublimation under high vacuum, and morphology distortion of bio-based samples.9
Small Angle Neutron Scattering (SANS), Small Angle X-ray Scattering (SAXS) and static light scattering (SLS) overcome most of the difficulties typically found with microscopy techniques.9Neutrons and X-rays can be used to measure distances from the angstrom scale to a few microns.10,11Light scattering has a more restricted size range and often needs to be paired with X-ray and neutron measurements; however it is a lower cost and widely accessible technique.10–12Scattering methods can be performed in situ and are non-destructive, which enables time-resolved measurements of a single system.13 One of the biggest difficulties of scattering techniques is that the intensity of the scattered light or neutrons must be fit to form factor models. These models are unique for each nanoparticle shape, and the computation becomes difficult for complex geometries.10,14 They also require a large number of data points which are frequently impractical to use with light scattering measurements. The data can also be fit to a polynomial model (regardless of the shape) which represents a series expansion of the real form factor.12,15 Typically, only the first coefficient of the expansion is studied and it is used to determine the radius of gyration, providing information about size.
In this study, we have determined expressions for the second and third coefficients of the expansion which are valid for every nanoparticle shape, and can be applied to any macromolecule conformation. We have analyzed the effect of aspect ratio, shape and polydispersity on these terms to obtain information other than just size of the nanoparticle. Moreover, if a specific shape is assumed or known, the expressions can be solved to calculate up to three different dimensions in situ (without drying the sample).
The methods described here have been applied to a suspension of cellulose nanocrystals (CNC) isolated from cotton, viasulfuric acid hydrolysis.16 The results are compared to measurements obtained from AFM for the same population of particles. Terech et al. used SANS and SAXS to study the size and shape of CNC isolated from tunicate and found that a cuboid (rectangular parallelepiped) model fit their data much better than a rod model.17 Braun et al. used SLS to determine the dimensions of CNC suspensions isolated from cotton linter taking into account polydispersity; for which they assumed a spheroidal (biaxial) shape for the nanoparticles. However they were constrained to only two equations, which yielded the CNC length and width with estimated polydispersities.1 Here we approximate the CNC to triaxial cuboidal and ellipsoidal geometries and provide two additional equations to solve. A representation of the shapes is shown in Fig. 1.
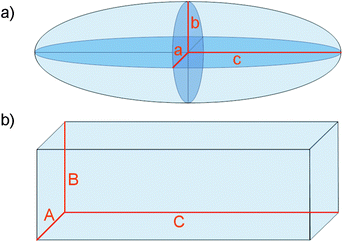 | ||
| Fig. 1 Representation of a) an ellipsoid of semiaxis a, b and c and b) a cuboid of axis A, B and C. | ||
Theory of light scattering
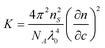
The relation between scattered intensity, angle (θ), and concentration (c) was described by Zimm who derived the following expression, valid for very dilute samples in the Rayleigh-Gans-Debye regime,18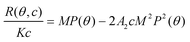 | (1) |
where R(θ,c) is the excess Rayleigh ratio that describes the intensity scattered by the sample less the solvent (analyte) normalized by the volume observed by the detector. P(θ) is the form factor, M is the molecular weight, A2 is the second virial coefficient and K is an optical constant defined by
 | (2) |
where NA is Avogadro's constant, n is the refractive index and λ is the wavelength of light; the subscripts S and 0 refer to the solvent and the incident beam, respectively.
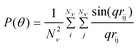
Several models exist for P(θ) that are unique for each particle shape or macromolecule conformation, however the exact expression for the form factor of any particle or macromolecule that is independent of shape is given by15
 | (3) |
where q = (4πnS/λ0)sin(θ/2) is the magnitude of the scattering vector, rij is the magnitude of the vector rij = ri − rj, which represents the distance between scatterers i and j within a particle, and Nν is the total number of scatterers in a nanoparticle of macromolecule.
When a polydisperse sample is considered it is useful to visualize it as a mixture of NC components; each component ν includes several nanoparticles all having the same dimensions and molecular weight (Mν). In this case M in eqn 1 must be replaced by the weight average molecular weight (MW) and the form factor has to be replaced by the z-average value which becomes19,20
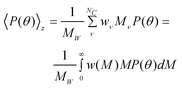 | (4) |
where wν represent the weight fraction of component ν, w(M) is any adequate weight distribution function, and w(M)dM is the weight fraction of all particles with molecular weight between M and M + dM. Here MW can be calculated by
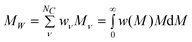 | (5) |
A polynomial expansion of eqn 3 can be performed to obtain an approximate form factor valid for small q, which is convenient for light scattering measurements given that the technique does not afford measuring high q values.15,21
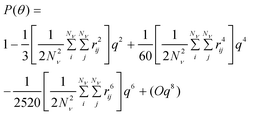
| (6) |
| (7) |
 | (8) |
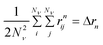
Moments of rij
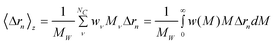
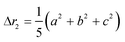
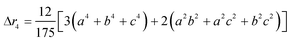
The second moment is commonly referred to as the square radius of gyration and is an indication of the nanoparticle size; however two nanoparticles with the same volume can have a different Δr2 if their shapes or aspect ratios are not the same. The higher order terms have not been extensively studied and typically no information is obtained from them. In this section we present general expressions to calculate their values and discuss their significance.Using the definition of Riemann integral22 and assuming that the number of scatterers in each nanoparticle is large enough, it is possible to show that
 | (9) |
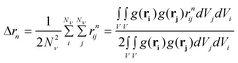
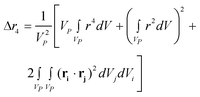
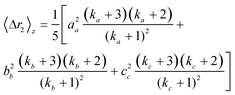
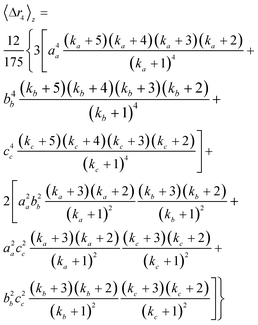
where g(r) and V are the one-body radial distribution function and integration volume. From the above equation and assuming that the particle is large enough to have a homogeneous mass distribution, such that g(r) = 1, and integrating over the particle volume (VP), a general expression valid for every nanoparticle shape can be obtained for the moments. Here the origin of the position vector (r) is defined at the center of mass of the particle.

| (10a) |
| (10b) |
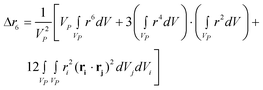
| (10c) |
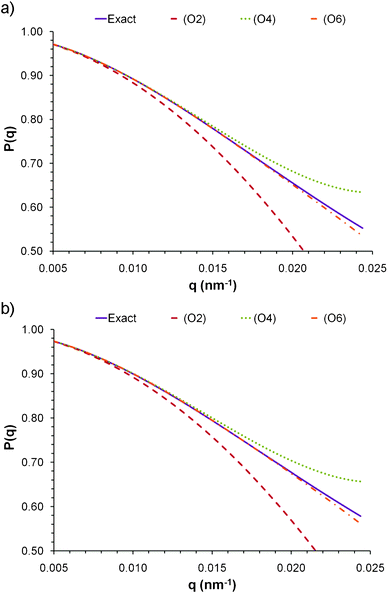 | ||
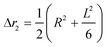
| Fig. 2 Form factors calculated for a) a cuboid with axes A = 20 nm, B = 40 nm, C = 200 nm, and b) an ellipsoid with semi-axes a = 12.4 nm, b = 24.8 nm and c = 124 nm. The volume and the A/B (or a/b) ratio of both particles are the same. | ||


Measurement of the dimensions of triaxial nanoparticles from light scattering is very difficult with current data analysis techniques; which require fitting the experimental results to highly complex models that are unique for different nanoparticle shapes.10,14 Braun et al. used the molecular weight (M = ρηNAVP) in conjunction with the mean square radius of gyration to solve for the dimensions of spheroidal particles; the symbol ρ refers to crystalline density of the nanoparticle, η is a factor for packing density and crystal imperfections, and ρη is the overall particle density.1 However, their methodology can only be used to solve for two parameters; thus is not suitable for triaxial particles. Using the first three moments of the form factor and the molecular weight provides four simple equations that can be used to solve for up to four different variables to characterize size and shape.
Some important limitations must be considered before employing this method. Obtaining a reliable value with light scattering for the high order moments is only possible if the particle is large enough. This is because the wavelength of light is too large to access to the high q range. However, since X-rays and neutrons can access high q values,10,11 they can be used to measure the higher order moments of small particles. It is also important to consider the magnitude of the characteristic dimensions being analyzed. The best results can be obtained when 1/q is of similar magnitude to the dimensions of interest. However, if one dimension falls outside the q range studied, then it is expected that the molecular weight will provide the extra equation required to solve for it. Another significant consideration is that high order polynomials have more roots; yet after eliminating the complex and negative solutions the number of possible answers will be readily reduced. Finding an exact answer to the system of equations would require a completely error free experiment which is virtually impossible to achieve. Thus, the best option is to find the set of parameters that minimize the differences between the equations and the measured moments. If a polydisperse sample is considered, an assumption must be done with regards to the type of weight distribution function; plus, the number of unknowns is increased given that the polydispersity has to be solved for each dimension.
Interpretation of the moments
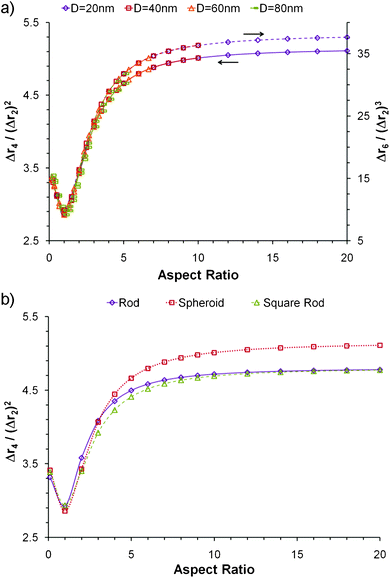
Even if the shape is unknown, important information can still be obtained from the different Δrn's. The second moment of any distribution indicates how broad it is; thus for the population of rij within a nanoparticle, it is a measurement of the size.12 The fourth moment provides information about the “peakedness” of a distribution, and thus for the population of rij's, it will provide a measurement of the elongation, or aspect ratio. The sixth moment will give similar information than the fourth moment.All Δrn increase with particle size, yet is possible to obtain normalized moments by dividing Δrn/(Δr2)n/2; these values are independent of nanoparticle size, for the shapes and orders studied here, and can be used to evaluate the aspect ratio, as evidenced in Fig. 3a for spheroidal particles of different cross sectional diameter. When the aspect ratio is one (a sphere), the normalized moments go through a minimum which for Δr4/(Δr2)2 is always 20/7 (∼2.857), and for Δr6/(Δr2)3 is always 800/81 (∼9.876) regardless of the diameter of the sphere. At the left of the minima the nanoparticles are disk like (oblate spheroids); at the right they are rod like (prolate spheroids).
 | ||
| Fig. 3 Normalized moments versus aspect ratio. a) Δr4/(Δr2)2 and Δr6/(Δr2)3 for spheroids with different diameters and b) Δr4/(Δr2)2 for biaxial nanoparticles of different shapes. | ||
An important observation that can be drawn from Fig. 3a is that at large aspect ratios the normalized Δrn reach a plateau and they can no longer be used as an indicator of elongation; however Δr6/(Δr2)3 reaches the plateau at a slightly higher value than Δr4/(Δr2)2. It must be noted that a broad q range is required to accurately measure the dimensions of particles with very large aspect ratios. Since the higher order moments can only be measured at large q values, the order of Δrn/(Δr2)n/2 will have to increase to shift the plateau to higher aspect ratios and appropriately represent the elongation of very long particles.
The shape also has an effect on the normalized moments (Fig. 3b). Again, the minimum occurs when the aspect ratio is one; at the left the particles are disk like, and at the right they are rod like. However it must be noted that at large aspect ratios the nanoparticles with sharp edges, such as the rods, have a smaller moment than the rounded spheroidal particles. Particles with rounded edges have a smaller volume than those with sharp edges for equal characteristic dimensions. Since the moments are normalized by the size (second moment), the particles with smaller volume will have a larger normalized moment at high aspect ratio. Nevertheless, when the aspect ratio is close to one, the opposite occurs; particles with sharp edges, like a cube, have large diagonals and may be considered to be more elongated than a sphere. Consequently, the value of Δr4/(Δr2)2 for a cube is 44/15 (∼2.933) which is slightly larger than for a cylinder with aspect ratio of one (366/125 ∼ 2.928), which is larger than for a sphere (20/7 ∼ 2.857). The differences are only significant near the plateau region; thus the normalized moments can still be used as an indication of aspect ratio regardless of shape as long as the measurements correspond to the high slope section of the curve (i.e. if the appropriate order moment is being used for the desired aspect ratio).
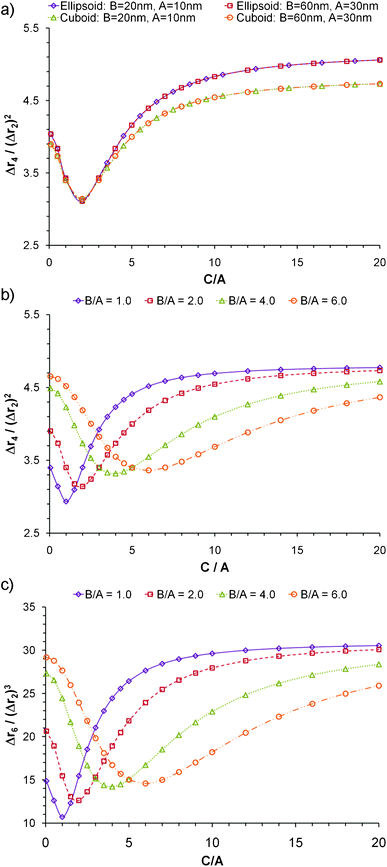
The case of triaxial particles is considered in Fig. 4. The normalized moments depend on the shape and on the ratio of the three dimensions, but not on size. Fig. 4a shows that as long as the ratio B/A and the shape remain constant, the curves of the normalized moments versus C/A are always equal regardless of the volume. Again the rounded shapes yield higher normalized moments at large aspect ratios, but slightly lower values when the aspect ratio is small. A significant difference is observed with regards to the minima of all the curves. Fig. 4b and 4c show Δr4/(Δr2)2 and Δr6/(Δr2)3 for cuboidal particles; in all cases the minima occurs when the two largest dimensions are equal and the particle resembles a disk more than a rod. The magnitude of the minimum in each curve decreases as the ratio B/A gets smaller until it reaches the lowest value for the case when all dimensions are equal. In general, the normalized moments increase as the degree of symmetry decreases; a sphere being the most symmetric shape, possesses the lowest possible Δrn/(Δr2)n/2.
 | ||
| Fig. 4 Normalized moments of triaxial nanoparticlesversus ratio of axes C/A. a) Δr4/(Δr2) for particles of variable shape and size; b) Δr4/(Δr2)2 for cuboidal particles of variable B/A ratio; and c) Δr6/(Δr2)3 for cuboidal particles of variable B/A ratio | ||
Polydisperse samples
Polydispersity also has an effect on the normalized moments; Fig. 5 shows a series of curves generated for populations of nanoparticles with a number average volume (Vn) of 24![[thin space (1/6-em)]](https://www.rsc.org/images/entities/char_2009.gif) 000 nm3, and a constant B/A ratio of 2. The integral in Eqn 8 was used to generate the curves, where the Schulz-Zimm weight distribution1,19,25 was used for w(M) (the distribution function is provided as supporting information†). The density was assumed constant for all particles, such that the molecular weight M could be replaced by the volume V. The polydispersity index was defined as PDI = Mw/Mn = VV/Vn, where VV is the volume-average volume and Mn is number average molecular weight.
000 nm3, and a constant B/A ratio of 2. The integral in Eqn 8 was used to generate the curves, where the Schulz-Zimm weight distribution1,19,25 was used for w(M) (the distribution function is provided as supporting information†). The density was assumed constant for all particles, such that the molecular weight M could be replaced by the volume V. The polydispersity index was defined as PDI = Mw/Mn = VV/Vn, where VV is the volume-average volume and Mn is number average molecular weight.
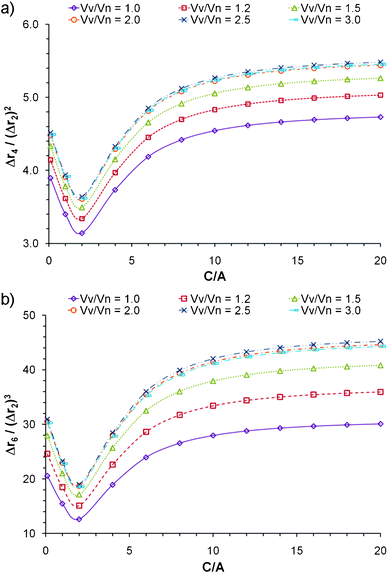 | ||
| Fig. 5 Effect of volume polydispersity on the behavior of a) Δr4/(Δr2)2 and b) Δr6/(Δr2)3versus C/A for cuboidal particles. Each curve corresponds to particles with a number average volume of 24000 nm3, and constant B/A of 2. | ||
The normalized moments increase quickly as the sample deviates from monodispersity with PDI increasing from 1 to 2, after which the effect diminishes significantly. If a sample is measured and the normalized moments have a value larger than would be expected for an infinite aspect ratio; it is likely that the sample is composed of polydisperse elongated nanoparticles. However if no information about polydispersity is available, it would generally be difficult to distinguish between monodisperse elongated particles and a polydisperse population with low aspect ratio. Nevertheless, if a light scattering instrument is used in series with a gel permeation chromatograph (GPC), which is a common practice, the effect of polydispersity will be considerably minimized.12 Moreover the normalized moments can be used to assign an aspect ratio to each slice analyzed from the chromatograph. Alternatively, Flow Field Fractionation can also be employed to obtain monodispersed populations of the nanoparticles.
Results and discussion
Moments of distances in CNC
According to the method described by Zimm, Kc/R(θ,c) must be plotted against sin2(θ) because the resulting curve has a longer range of linearity than a plot of R(θ,c)/Kc vs. sin2(θ).19 In this study a larger degree of curvature is desired to fit Δr4 and Δr6; thus the latter curve is plotted. Fig. 6 shows the construction of a plot of R(θ,c)/Kc vs. sin2(θ) + 5 × 10⁴c for several CNC concentrations and the extrapolations to zero concentration and zero angle. Analogous to Zimm's method the molecular weight of the nanoparticle is obtained from eqn 1 for the case when c = 0 and θ = 0. The moments Δr2, Δr4 and Δr6 are found by fitting the zero concentration curve to an order three polynomial; an order 2 fit does not describe the shape well at the larger angles.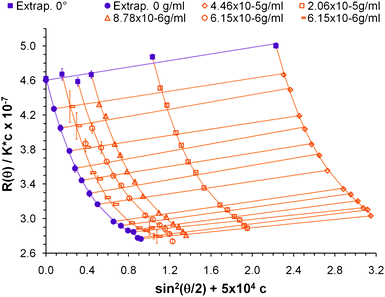 | ||
| Fig. 6 Scattering intensity construction for several CNC samples showing the extrapolation to zero angle and zero concentration. The constant 5 × 10⁴ is an arbitrary shift factor to differentiate each sample. | ||
A summary of the light scattering measurements is provided in Table 2. The magnitude of the fourth normalized moment is large, indicative of elongated particles. Moreover, since the value is greater than expected for monodisperse particles of infinite aspect ratio, it is evident that the population is polydisperse. This is expected for populations of CNC.26 Similar information can be obtained from the sixth normalized moment, but caution must be employed. For the higher angles studied the eight order moment becomes important, thus affecting the measurement of the sixth moment and yielding a smaller value. Since the q range studied is limited, fitting the data to an order four polynomial does not yield a good measurement of the sixth order moment either.
| Moment/molecular weight | AFM | Light scattering | |
|---|---|---|---|
| Ellipsoid | Cuboid | ||
| M w (g mol−1) | 3.3 ± 0.3 × 10⁷ | 6.3 ± 0.6 × 10⁷ | 4.62 ± 0.03 × 10⁷ |
| Δr2 (nm2) | 3.2 ± 0.4 × 10³ | 5.3 ± 0.7 × 10³ | 4.8 ± 0.2 × 10³ |
| Δr4 (nm4) | 6.7 ± 1.7 × 10⁷ | 1.8 ± 0.4 × 10⁸ | 1.4 ± 0.2 × 10⁸ |
| Δr6 (nm6) | 2.5 ± 0.8 × 10¹² | 9.4 ± 3.0 × 10¹² | 3.4 ± 0.7 × 10¹² |
| Δr4/(Δr2)2 | 6.6 ± 2.4 | 6.2 ± 2.3 | 6.2 ± 1.0 |
| Δr6/(Δr2)3 | 76 ± 40 | 62 ± 32 | 31 ± 8 |
The dimensions of the particles were measured from AFM images that were corrected for tip broadening effects;2,27 a representative picture of the cellulose nanoparticles is shown in Fig. 7. The moments were calculated from the AFM measurements according to the summation in eqn 8 and assuming cuboidal and ellipsoidal shapes; the values are reported in Table 2. There is a closer agreement between AFM and the experimental light scattering moments when the particles are modeled as cuboids.
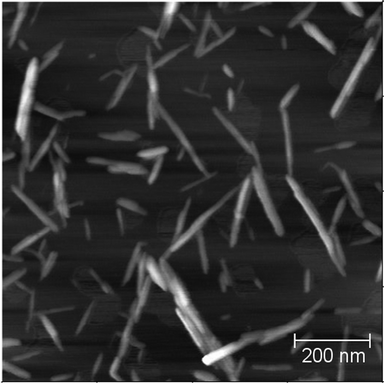 | ||
| Fig. 7 Atomic force microscopy image of CNC isolated from cotton. | ||
Native cellulosic materials are known to have crystalline regions with rectangular or squared cross sections whose size varies depending on the source.28,29 It has been reported that the acid hydrolysis that is employed to isolated the CNC from native cellulose preferentially consume the (2,0,0) crystalline planes that are perpendicular to the diagonals of the cross section, partially rounding the edges.30 In the case of cotton cellulose, an approximately squared cross section of 6 × 6.1 nm has been suggested for the individual crystallites after acid hydrolysis; it has also been suggested that the CNC in suspension might be formed by aggregates of three or more single crystals.31 It is consequently expected that the shape of the CNC must be better described by a cuboid with rounded edges rather than an ellipsoid. Our measurements are consistent with this observation.
Interparticle interactions
The second virial coefficient has been measured from the slope of the zero angle line according to eqn 1; yielding a result of −8.6 ± 0.1 × 10⁻⁶ mol ml g−2. A negative value for this parameter indicates a predominantly attractive interaction between the particles. This result seems surprising given that the CNC were isolated through sulfuric acid hydrolysis which introduces negatively charge sulfate groups on the surface, and gives stability to the dispersion. It must be noted however that the surface of the particles is mostly covered by hydroxyl groups which can hydrogen bond between each other. The cellulose–cellulose hydrogen bond interactions will add an attractive force component between the nanoparticles; nevertheless it may be insufficient to yield a negative second virial coefficient. A recent article suggested the existence of a gel like layer of sulfated oligosaccharides surrounding the nanocrystals in which protons and sulfate ions are trapped.32 This layer would partially screen the electrostatic repulsive interactions, providing an explanation to the negative second virial coefficient. Moreover we measured a zeta potential with a value of −12.3 providing evidence that the net negative charge surrounding the nanoparticles is small.Even though A2 is negative the suspensions are highly stable in water. Similar behaviors have been observed in other systems like small spherical gold nanoparticles for which negative values of A2 ranging from −8.22 × 10⁻⁴ to −5.0 × 10⁻⁵ mol ml g−2 have been measured using SAXS even when the nanoparticle dispersions are stable in the solvent.33 Moreover, the second virial coefficient obtained by light scattering is measured at constant pressure, as opposed to sedimentation equilibrium measurements where a constant chemical potential exist. Consequently some systems show negative A2 when measured with light scattering, but positive values when measured by sedimentation equilibrium and are thus stable in the medium of interest.34
CNC dimensions
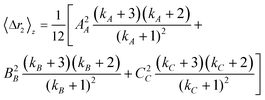
The moments Δr2, Δr4 and the molecular weight are employed to calculate the CNC dimensions from light scattering; as previously discussed, the sixth order moment is not used because the accessible q range is not large enough to get a reliable measurement. A shape must be assumed in order to determine the particle lengths using the expressions from Table 1; the cases of an ellipsoid and a cuboid are considered here. The sample is first assumed to be monodispersed and the systems of equations are solved directly to give the values shown in Table 3. There is an overestimation of the dimensions, especially when an ellipsoidal shape is assumed.The moments for a polydisperse sample measured by static light scattering are z-average values of all particles; thus if the polydispersity is not taken into account, the calculated dimensions will necessarily be larger than real. Since the sample studied here is polydisperse a more realistic measurement of the dimensions can be obtained if the size distribution is taken into account. To determine the average dimensions including the polydispersity over each dimension, the z-average moments are expressed by
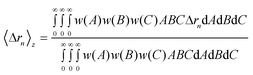 | (11) |
The multiplication w(A)w(B)w(C)dAdBdC indicates that the probability of a nanoparticle having dimensions A, B and C between A + dA, B + dB and C + dC simultaneously is being considered. It can be shown that when all the dimensions have a Schulz-Zimm distribution, the following relation applies
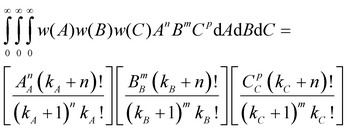 | (12) |
where kx = 1/(PDIx − 1) describes the polydispersity (PDIx = Xx/Xn) of variable x; n, m and p represent any exponent and AA, BB and CC indicate that the dimensions are weighted by themselves (e.g. if C is length, CC would indicate a length-averaged length). Eqn 12 is then used to solve eqn 11 for the z-average moments of polydispersed nanoparticles; for an ellipsoid the second and fourth moments are
 | (13) |
 | (13b) |
 | (14a) |
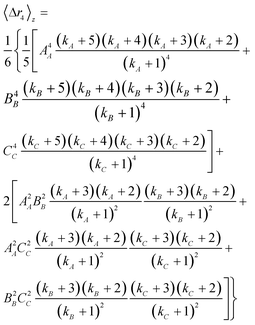
| (14b) |
The polydispersities of the dimensions were all approximated to be 1.2; this value is consistent with those reported by Elazzouzi-Hafraoui et al.,31 and also with our measurements from AFM. Note that to obtain the PDI from AFM, Xx was calculated from eqn 5 by replacing M for X and wν by X/ΣX; were X is the axis or semi-axis of interest. The dimensions calculated for a polydisperse population are also shown in Table 3. Accounting for polydispersity, both models are significantly more consistent with the AFM measurements, especially when the particles are modelled as cuboids. A small overestimation with respect to AFM is still detected, except for the smallest axis. This could be caused by a slight underestimation of the polydispersity. It is also possible that the population of particles measured with AFM is smaller than real. During image analysis, only the particles that could be individually measured were included to avoid errors caused by perspective and agglomeration during drying. It is possible that some agglomerates exist in solutions that were not taken into account with AFM but are accounted for in the light scattering results. Since the second virial coefficient resulted in a negative value it is expected that for the higher concentration samples some agglomerates may exist in suspension, thus affecting the extrapolation to infinite dilution. Alternatively, a hydrated or oligosaccharides layer like the one suggested by Beck et al.32 on the surface of the CNC could increase the effective dimensions of the nanoparticles. Either way, the light scattering measurements would provide a more realistic representation of the sample in suspension.
Experimental section
Materials
Whatman cellulose filter aid was employed as the cotton source to isolate CNC. Sulfuric acid was purchased with a concentration of 98% and then diluted to 64%.Isolation of cellulose nanocrystals
Isolation of the CNC was achieved through an acid hydrolysis of cotton at 45 °C for 50 min using 64 wt% sulfuric acid. At the end of the reaction time the suspension was diluted with cold deionized water to quench the reaction. Purification of the nanocrystals was done by precipitation, decantation, and dialysis of the slurry against deionized water. The suspensions were ultrasonicated to redisperse the CNC. More extensive procedures for CNC isolation can be found elsewhere.2,26,35Atomic force microscopy
The dimensions of the CNC were measured with a Digital Instruments/Veeco Bioscope atomic force microscopy (AFM) to compare the results with those obtained from light scattering. The nanocrystals were deposited on a freshly cleaved mica surface, with an approximate area of 1.5 cm2, by drying a droplet of 0.01 wt% CNC suspension.8 Pictures were taken in tapping mode using a NSC15 tip purchased from MikroMasch with a maximum nominal radius of 10 nm. The shape of the tip was deconvoluted from the AFM pictures in order to minimize nanoparticles broadening.27 A standard porous aluminium surface with sharp details was used to obtain the image of the tip employed for the correction. The three dimensions of a total of 122 particles were measured, only the particles that seemed isolated were included to minimize errors caused by agglomeration during drying.Static light scattering
The CNC suspension was filtered through a 0.450 μm pore size filter and then diluted to five different concentrations: 3.10 × 10⁻⁶, 6.15 × 10⁻⁶, 8.78 × 10⁻⁶, 2.06 × 10⁻⁵ and 4.46 × 10⁻⁵ g ml−1. The pH of the suspensions was measured to be 6.6 ± 0.1. The water employed was deionized and then filtered through a 0.020 μm pore size filter before use. All vials were previously cleaned with ethanol and water and allowed to dry covered before use. Static light scattering measurements were performed using a Wyatt Dawn Heleos II instrument in batch mode with vertically polarized light with a wavelength of 658 nm. The angle range studied spans from 32° to 147° (0.0070 < q < 0.0244 nm−1). The refractive index of water is 1.33147, and the refractive index increment is 0.103 ml g−1.36The Rayleigh ratio was measured at each angle and concentration from which R(θ,c)/Kc was calculated and plotted against sin2(θ/2). The curves at each concentration were fit to order three polynomials which were extrapolated to zero angle. Subsequently R(θ,c)/Kc was plotted against concentration for each angle; the resulting graphs were fit to straight lines and extrapolated to zero concentration. The molecular weight was obtained first from the double extrapolation to c = 0 and θ = 0. The second virial coefficient was then obtained by dividing the slope of the zero angle line by −2M2; while the form factor was obtained from dividing the zero concentration curve by M (according to eqn 1). The moments of the distances within a nanoparticle were obtained from the coefficients of the polynomial function that best fitted the form factor; eqn 6 was used to solve for the moments from the respective coefficients. The dimensions of the nanoparticles were then calculated by solving the equations in Table 1 and MW, for the monodispersed case, or eqn 12, 13 and MW for polydispersed particles.
Conclusions
Based on the polynomial expansion of the form factor, we developed expressions for the moments of the difference of distances within a nanoparticle that are valid for all nanoparticle shapes. Information regarding the aspect ratio can be obtained from the analysis of the moments without making any assumptions regarding the shape or size of the nanoparticle. A method to calculate the dimensions of triaxial nanoparticles in suspension was established and applied to a polydisperse population of cellulose nanocrystals. A very good agreement was found between the light scattering measurements and results from atomic force microscopy. It was observed that the CNC can be more accurately modelled if a cuboidal shape is assumed. The methodology described here can be easily applied to other systems of particles with complex shapes, especially polymer based nanoparticles and biological macromolecules; moreover it can be used with other scattering techniques such as small angle neutron and X-ray scattering.Acknowledgements
The authors thank the Center for Advanced Engineering Fibers and Films at Clemson University for support; and the Graduate School at Clemson University for PSA-NGGF fellowship.References
- B. Braun, J. R. Dorgan and J. P. Chandler, Biomacromolecules, 2008, 9, 1255–1263 CrossRef CAS.
- E. E. Ureña-Benavides, P. J. Brown and C. L. Kitchens, Langmuir, 2010, 26, 14263–14270 Search PubMed.
- X. Xie, Y. Mai and X. Zhou, Mater. Sci. Eng., R, 2005, 49, 89–112 CrossRef.
- B. R. Cuenya, Thin Solid Films, 2010, 518, 3127–3150 CrossRef CAS.
- D. K. Kim and J. Dobson, J. Mater. Chem., 2009, 19, 6294–6307 RSC.
- A. Kumari, S. K. Yadav and S. C. Yadav, Colloids Surf., B, 2010, 75, 1–18 CrossRef CAS.
- S. Liu and Z. Tang, J. Mater. Chem., 2010, 20, 24–35 RSC.
- I. Kvien, B. S. Tanem and K. Oksman, Biomacromolecules, 2005, 6, 3160–3165 CrossRef CAS.
- J. Guilbaud and A. Saiani, Chem. Soc. Rev., 2011, 40, 1200–1210 RSC.
- B. Hammouda, Polym. Rev., 2010, 50, 14–39 Search PubMed.
- F. Zhang and J. Ilavsky, Polym. Rev., 2010, 50, 59–90 Search PubMed.
- P. J. Wyatt, Anal. Chim. Acta, 1993, 272, 1–40 CrossRef CAS.
- G. Von White and C. L. Kitchens, J. Phys. Chem. C, 2010, 114, 16285–16291 Search PubMed.
- S. R. Kline, J. Appl. Crystallogr., 2006, 39, 895–900 CrossRef CAS.
- P. Debye, J. Phys. Chem., 1947, 51, 18–32 CAS.
- J. -F. Revol, H. Bradford, J. Giasson, R. H. Marchessault and D. G. Gray, Int. J. Biol. Macromol., 1992, 14, 170–172 CAS.
- P. Terech, L. Chazeau and J. Y. Cavaillé, Macromolecules, 1999, 32, 1872–1875 CrossRef CAS.
- B. H. Zimm, J. Chem. Phys., 1948, 16, 1093–1099 CrossRef CAS.
- B. H. Zimm, J. Chem. Phys., 1948, 16, 1099–1116 CrossRef CAS.
- G. C. Berry, in Soft Matter Characterization, ed. R. P. Borsali and P. Robert, Springer, New York, 2008, pp.41–92 Search PubMed.
- M. Goldstein, J. Chem. Phys., 1953, 21, 1255–1258 Search PubMed.
- R. G. Bartle, The American Mathematical Monthly, 1996, 103, 625–632 Search PubMed.
- P. Mittelbach and G. Porod, Acta Phys. Austriaca, 1961, 14, 185–211 Search PubMed.
- L. A. Feigin and D. I. Svergun, in Structure Analysis by Small-Angle X-Ray and Neutron Scattering, ed. G. W. Taylor, Plenum Press, New York, 1987, pp.90–94 Search PubMed.
- J. Welch and V. A. Bloomfield, Journal of Polymer Science: Polymer Physics Edition, 1973, 11, 1855–1857 Search PubMed.
- X. M. Dong, J. Revol and D. G. Gray, Cellulose, 1998, 5, 19–32 CrossRef CAS.
- J. S. Villarrubia, J. Res. Natl. Inst. Stand. Technol., 1997, 102, 425–454 Search PubMed.
- Y. Habibi, L. A. Lucia and O. J. Rojas, Chem. Rev., 2010, 110, 3479–3500 CrossRef CAS.
- M. A. S. Azizi Samir, F. Alloin and A. Dufresne, Biomacromolecules, 2005, 6, 612–626 CrossRef CAS.
- W. Helbert, Y. Nishiyama, T. Okano and J. Sugiyama, J. Struct. Biol., 1998, 124, 42–50 CrossRef.
- S. Elazzouzi-Hafraoui, Y. Nishiyama, J. Putaux, L. Heux, F. Dubreuil and C. Rochas, Biomacromolecules, 2008, 9, 57–65 CrossRef CAS.
- S. Beck, J. Bouchard and R. Berry, Biomacromolecules, 2011, 12, 167–172 Search PubMed.
- A. E. Saunders and B. A. Korgel, J. Phys. Chem. B, 2004, 108, 16732–16738 CrossRef CAS.
- M. Deszczynski, S. E. Harding and D. J. Winzor, Biophys. Chem., 2006, 120, 106–113 Search PubMed.
- S. Beck-Candanedo, M. Roman and D. G. Gray, Biomacromolecules, 2005, 6, 1048–1054 CrossRef CAS.
- M. M. De Souza Lima and R. Borsali, Langmuir, 2002, 18, 992–996 CrossRef.
Footnote |
| † Electronic supplementary information (ESI) available: Derivation of Debye’s expansion (eqn 6), eqn 9 through 10c, and the moments of the Schulz-Zimm distribution are provided; as well as exact expressions for the form factors of rectangular parallelepipeds (cuboids) and ellipsoids. See DOI: 10.1039/c1ra00391g |
| This journal is © The Royal Society of Chemistry 2012 |