Synthesis of surfactant-free self-assembled and size-controlled ZnS mesoporous nanospheres
Qian
Zhang
,
Wenyang
Chi
,
Weiwei
Zhang
,
Chunyan
Lv
and
Jixue
Li
*
State Key Laboratory of Inorganic Synthesis and Preparative Chemistry, College of Chemistry, Jilin University, Changchun 130012, P. R. China. E-mail: jx_li@jlu.edu.cn; Fax: +86-431-85168624; Tel: +86-431-85168578
First published on 1st November 2011
Abstract
High quality self-assembled ZnS mesoporous nanospheres have been successfully synthesized by a facile solvothermal method. The sample was synthesized using ethylene glycol aqueous solution without any surfactant assistance. Size and shape control of the ZnS mesoporous nanospheres is achieved by simple adjustments of the reactants' concentration. Investigation results show that ZnS spheres are made up of small ZnS nanocrystallites and show good photocatalytic activity in the degradation of MB under the irradiation of ultraviolet light because of their mesoporous structures.
Introduction
In the past decades, nanostructured materials have been established as the acknowledged frame of an important branch of learning. Nanostructured materials, that is, structures with at least one dimension between 1 and 100 nm, have attracted steadily growing interest due to their fascinating properties and their novel properties correlated with their microstructures.1 Inorganic semiconductor nanostructured materials are ideal systems for exploring a large number of novel phenomena on the nanoscale and investigating the size and dimensionality dependence of their properties for potential applications. The use of such nanostructures with tailored geometries as building blocks is also expected to play crucial roles in future nanodevices. Much attention has been paid to exploring the usage of inorganic semiconductor nanostructures as field-emitters due to their low work functions, high aspect ratios and mechanical stabilities, and high electrical and thermal conductivities.2 As an important II–VI group semiconductor material, ZnS has been intensively studied because of its novel fundamental properties and diverse applications. ZnS has two kinds of structures, namely, cubic zinc blende structure and hexagonal wurtzite structure, both of which have wide band gaps of 3.72 eV and 3.77 eV, respectively.2 ZnS has great potential application in the fields of optoelectronics, catalysis3–6 and biological sciences.7 Recently, the nanoscale morphologies of ZnS have been demonstrated to be one of the richest among all inorganic semiconductors. Up to now, ZnS nanomaterials with various shapes, such as sphere, sheet, rod, wire, belt, tube, heptapods and tetrapods, multiangular branched shape, T-shape7–18 and so on, have been prepared by means of different synthesis routes. In these syntheses, organic surfactants (PVP, CTABet al.) or assisted small molecules (ammonia) 19 are always used as templates or structure directing agents, which control the growth of structure and the morphologies of the products. However, in most cases, the pure product was obtained only after the complete removal of the surfactants, which makes the experiments become more complicated. Furthermore, most of the organic surfactants and assisted small molecules are high in cost. But reports on the preparation of nanomaterials in the absence of any surfactant or small molecule remain uncommon.Herein, we report the fabrication of ZnS mesoporous nanospheres via a simple solvothermal method for the first time. The sample was synthesized using ethylene glycol aqueous solution without any additives or surfactants by a low cost, self-assembly synthesis route. Hu et al. reported the preparation of similar ZnS nanoporous nanoparticles (NPNPs) by a facile solution-phase thermal decomposition route in the presence of poly(N-vinyl-2-pyrrolidone) (PVP).20 Lang et al. also synthesized ZnS nanospheres using the same method and he found that the sample was a high activity heterogeneous catalyst for synthesis of 5-substituted 1H-tetrazoles from nitriles and sodium azide.21 Bhaumik et al. reported the synthesis of self-assembled mesoporous TiO2 nanoparticles using organic surfactants (salicylate, F127, SDS) as a template. The mesoporous TiO2 nanoparticles show good properties for photocatalytic and optoelectronic applications.22,23 In our synthesis, the size of the ZnS spheres could be accurately controlled from 50 nm to 2 μm by simply changing the concentration of reactants. We also discussed the effect of the other reaction conditions (reaction temperature and sulfur source) on the final morphology and structure of ZnS. Then we proposed a possible two-stage growth mechanism for the formation of products. Moreover, the photodegradation of methylene blue (MB) was employed to evaluate the photocatalytic activities of ZnS spheres of two different sizes of under ultraviolet light irradiation. It was worth noting that the ZnS mesoporous nanospheres exhibit excellent ultraviolet-light-driven photocatalytic performance.
Experimental section
The chemicals, zinc nitrate (Zn(NO3)2·6H2O), elemental sulfur(S) and ethylene glycol (EG), were of analytical grade and were used as received without further purification. In the typical synthesis, 0.5 mmol of Zn(NO3)2·6H2O was dissolved in 20 ml EG and a colorless solution of a certain concentration was formed under constant stirring. Then 0.5 mmol of elemental sulfur was added to the above solution. The mixture was stirred strongly for a moment in order to make the elemental sulfur well-dispersed. Successively, the mixture of reactants was transferred into a 40 ml Teflon-lined stainless steel autoclave. Then, the autoclave was sealed and maintained at 150 °C for 24 h. After reaction, the autoclave was air-cooled to room temperature. The solution became milky white and produced white precipitates. These samples were collected by centrifugation and then washed with distilled water and ethanol several times to remove impurities, before drying at 60 °C for 10 h.Characterizations
Structures of the synthesized products were examined by powder X-ray diffraction (XRD) on a Rigaku D/Max 2550 X-ray diffractometer with Cu Kα radiation (k = 0.15418 nm) at 50 kV and 200 mA. Scanning electron microscopy (SEM) observation was carried out on a JEOL JSM-6700 with an energy dispersive spectrometer (EDS). Transmission electron microscopy (TEM) was conducted on a JEOL JEM-3010 electron microscope (operated at 300 kV). Nitrogen adsorption–desorption isotherms were collected using an ASAP 2010 M nitrogen adsorption apparatus at 77 K. The surface areas were calculated by the Brunauer–Emmett–Teller (BET) method, and the pore size distribution plots were obtained by the Barrett–Joyner–Halenda (BJH) theory. UV-visible diffuse reflectance spectra were recorded on a Shimadzu UV-3600 spectrophotometer with an integrating sphere attachment, BaSO4 was used as a background standard. UV-Vis spectra were recorded using a Shimadzu UV-2450 spectrometer.Results and discussion
Structure and morphology
The powder X-ray diffraction (p-XRD) pattern of a representative powder product precipitated is shown in Fig. 1. All diffraction patterns are in good agreement with hexagonal ZnS (space group: P63mc (186)) with lattice constants a = 3.777 Å and b = 6.188 Å (JCPDS No. 80-0007). From the line broadening of the XRD peaks, crystalline sizes of the products were calculated by the Scherrer equation (D = Kλ/β cos θ). We calculated that the average crystalline size of ZnS is about 4 nm.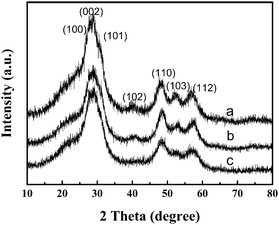 | ||
| Fig. 1 X-Ray diffraction (XRD) patterns of ZnS obtained using different concentrations of reactants at 150 °C for 24 h: (a) 12.5 mM, (b) 25 mM and (c) 50 mM. | ||
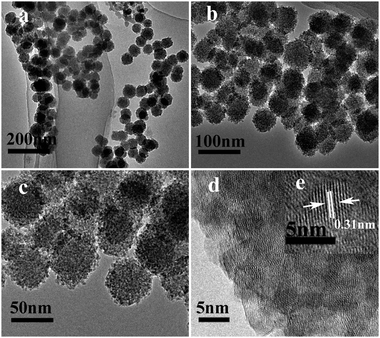
Fig. 2 shows the TEM images of a powder product of ZnS (S1). It is clear that the sample is composed of a large number of monodisperse nanospheres of uniform size. The low-magnification TEM (Fig. 2c) image shows that the nanospheres with an average size of about 50 nm have a rough surface and are made up of small particles. It is worth noting that there are many spots with a clear contrast difference in each individual small particle. The spots show the interspace which should be generated by the aggregation of the small particles. This further observation from high-magnification TEM (Fig. 2d) confirms that the small particles (ZnS nanocrystallites) with a size of about 4 nm are assembled in a mesoporous structural configuration, which corresponds with the line broadening of the XRD peaks. More importantly, these mesoporous nanospheres are sufficiently stable, and they cannot be destroyed even after ultrasonic treatment of high-power (100 W) for 30 min. The HRTEM image in Fig. 2d shows the detailed arrangement of the nanoparticles. The lattice fringes are observed to have a spacing of 0.31 nm corresponding to the interplanar spacing of the (002) plane of ZnS.
BET gas sorptometry measurements were conducted to further examine the porous nature of the ZnS nanospheres. N2 adsorption–desorption isotherms (Fig. 3) and the corresponding BJH pore size distribution plot of the as-obtained mesoporous nanospheres were obtained to determine the surface area of the composites, which can further be applied to explore the possibility of interconnected pores in the hierarchical mesoporous nanospheres. N2 adsorption–desorption isotherms of the ZnS structures exhibit a hysteresis loop of type IV in the relative pressure range of 0.8–1.0, indicating the presence of the inhomogeneous mesopores formed due to the self-assembly of small nanocrystallites.24 The corresponding pore size distribution curve calculated from the desorption branch by the BJH method reveals a peak at about 4 nm. These pores presumably arise from the spaces among the small nanocrystallites of ZnS nanospheres. The large pores of around 45 nm are attributed to the interparticle spaces. The sharp distribution of the mesopores around 45 nm suggests that the nanospheres have high monodispersity. The measured Brunauer–Emmett–Teller (BET) areas for nanospheres of ZnS are about 141.5 m2 g−1. The corresponding BJH adsorption cumulative pore volumes are 0.391 cm3 g−1. The extremely high BET surface area and large total pore volume strongly support the fact that the nanoparticles have a mesoporous structure.
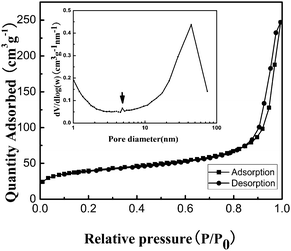 | ||
| Fig. 3 Nitrogen adsorption/desorption isotherm and Barrett–Joyner–Halenda (BJH) pore size distribution plot (inset) of ZnS mesoporous nanospheres. | ||
UV-Vis absorption
UV-visible spectroscopy is one of the important tools for characterizing the optical properties of the semiconductor nanomaterials. The optical absorption of the ZnS mesoporous nanospheres was conducted with a UV-Vis absorption spectrometer. As shown in Fig. 4a, there is an ultraviolet light absorption band at 320–350 nm. For a crystalline semiconductor, the optical absorption near the band edge follows the equation ahυ = A(hυ − Eg)n/2, where a, υ, Eg and A are the absorption coefficient, the light frequency, the band gap and a constant, respectively. Among them, n is decided by the characteristics of the transition in a semiconductor.25 The band gap (Eg) of the ZnS mesoporous nanospheres is calculated to be about 3.55 eV from the onset of the absorption edge (Fig. 4b).22,23 This indicates that the ZnS mesoporous nanospheres have a suitable band gap for photocatalytic decomposition of organic contaminants under ultraviolet irradiation.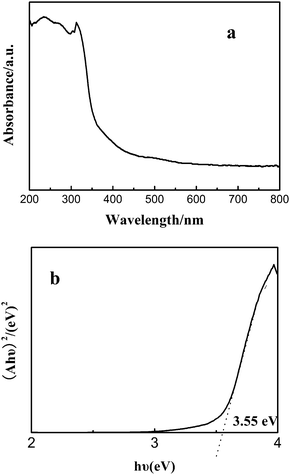 | ||
| Fig. 4 (a) UV-Vis diffuse reflectance spectrum of the ZnS mesoporous nanospheres, (b) the band gap of the ZnS mesoporous nanospheres. | ||
Reaction temperature
To investigate the effect of the reaction temperature on the formation of ZnS mesoporous nanospheres structures, a series of comparative experiments were carried out through similar processes. It was found that the reaction temperature has significant influence on the morphology and structure of the as-synthesized ZnS products. When the reaction temperature was dropped down to 120 °C, not only the yield of the products was low, but also much of the elemental sulfur did not undergo reaction. When the reaction temperature increased to 180 °C, the morphology of the product (S2) was also spheres, but there were some irregular morphology particles (Fig. 5). The average diameter of big spheres is about 3 μm. From the pattern of XRD and images of TEM, we can observe that the spheres are also made of nanocrystallites, but the size of the nanocrystallites is about 7 nm and they are bigger than the ones obtained at 150 °C.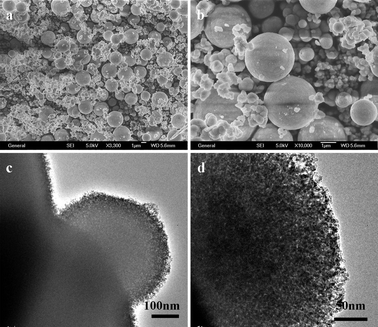 | ||
| Fig. 5 SEM and TEM images of ZnS obtained at 180 °C for 24 h: (a and b) SEM images, (c and d) TEM images. | ||
Concentration of reactants
Size controllability of nanospheres is important and may govern the fate of their applications. In our synthesis, the size of the ZnS nanospheres could be easily controlled from 50 nm to 2 μm by simply changing the concentration of reactants while all other parameters were held constant. The SEM and TEM images of the products obtained from the solutions with concentrations of Zn(NO3)2·6H2O and elemental sulfur of 12.5 mM (S3), 25 mM (S1) and 50 mM (S4) by solvothermal heat treatment at 150 °C for 24 h are shown in Fig. 6. It is clearly seen that the size of spheres changed greatly with the different concentration of Zn(NO3)2·6H2O. Fig. 6a and b display the SEM and TEM images of the product obtained at a 12.5 mM concentration of Zn(NO3)2·6H2O. They show us that the products are nanospheres of uniform size (about 170 nm) and shape. On further increasing the Zn2+ concentration to 25 mM, the average size of nanospheres decreases to about 50 nm (Fig. 6c and d), which is described in detail in the preceding part of the text (Structure and morphology). When the concentration of Zn2+ increased to 50 mM, as seen from Fig. 6e and f, the samples were still spherelike, but the spheres had bad monodispersity and some of them aggregated. The diameter of spheres is uniform (from 300 nm to 2 μm).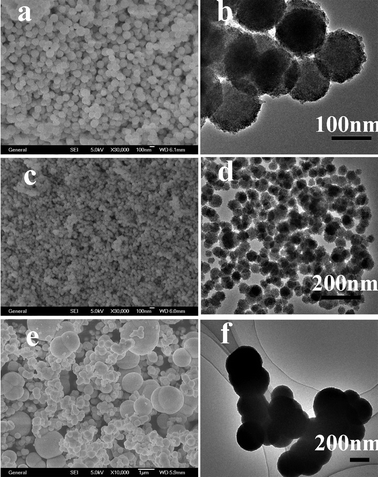 | ||
| Fig. 6 SEM and TEM images of ZnS obtained using different concentrations of reactants at 150 °C for 24 h: (a) SEM of 12.5 mM, (b) TEM of 12.5 mM, (c) SEM of 25 mM, (d) TEM of 25 mM, (e) SEM of 50 mM, (f) TEM of 50 mM. | ||
From the above results, it can be deduced that zinc ion concentrations of reactants influence the ZnS morphologies (the size of spheres) critically.
Effects of sulfur source
Experiments to study the influence of different sulfur sources (thiourea (TU) and thioacetamide (TAA)) on the morphologies of ZnS products under the same reaction conditions were carried out. When TU was adopted, a large amount of irregular congeries (S5) of ZnS nanocrystallites which had the same size as the sample (S1, sulfur powder as the sulfur source) were synthesized (Fig. 7a and 8a). However, we obtained a large amount of ZnS nanocrystallites (S6) (Fig. 7b and 8b), when TAA was used as the sulfur source. The diffraction patterns (Fig. 7b) are in good agreement with the cubic zinc blende structure of ZnS (space group: F-43m (216)) with lattice constants a = 5.406 Å and b = 5.406 Å (JCPDS No. 05-0566). From the image of XRD, we could find that the peaks were sharp and the half width of the peaks became larger which indicated that the nanocrystallites were bigger than the nanocrystallites of the mesoporous nanospheres. We measured the size of the nanocrystallites in the image of TEM, and the average size was about 13 nm. So, different sulfur sources play an important role in determining the morphology and structure of ZnS products.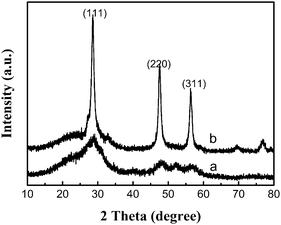 | ||
| Fig. 7 X-Ray diffraction (XRD) patterns of ZnS prepared using different sulfur sources at 150 °C for 24 h: (a) TU, (b) TAA. | ||
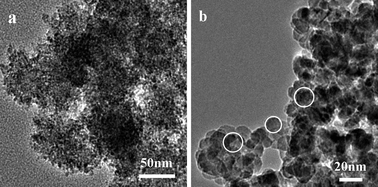 | ||
| Fig. 8 TEM images of ZnS prepared using different sulfur sources at 150 °C for 24 h: (a) thiourea, (b) TAA. | ||
Formation mechanisms
Based on the above experimental results and analysis of characterizations, the possible formation mechanism is a two-stage growth mechanism.26First, an initial process of nucleation of clusters (primary particles) is described by standard burst-nucleation theory.26 Initially, solutes are formed to yield a supersaturated solution, leading to ZnS nucleation. In this synthesis the solvent EG plays an important role without any doubt because there are no products obtained when we conduct a similar experiment in aqueous solutions. The formation of ZnS nuclei can be described by the following three steps based on the reduction mechanism of polyols:27,28
| HOCH2CH2OH → CH3CHO + H2O | (1) |
| S + 2CH3CHO → CH3CO–OCCH3 + S2− + 2H+ | (2) |
| Zn2+ + S2− → ZnS(s) | (3) |
Acetaldehyde is produced by the dehydration of EG at elevated temperatures, where the acetaldehyde can donate a hydrogen atom and act as a reducing agent to convert sulfur powder to S2−, as shown in reactions (1) and (2). Then S2− reacts with Zn2+ released from zinc nitrate hexahydrate to form ZnS nuclei, as shown in reaction (3).
Second, the formed nuclei can further grow by a diffusive mechanism. If the nucleation rate of nanocrystallites decreases in time with the proper profile, as occurs naturally in the nucleation process, then the initial peak of secondary aggregates grows to larger sizes, while few additional secondary aggregates are formed.29
The resulting primary particles (ZnS nanocrystallites) in turn aggregate to form secondary particles (ZnS nanospheres). This latter process is sometimes facilitated by changes in the chemical conditions of the system: the ionic strength increase, or the pH change, causing the surface potential to approach the isoelectric point. Furthermore, the small primary nanoparticles have a high surface free energy. And to reduce the surface free energy, the primary particles are willing to aggregate into larger clusters. Formation of the final (secondary) particles, which can be of narrow size distribution, is also a diffusion-controlled process, proceeding by the addition–polymerization type process of irreversible capture of single primary particles by the growing aggregates.
In the above mechanism, the acceleration of the dehydration of EG and diffusion speed with increase in the temperature (from 150 °C to 180 °C) can produce the primary particles (ZnS nanocrystallites) of bigger size, which then aggregate into larger sphere-like assemblies (S2). Furthermore the size tunability may be the result of more ZnS nuclei caused by lower concentration of reactants in the reaction mixture, which promotes the formation of secondary particles (ZnS nanospheres) of bigger size. So we obtained the nanospheres of 170 nm (S3) by lower concentration (12.5 mM) of reactants and the nanospheres of 50 nm (S1) by lower concentration of reactants (25 mM). But the concentration of reactants was so high that the conglomeration of a great quantity of particles occurred (S3) when the concentration of Zn2+ increased to 50 mM.
EG which has a proper viscosity, good performance when dissolved, high boiling point (ca. 198 °C), as well as lower saturated steam pressure, is regarded as a superior solvent for a solvothermal method. Li et al. have reported a solvothermal technique with the solvent EG for the synthesis of highly monodisperse cadmium sulfide colloidal spheres.30 Polyhydric alcohols (such as EG) can also act as a stabilizer, which can limit the growth of particles and prevent the conglomeration of a great quantity of particles.
Photocatalytic activities
To demonstrate the potential application of as-synthesized hierarchical nanoporous nanospheres in the degradation of organic contaminants, we have investigated their photocatalytic activities by choosing the photocatalytic degradation of methylene blue (MB) as a model reaction. Fig. 9a shows the optical absorption spectra of MB aqueous solution (initial concentration: 1.0 × 10⁻⁵ M, −300 ml) with 15 mg of the as-prepared ZnS powders (S1) after exposure to ultraviolet light (UV) for different durations. The intensity of the absorption peak at 663 nm of MB decreased gradually with prolonged irradiation time, indicating the photocatalytic degradation of MB. After 21 min, the peak completely disappeared, which indicated the complete photodegradation of MB. This shows clearly that the ZnS mesoporous nanospheres have good photocatalytic activity in the degradation of MB under the irradiation of a high pressure mercury lamp (125 W). Further experiments were carried out to compare the catalytic activity of the as-prepared ZnS architectures, S4 (Fig. 9b). When the test time reached 21 min, about 72% of MB was degraded. It is generally accepted that the catalytic process is mainly related to the adsorption and desorption of molecules on the surface of the catalyst. The high specific surface area can provide more reactive adsorption/desorption sites for photocatalytic reactions.31 So the photocatalytic superiority of the ZnS architectures may be dependent on their structural features. The sample S1 can provide a greater surface area than S4, which is obviously beneficial for the enhancement of photocatalytic activity. Furthermore, good dispersibility and the uniformity of morphology and structure also can provide a large active surface area.20,32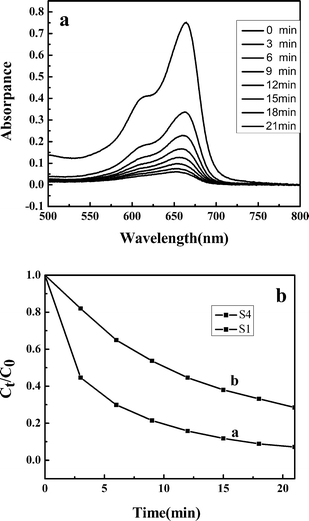 | ||
| Fig. 9 (a) Absorption spectra of MB aqueous solutions in the presence of ZnS mesoporous nanospheres (S1), (b) degradation rate of MB at different intervals in the presence of photocatalysts: (a) S1, (b) S4. | ||
Conclusions
In summary, a simple solvothermal method has been developed to synthesize monodisperse ZnS mesoporous nanospheres which are composed of small primary nanocrystallites. The synthesis uses ethylene glycol aqueous solution without any additives or surfactants and a low cost, self-assembly synthesis route, which is a very important feature and is difficult to achieve through other synthetic methodologies. From the applications point of view, this method is favorable, in contrast to most precipitation protocols, because it generates dispersed ZnS spheres in concentrated systems in the absence of a dispersing agent. As a result, the particles are free of the organic residues that adversely affect their performance in most electronic applications. Moreover, the nanosphere size can be tuned through varying the concentration of reactants. The ZnS architectures have good photocatalytic activity in the degradation of MB under the irradiation of ultraviolet light because of their mesoporous structures, high surface area, and the uniformity of morphology and structure.Acknowledgements
This work was supported by the National Natural Science Foundation of China under Grant No. 10674054 and the Major State Basic Research Development Program of China under Grant No. 2009CB939701.Notes and references
- X. S. Fang and L. D. Zhang, J. Mater. Sci. Technol., 2006, 22, 721–736 CAS.
- X. S. Fang, Y. Bando, U. K. Gautam, C. H. Ye and D. Golberg, J. Mater. Chem., 2008, 18, 509–522 RSC.
- O. Hamanoi and A. Kudo, Chem. Lett., 2002, 838–839 CrossRef CAS.
- A. Kudo and M. Sekizawa, Chem. Commun., 2000, 1371–1372 RSC.
- T. Arai, S. I. Senda, Y. Sato, H. Takahashi, K. Shinoda, B. Jeyadevan and K. Tohji, Chem. Mater., 2008, 20, 1997–2000 CrossRef CAS.
- M. Muruganandham and Y. Kusumoto, J. Phys. Chem. C, 2009, 113, 16144–16150 CAS.
- G. P. Li, J. F. Zhai, D. Li, X. N. Fang, H. Jiang, Q. Z. Donga and E. K. Wang, J. Mater. Chem., 2010, 20, 9215–9219 RSC.
- X. Fang, C. Ye, X. Peng, Y. Wang, Y. Wu and L. Zhang, J. Cryst. Growth, 2004, 263, 263–268 CrossRef CAS.
- A. Panda, G. Glaspell and M. El-Shall, J. Am. Chem. Soc., 2006, 128, 2790–2791 CrossRef CAS.
- X. Meng, J. Liu, Y. Jiang, W. Chen, C. Lee, I. Bello and S. Lee, Chem. Phys. Lett., 2003, 382, 434–438 CrossRef CAS.
- S. Kar, S. Biswas and S. Chaudhuri, Nanotechnology, 2005, 16, 737–740 CrossRef CAS.
- Y. Ding, X. D. Wang and Z. L. Wang, Chem. Phys. Lett., 2004, 398, 32–36 CrossRef CAS.
- X. S. Fang, Y. Bando, G. Z. Shen, C. H. Ye, U. K. Gautam, P. M. F. J. Costa, C. Y. Zhi, C. C. Tang and D. Golberg, Adv. Mater., 2007, 19, 2593–2596 CrossRef CAS.
- X. S. Fang, Y. Bando, M. Liao, U. K. Gautam, C. Zhi, B. Dierre, B. Liu, T. Zhai, T. Sekiguchi, Y. Koide and D. Golberg, Adv. Mater., 2009, 21, 2034–2039 CrossRef CAS.
- Y. Zhu, Y. Bando and Y. Uemura, Chem. Commun., 2003, 836–837 RSC.
- G. Chen, Y. Bando, J. Hu and D. Golberg, Appl. Phys. Lett., 2007, 90, 123101 CrossRef.
- X. Fang, U. Gautam, Y. Bando, B. Dierre, T. Sekiguchi and D. Golberg, J. Phys. Chem. C, 2008, 112, 4735–4742 CAS.
- B. D. Liu, Y. Bando, Z. E. Wang, C. Y. Li, M. Gao, M. Mitome, X. Jiang and D. Golberg, Cryst. Growth Des., 2010, 10, 4143–4147 CAS.
- B. Peng, Z. T. Deng, F. Q. Tang, D. Chen, X. L. Ren and J. Ren, Cryst. Growth Des., 2009, 9, 4745–4751 CAS.
- J. S. Hu, L. L. L. Ren, Y. G. Guo, H. P. Liang, A. M. Cao, L. J. Wan and C. L. Bai, Angew. Chem., Int. Ed., 2005, 44, 1269–1273 CrossRef CAS.
- L. M. Lang, B. J. Li, W. Liu, L. Jiang, Z. Xu and G. Yin, Chem. Commun., 2010, 46, 448–450 RSC.
- A. K. Patra, S. K. Das and A. Bhaumik, J. Mater. Chem., 2011, 21, 3925–3930 RSC.
- S. K. Das, M. K. Bhunia and A. Bhaumik, Dalton Trans., 2010, 39, 4382–4390 RSC.
- J. C. Groen, L. A. A. Peffer, J. A. Moulijn and J. Pérez-Ramírez, Microporous Mesoporous Mater., 2003, 60, 1–17 CrossRef CAS.
- G. H. Tian, Y. J. Chen, W. Zhou, K. Pan, Y. Z. Dong, C. G. Tian and H. G. Fu, J. Mater. Chem., 2011, 21, 887–892 RSC.
- J. Park, V. Privman and E. Matijević, J. Phys. Chem. B, 2001, 105, 11630–11635 CrossRef CAS.
- F. Li, W. T. Bi, T. Kong and Q. Qin, Cryst. Res. Technol., 2009, 44, 729–735 CrossRef CAS.
- Z. W. Quan, C. X. Li, X. M. Zhang, J. Yang, P. P. Yang, C. M. Zhang and J. Lin, Cryst. Growth Des., 2008, 8, 2384–2392 CAS.
- D. T. Robb, I. Halaciuga, V. Privman and D. V. Goia, J. Chem. Phys., 2008, 129, 184705 CrossRef.
- X. H. Li, J. X. Li, G. D. Li, D. P. Liu and J. S. Chen, Chem.–Eur. J., 2007, 13, 8754–8761 CrossRef CAS.
- L. H. Zhang, H. Q. Yang, J. Yu, F. H. Shao, L. Li, F. H. Zhang and H. Zhao, J. Phys. Chem. C, 2009, 113, 5434–5443 CAS.
- C. H. Ye, Y. Bando, G. Z. Shen and D. Golberg, J. Phys. Chem. B, 2006, 110, 15146–15151 CrossRef CAS.
| This journal is © The Royal Society of Chemistry and the Centre National de la Recherche Scientifique 2012 |

