Structural analysis of intrinsically disordered proteins by small-angle X-ray scattering†
Pau
Bernadó
*a and
Dmitri I.
Svergun
*b
aInstitute for Research in Biomedicine, Parc Científic de Barcelona, Baldiri Reixac, 10, 08028 Barcelona, Spain
bEuropean Molecular Biology Laboratory, Hamburg Outstation, Notkestrasse 85, 22603 Hamburg, Germany. E-mail: pau.bernado@irbbarcelona.org; svergun@embl-hamburg.de
First published on 22nd September 2011
Abstract
Small-angle scattering of X-rays (SAXS) is an established method to study the overall structure and structural transitions of biological macromolecules in solution. For folded proteins, the technique provides three-dimensional low resolution structures ab initio or it can be used to drive rigid-body modeling. SAXS is also a powerful tool for the quantitative analysis of flexible systems, including intrinsically disordered proteins (IDPs), and is highly complementary to the high resolution methods of X-ray crystallography and NMR. Here we present the basic principles of SAXS and review the main approaches to the characterization of IDPs and flexible multidomain proteins using SAXS. Together with the standard approaches based on the analysis of overall parameters, a recently developed Ensemble Optimization Method (EOM) is now available. The latter method allows for the co-existence of multiple protein conformations in solution compatible with the scattering data. Analysis of the selected ensembles provides quantitative information about flexibility and also offers insights into structural features. Examples of the use of SAXS and combined approaches with NMR, X-ray crystallography, and computational methods to characterize completely or partially disordered proteins are presented.
 Pau Bernadó | Pau Bernadó is a research assistant at the Institute for Research in Biomedicine in Barcelona. At the end of 2011 he will become a group leader at the Centre de Biochimie Structurale in Montpellier. He received his PhD in Chemistry from the University of Barcelona in 2003. His research is focused on methodological developments to study the structure and dynamics of biomolecules and macromolecular complexes, with special interest in highly flexible proteins. To achieve these goals, he is combining Nuclear Magnetic Resonance, small-angle X-ray scattering and computational methods. He has co-authored 51 peer-reviewed publications and several book chapters. |
 Dmitri I. Svergun | Dmitri Svergun, a graduate of Moscow University, Russia, is a group leader at the European Molecular Biology Laboratory, Hamburg Outstation. His research activities include small-angle X-ray scattering, applications of synchrotron radiation and neutron scattering in structural research of biological macromolecules and nanostructured materials, and development of mathematical methods for the interpretation of elastic scattering data. He was awarded the 2010 International Rusnanoprize for method development in nanodiagnostics. He is the author/co-author of over 270 peer-reviewed publications and 2 monographs (h-index 38), and a consultant of the Commission on Small-Angle Scattering of the International Union of Crystallography. |
Introduction
Small-angle scattering (SAS) of X-rays (SAXS) and neutrons (SANS) are powerful methods for the structural characterization of biomolecular systems, both ordered and disordered, at a resolution level of a few nm.1 These techniques provide information about the overall conformation and structural changes of biological macromolecules in solution. Major advances in instrumentation and computational methods in the last decade have led to a tremendous increase in the applications of SAS in structural biology2–4 For studies on folded biological macromolecules, the method yields the overall shapes ab initio and provides the means to characterize the quaternary structure of complexes by rigid-body modeling when the high resolution models of the individual subunits or domains are available.3,5,6 High-throughput SAXS studies are now possible thanks to modern synchrotrons with data collection times within seconds, robotic sample changers and automated data collection and analysis pipelines.7,8In contrast to most other structural methods, one of the major advantages of SAS lies in its applicability not only to monodisperse solutions of well-folded and relatively rigid macromolecules and complexes but also to mixtures of diverse types of macromolecules. This versatility makes the technique applicable to the analysis of oligomeric mixtures,9self-assembly processes,10 and protein or RNA folding.11–13 The technique is also effectively employed to study systems with conformational polydispersity, i.e. completely or partially disordered macromolecules, including multi-domain proteins with flexible linkers and intrinsically disordered proteins (IDPs). In the past, characterization of flexibility by means of SAS was done qualitatively, generally being restricted to the determination of a few simple geometric parameters. Recent developments have allowed quantitative description of the conformational ensembles for flexible macromolecules in solution.14,15 These new approaches will be briefly outlined below. Here we will mainly consider SAXS, which is the most popular technique; however, in principle these new approaches are also applicable for SANS studies. The latter method can be useful in some specific cases, in particular for multi-component complexes, when one can make use of contrast variation by isotopic hydrogen–deuterium exchange (e.g. specific perdeuteration).16 For IDPs, SAXS is the method most often used because it is faster, requires less material and usually provides more precise experimental data.
Basics of SAXS
First, we shall briefly present the main aspects of SAXS applied to solutions of biological macromolecules and the basic equations required to understand the principles of this technique. More detailed information can be found in textbooks and recent reviews.1,5,6,17The basic scheme of a SAXS experiment is illustrated in Fig. 1. A solution of macromolecules placed in a capillary or cuvette is illuminated by a collimated monochromatic X-ray beam and the intensity of the scattered beam is measured as a function of the scattering angle (2θ). In solution, scattering is usually isotropic due to the random orientation of particles, but SAXS patterns are generally recorded by two-dimensional detectors, which provide better statistical accuracy of the signal after radial averaging. A similar measurement is performed on the same container filled by solvent, and the latter scattering is then subtracted from that of the macromolecular solution. The difference pattern arises from the dissolved particles and provides information about their structure. Note that structural studies require solute concentrations of a few mg ml−1 (i.e. below 1%), in which the interactions between the macromolecules are usually negligible. Only this diluted regime is considered below (measurements on concentrated solutions, which may also provide information about interparticle interactions are outside the scope of this review).
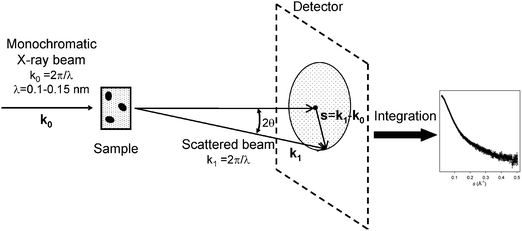 | ||
| Fig. 1 Basic scheme of a SAXS experiment. | ||
The scattering of X-rays by a macromolecular solution is proportional to the number of biomolecules in the illuminated volume (i.e. to the solute concentration) and to the difference in the electron density of the solute and solvent (often also called the contrast). As biomolecules are composed of light atoms, the contrast and thus the useful signal in aqueous solutions is usually rather small. The most precise biological SAXS experiments are therefore conducted on synchrotron sources, which provide high brilliance X-rays. All major synchrotrons, like ESRF (Grenoble), DESY (Hamburg), Diamond (Oxford), SSRL (Stanford), or Spring-8 (Himeji), have SAXS beamlines that are optimized for biological solution scattering experiments. In principle, satisfactory results can also be obtained on dedicated SAXS cameras using laboratory X-ray sources (for example those produced by Rigaku, Bruker and other firms), which yield a much lower flux but still a low background. The typical exposure times range from seconds or minutes on synchrotrons to hours on laboratory sources but the amount of sample required is approximately the same in both cases. Typically, a few tens of microlitres of solution per measurement and a total of 1–2 mg of purified protein per construct are needed, including a compulsory concentration series measurement to extrapolate to infinite dilution. Regarding synchrotrons, the intense X-ray beams often damage samples. For the meaningful analysis of the overall shape but also flexibility of macromolecules, solutions containing single molecular species without aggregates are needed. Typically, monodispersity over 90% is required, which must be verified by other methods such as gel filtration chromatography, dynamic light scattering (DLS), or analytical ultracentrifugation (AUC) before measuring in a synchrotron.
Aqueous solutions of macromolecules yield an isotropic scattering intensity that depends on the modulus of the momentum transfer s (s = 4πsin(θ)/λ, where 2θ is the angle between the incident and scattered beam and λ is the X-ray wavelength):
 | (1) |
| A(s) = ℑ[ρ(r)] = ∫Δρ(r)exp(isr)dr, | (2) |
Several relevant structural parameters can be obtained directly from these curves, thus providing information about the size, oligomeric state and overall shape of the molecule. For monodisperse dilute solutions of folded purified proteins, nucleic acids or macromolecular complexes, the background corrected intensity after subtraction of the solvent scattering is proportional to the scattering of a single particle, averaged over all orientations. Novel methods of SAXS data analysis allow the structural determination of these systems at low resolution (1–2 nm).5,6
Flexible macromolecules belong to another more complicated case of polydisperse systems, in which the solution contains various types of particles. In general, polydispersity makes particle structure analysis difficult or impossible, because, contrary to monodisperse systems, the intensity measured is not related to the scattering of a single particle. In general, given K distinct particle types (components) in a mixture, the SAXS intensity is a linear combination of their individual contributions
 | (3) |
Both IDPs and modular multi-domain proteins with flexible linkers can be represented as mixtures of different conformations of the same molecule, and their scattering is therefore described by eqn (3). However, these mixtures contain a very large number of configurations (k ≫ 1) and thus plain decomposition, as in the case of oligomeric mixtures, is not feasible. Below we describe the methods specifically developed for the studies of highly flexible systems.
Scattering properties of IDPs
SAXS profiles and Kratky plots
IDPs can sample an astronomical number of conformations and therefore represent an extreme case of the scenario displayed by eqn (3). The scattering profile of an IDP is the average of all those arising from the conformations that the protein adopts in solution (Fig. 2A). This property induces very special trends to SAXS data for IDPs. Fig. 2B displays the synthetic SAXS curves for ten selected 100-residue-long polyalanine conformations from a large pool of 10![[thin space (1/6-em)]](https://www.rsc.org/images/entities/char_2009.gif) 000. The individual conformations display several features along the complete momentum transfer range simulated. The initial part of the simulated curves, containing the lowest resolution structural information, presents distinct slopes, indicating a large variety of possible sizes and shapes that an unstructured chain can adopt. The SAXS profile, obtained after averaging curves for the 10000 conformations, presents a smoother behavior, with essentially no features.
000. The individual conformations display several features along the complete momentum transfer range simulated. The initial part of the simulated curves, containing the lowest resolution structural information, presents distinct slopes, indicating a large variety of possible sizes and shapes that an unstructured chain can adopt. The SAXS profile, obtained after averaging curves for the 10000 conformations, presents a smoother behavior, with essentially no features.
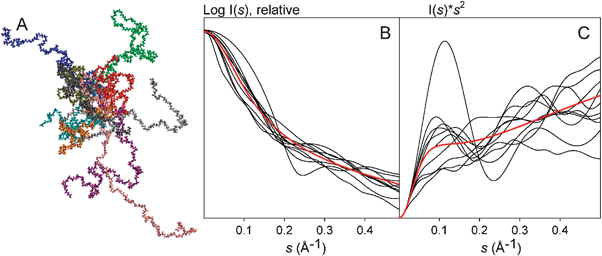 | ||
| Fig. 2 Effect of the conformational sampling of IDPs on SAXS profiles and their Kartky representations. (A) Ten 100-residue long polyalanine conformations built with Flexible-Meccano, chosen from a pool of 10000, representing the variety of sizes and shapes encountered in a disordered protein. (B) Individual SAXS profiles (black) and (C) Kratky plots (black) of these ten randomly selected chains. The average of the SAXS intensities and the Kratky plots from the 10000 conformations are shown in red in (B) and (C), respectively. Averaged curves indicate the common behavior of fully disordered proteins. | ||
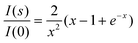
Traditionally, Kratky plots (I(s)·s2 as a function of s) have been used to qualitatively identify disordered states and distinguish them from globular particles. The Kratky representation has the capacity to enhance particular features of scattering profiles, thus allowing easier identification of degrees of compactness.12 The scattering intensity of a globular protein behaves approximately as 1/s4 conferring a bell-shaped Kratky plot with a well defined maximum. Conversely, an ideal Gaussian chain has a 1/s2 dependence of I(s) and therefore presents a plateau at large s values. In the case of a chain with no thickness, the Kratky plot also presents a plateau over a specific range of s, which is followed by a monotonic increase. The latter behavior is normally observed experimentally in unfolded proteins. Unfolding processes monitored by SAXS are good examples of how the decrease in protein compactness is translated into Kratky plots.19,20 To exemplify what typically occurs in an IDP, we present the Kratky plots of the above-mentioned ten individual SAXS profiles compared with the averaged one (Fig. 2C). The diversity of profiles observed is even more noticeable when using the Kratky representation. While some profiles present a clear maximum, indicating a compact conformation, others present less evident shapes. When averaging the 10000 curves computed, the average Kratky plot presents a monotonic increase, as expected for an unstructured system. Multi-domain proteins, where two or more globular domains are connected by flexible linkers, are a special case of IDPs that present a dual behavior. Consequently, SAXS profiles and Kratky plots present contributions from both structurally distinct regions.
Radius of gyration, a single parameter to identify IDPs
Given the presence of highly extended conformations, unstructured proteins are characterized by large average sizes compared to globular proteins. The radius of gyration, Rg, which can be directly obtained from a SAXS curve using a classical Guinier approximation,21 is the most common descriptor to quantify the overall size of molecules in solution. The comparison of the experimentally measured Rg values with those predicted by theoretical models, mainly derived from polymer physics, is used as an indication of the unstructured nature of a protein. In this section we briefly describe the models used to quantitatively interpret Rg values for IDPs.In the Guinier approximation, Rg is obtained by a simple linear fit in logarithmic scale, assuming that at very small angles (s < 1.3/Rg) the intensity is represented as I(s) = I(0) exp(−(sRg)2/3).21 Alternatively, Debye's approximation, eqn (4), can be more precise than Guinier's as its validity extends to larger momentum transfer ranges.22
 | (4) |
The experimental Rg is a single value representation of the size of the molecule, which for disordered states represents a z-average1 over all accessible conformations in solution. The most common quantitative interpretation of Rg for unfolded proteins is based on Flory's equation,23 which relates it to the length of the protein chain through a power law,
| Rg = R0·Nν | (5) |
The comparison of Rg for proteins with threshold values derived from Flory's equation is a very common strategy to assign disorder to a protein. However, the question as to whether conformational sampling in a chemically denatured state is equivalent to that found for IDPs in native conditions must be clarified. It has been postulated that the interaction of denaturants such as urea or guanidinium chloride with backbone and/or side chain atoms could perturb the Ramachandran populations that define the conformational variability of disordered proteins (see ref. 27 and references therein). A recent NMR study based on the measurement of several Residual Dipolar Couplings (RDCs) along the ubiquitin backbone indicated that chemically denatured proteins have an enhanced population of extended conformations compared to IDPs.28 As a result of this perturbation at residue level, the overall properties in the two conditions could also differ. This issue has been recently addressed by comparing Rg values measured for chemically denatured and natively disordered proteins with those computed from large ensembles of conformations with distinct percentages of extended conformations at residue level.29 That study found that a 15% increase in extended conformations was required to describe Rg data measured for chemically denatured proteins, in perfect agreement with the previously mentioned RDC study.28 The same enhancement had to be invoked to properly describe hydrodynamic radii measured with pulsed-field gradient diffusion NMR experiments. These results suggest that parameters of Flory's relationship derived for denatured proteins are not appropriate for IDPs (see below).
Applications of SAXS to IDPs
Biophysical characterization of IDPs using SAXS
SAXS has been widely used for decades to characterize disordered protein states and IDPs. In most cases, the analysis of SAXS curves is complemented with other experimental techniques to identify unstructured regions in proteins. Circular dichroism (CD), NMR, fluorescence spectroscopy, and hydrodynamic techniques such as size exclusion chromatography (SEC), AUC, and DLS, have been used in combination with SAXS to identify proteins such as IDPs. Bioinformatic tools often complement these experimental studies, exploiting their capacity to predict protein disorder from amino acid sequences. Since the pioneering study of prothymosin α,55 several other IDPs have been biophysically characterized with scattering techniques (Table 1). In all these cases, a monotonic increase in Kratky plots as well as large Rg values and expanded p(r) functions with very large Dmax values were the key SAXS features used to identify unstructured proteins.| Protein | #Residuesa | R g exp/Å | R g RC/Åb | Ref. |
|---|---|---|---|---|
| a When present, His-tags were considered part of the protein. b Threshold Rg value obtained from the parametrization of Flory's relationship with the coil database. c Length of the most populated isoform of the samples was used. d R g derived from averaging conformations selected with EOM. e Data measured by SANS in highly crowded conditions (130 mg ml−1 of BPTI). f Data derived from the 10 mM Arg/Glu buffer. | ||||
| MeCP2 | 486 | 62.5 ± 4.5 | 64.2 | 30 |
| Msh6 N-term | 304 | 56 ± 2 | 50.2 | 31 |
| Ki-1/57 | 292 | 47.5 ± 1.0 | 49.2 | 32 |
| MeCP2 (78–305) | 228 | 37.0 ± 0.9 | 43.3 | 30 |
| Synthetic Resilin | 185 | 50 ± 5 | 38.8 | 33 |
| Pig Calpastatin domain I | 148 | 35.4 | 34.5 | 34 |
| HrpO | 147 | 35.0 | 34.4 | 35 |
| II-1 | 141c | 41.0 ± 1.0 | 33.6 | 36 |
| α-Synuclein, pH 7.5 | 140 | 40 ± 1 | 33.5 | 37 |
| α-Synuclein, pH 3.0 | 140 | 30 ± 1 | 33.5 | 37 |
| N-tail nucleoprotein MV | 139 | 27.2 ± 0.5 | 33.4 | 38 |
| β-synuclein | 137 | 49 ± 1 | 33.1 | 39 |
| Human NHE1 cdt (5 °C) | 131 | 37.1d | 32.4 | 40 |
| Human NHE1 cdt (45 °C) | 131 | 35.3d | 32.4 | 41 |
| ERM Transactivation Domain | 130 | 39.6 ± 0.7 | 32.2 | 42 |
| Neuroligin 3 | 118 | 31.5 ± 1.0 | 30.6 | 43 |
| elF4E binding Protein (4E-BP) | 117 | 48.8 ± 0.2 | 30.5 | 44 |
| Prothymosin α, pH 7.5 | 109 | 37.8 ± 0.9 | 29.4 | 45 |
| Prothymosin α, pH 2.5 | 109 | 27.6 ± 0.9 | 29.4 | 45 |
| paNHE1 cdt (5 °C) | 107 | 32.8d | 29.1 | 40 |
| paNHE1 cdt (45 °C) | 107 | 32.9d | 29.1 | 41 |
| N-protein of bacteriophage λ | 107 | 33 ± 2e | 29.1 | 46 |
| FEZ1 monomer | 103 | 36 ± 1 | 28.5 | 47 |
| HIV-1 Tat133 | 101 | 33.0 ± 1.5 | 28.3 | 48 |
| p53 (1–93) | 93 | 28.7 ± 0.3 | 27.1 | 49 |
| Sic1 | 92 | 34.7 | 26.9 | 50 |
| pSic1 (hexaphosphorylated) | 92 | 34.0 | 26.9 | 50 |
| PIR domain | 75 | 26.5 ± 0.5 | 24.2 | 51 |
| IB5 | 73c | 27.9 ± 1.0 | 23.8 | 36 |
| ACTR (5 °C) | 71 | 25.8d | 23.5 | 41 |
| ACTR (45 °C) | 71 | 23.8d | 23.5 | 41 |
| N-term VS Virus phosphoprotein | 68 | 26 ± 1f | 23.0 | 52 |
| Tau ht40 | 441 | 65 ± 3 | 61.0 | 53 |
| Tau K32 | 202 | 42 ± 3 | 40.6 | 53 |
| Tau K16 | 174 | 39 ± 3 | 37.5 | 53 |
| Tau K18 | 130 | 38 ± 3 | 32.2 | 53 |
| Tau ht23 | 352 | 53 ± 3 | 54.2 | 53 |
| Tau K27 | 171 | 37 ± 2 | 37.2 | 53 |
| Tau K17 | 143 | 36 ± 2 | 33.9 | 53 |
| Tau K19 | 99 | 35 ± 1 | 28.0 | 53 |
| Tau K44 | 283 | 52 ± 2 | 48.4 | 53 |
| Tau K10 | 167 | 40 ± 1 | 36.7 | 53 |
| Tau K25 | 185 | 41 ± 2 | 38.7 | 53 |
| Tau K23 | 254 | 49 ± 2 | 45.7 | 53 |
| Tau K32 AT8 AT100 | 202 | 41 ± 3 | 40.6 | 53 |
| Tau ht23 S214E | 352 | 54 ± 3 | 54.2 | 53 |
| Tau ht23 AT8 AT100 | 352 | 52 ± 3 | 54.2 | 53 |
| Tau K18 P301L | 130 | 35 ± 2 | 32.2 | 53 |
| Tau ht40 AT8 AT100 PHF1 (10 °C) | 441 | 66 ± 3 | 61.0 | 54 |
| Tau ht40 AT8 AT100 PHF1 (50 °C) | 441 | 67 ± 3 | 61.0 | 54 |
An excellent example of the synergy between SAXS and other experimental and computational tools to structurally characterize IDPs is the 139-residue-long C-terminal Measles virus nucleoprotein case, N-tail.38 The CD spectra with random coil signatures and the low dispersion of the 1H NMR spectra clearly suggested that N-tail was disordered. These observations were in agreement with the notably large Rg obtained from Guinier analysis of the small-angle region (27.5 ± 0.7 Å). However, N-tail Kratky plot presented a clear bump at s = 0.08 Å−1 followed by a flat region. This dual behavior indicates a certain degree of compactness. A bioinformatics analysis predicted a 16-residue-long fragment with a strong tendency to form an α-helix. In a subsequent crystallographic study, this fragment was found to form an α-helix in complex with its natural partner, the C-terminal region of the phosphoprotein. This observation confirmed that this stretch was a molecular recognition element.56 Interestingly, the same region of the protein belonging to the related Sendai virus family was identified to have a large population, around 75%, of helical conformations,57,58 thus substantiating the results for Measles N-tail. Importantly, populations of nascent secondary structural elements such as the one found in this study are often related to biomolecular recognition events involved in regulation and signaling59–61
There have been attempts to reconstruct low resolution structures from SAXS data for disordered chains using standard programs designed to address rigid systems. The resulting ab initio reconstructions or the rigid-body models display highly elongated shapes, dictated by their large Dmax. The validity of these single conformation approaches to describe a highly plastic protein is uncertain, although clearly helps to visualize a largely diffuse molecule.
Intrinsically disordered fragments are often attached to or tether folded domains. This architecture provides advantages in recognition events. There are several SAXS studies of partially folded proteins. Some examples are the transcriptional repressor CtBP,62 Factor H,63,64 the C-terminus of Sendai virus phosphoprotein,14 N-terminus of Msh6,31 p53,65 Prion protein,66 Alix,67 proNGF,68 Phd N-terminal domain,69XRCC4,70TIAR,71Replication Protein A,72 MMP-1,73FERM domains,74 and the entire Measles virus nucleocapsid.75 The presence of highly flexible regions attached to globular particles induces a dual behavior in the Kratky plots of partially folded proteins. These plots display a clear maximum, corresponding to the folded part of the protein, and a contribution with a continuous rise produced by the presence of disordered regions. The relative number of amino acids from these structurally distinct domains dictates the features of the Kratky plot. Fig. 3 displays the Kratky plot for three distinct constructs of Src-Kinase and exemplifies the prototypical features of globular, fully disordered and partially folded proteins. In a recent study, the effects of disordered linkers in SAXS data analysis were systematically addressed using synthetic data.76 In that study, a decrease in the structural features in SAXS profiles, which report on the loss of structural correlations, was observed when moving from static scenarios to highly dynamic ones. This systematic smoothening of the profiles was enhanced in Kratky representations of the same data that displayed a single broad maximum. These observations are in agreement with several experimental studies of multi-domain proteins.72,77
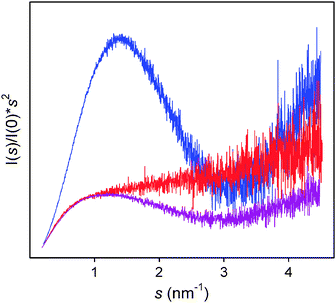 | ||
| Fig. 3 Kratky plot for three constructs of Src-Kinase. The globular SH3 domain (blue), the fully disordered Unique domain (red), and a construct joining both domains (purple). The prototypical features of globular and disordered domains are combined in the partially folded construct. Courtesy of Yolanda Pérez and Miquel Pons (Institute for Research in Biomedicine, Barcelona). | ||
Proteins with large disordered tails or flexible linkers show specific features when modeled using approaches based on the presence of a single conformation. Ab initio reconstructions display an apparent decrease in the resolution of the envelopes, where densities corresponding to the globular units are difficult to identify. Rigid body models show very elongated shapes with isolated globular domains. These resulting structural trends have been proposed as an indicator of large-scale motions and flexibility in multi-domain proteins.76
Monitoring environmental changes in IDPs with SAXS
IDPs are often involved in signaling processes and, in order to bind to or be released from their natural partners, the global properties of these proteins change in response to environmental modifications within the cell. SAXS is a well suited tool to rapidly monitor large structural perturbations in proteins upon such environmental modifications. Again, these global alterations are reflected in the Rg, Dmax, and appearance of Kratky plots. Several studies have monitored structural perturbations in response to changes in temperature,41,54 pH,34 ionic strength,78 presence of specific ions,79,80 additives,52,81 reducing agents,47,82 crowding agents,46 and post-translational modifications, such as phosphorylation,50,79sumoylation,42 and glycosilation.36 Perturbations on the overall structural properties exerted by point mutants have also been explored by SAXS.37,53Prothymosin α has been studied by SAS in range of conditions. Of its 109 residues, roughly half are aspartic and glutamic acids, such that the protein is predicted to have a global charge of −54 at neutral pH. SAXS curves of prothymosin α have been measured in near neutral (pH 7.5) and acidic conditions (pH 2.5).45 Although Kratky plots indicated that the system was unstructured in both conditions, a dramatic reduction in Rg from 37.8 ± 0.9 Å to 27.6 ± 0.9 Å was observed in response to a decrease in pH. Interestingly, a similar level of compaction, down to Rg of 28.1 ± 0.8 Å, was detected when 15 mM of Zn2+ was added to the sample at neutral pH.83 These dramatic changes in protein size can be explained by a screening of the electrostatic repulsion within the chain at low pH and by the presence of cations bound to prothymosin α.
The effect of temperature on IDP structure has recently been addressed in two studies that combined SAXS with other biophysical tools.41,54 Kjaergaard et al. found a contraction in the Rg values of two IDPs, human NHE1 and ACTR, when temperature was increased from 5 to 45 °C. This observation thus reflects changes in the conformational sampling at residue level (see Table 1). CD and NMR experiments in the same experimental conditions demonstrated that transient α-helices partially unfold upon increasing temperature. Assuming that the presence of an α-helix compacts the ensemble, the authors proposed that the Ramachandran space sampled by IDPs is redistributed with temperature and the population of Polyproline II (PPII) conformations is transformed into the less extended β-strand ones. The effect of temperature jumps on the structure of protein Tau (441 residues) has recently been addressed by Shkumatov et al.54SAXS data on wild-type Tau and a mutant that mimics a phosphorylated state were collected at 10 °C and 50 °C and no changes in the apparent Rg were observed (66 ± 3 and 65 ± 3 Å, respectively). However, SAXS curves measured after a rapid temperature jump, from 10 °C to 50 °C or from 50 °C to 10 °C, presented Rg values that were notably smaller than curves measured in equilibrium, 55 ± 3 and 56 ± 3 Å, respectively. Interestingly, the structural compaction was preserved for several hours after the temperature jump until it reached the conformational equilibrium. The authors attributed this intriguing effect to structural memory of the protein, which may be associated with the more compact nature of hyperphosphorylated Tau involved in neurodegeneration in Alzheimer's disease.
In a recent study, the effect induced by crowders on the level of IDP compaction was evaluated for N-protein of bacteriophage λ in the presence of increasing concentrations (up to 130 mg ml−1) of bovine pancreatic trypsin inhibitor (BPTI).46 Performed with SANS, this pioneering study allowed the contrast matching of protonated BPTI. Deuterated N-protein displayed a severe compaction when going from 0 to 65 mg ml−1 of BPTI, but this level was maintained when crowder concentration was increased to 130 mg ml−1. Interestingly, the formation of large oligomers was inhibited at this high BPTI concentration. This non-linear compaction with the concentration of crowders suggests complex conformational behavior of IDPs in conditions that resemble those found in vivo. This study opens the door to the use of SAS to further study crowding effects at molecular level by approaching conditions similar to those encountered by biomolecules in cells.
A SAXS perspective of biomolecular interactions of IDPs
The large conformational sampling observed in IDPs provides them with highly specific binding properties that enable them to play pivotal roles in several signaling pathways. Interaction with a partner normally requires rigidifying the highly plastic IDP in a single conformation, leading to a so-called folding upon binding.84 In addition, the large surface exposed by IDPs and their adaptability to a range of environments makes these proteins highly selective and promiscuous partners. These two properties, inherently embedded in their disordered nature, imply that IDPs are well suited for the transient interactions required for signal transduction and regulation. Therefore studies on the biomolecular recognition processes of IDPs are crucial to further understand of the biological role of this family of proteins, and SAXS has greatly contributed in this regard. Several studies have addressed the interactions of a number of IDPs with other proteins,31,44,50,85,86 and with DNA.65,66 Two of these exemplify the power of SAXS to study IDP recognition events.The Msh2–Msh6 complex recognizes mismatched bases in DNA during mismatch repair. The N-terminal region of Msh6, a 304-residue-long IDP, recognizes PCNA, a homotrimeric protein that controls the processivity of DNA polymerases. Shell and co-workers demonstrated this direct interaction with SAXS.31 A comparison of the Rg, Kratky plots and p(r) functions of the isolated partners and the complex showed that PCNA does not induce substantial structure to the N-terminal region of Msh6, which remains mainly disordered and proteolytically accessible upon binding. The interaction of the Msh2–Msh6 complex with PCNA was also addressed by SAXS. The interaction was shown to produce a complex that could be considered a highly flexible dumbbell, where both globular domains are tethered by the N-terminal Msh6 fragment, which acts as a molecular leash. These observations were further confirmed in an additional experiment with a biologically active deletion mutant of Msh6 with a notably shorter N-terminal tail. In these conditions, the large changes in size upon binding were easily monitored by the p(r) and Dmax derived from the SAXS profiles.
The tumor suppressor p53 is a multifunctional protein that plays a crucial role in processes like the regulation of apoptosis and DNA repair. p53 is a homotetramer with two folded domains that are tethered and flanked by unstructured regions that represent 37% of the whole sequence. Rigid-body modeling of SAXS data measured for p53 suggests that the protein is an open cross-like tetrameric assembly that collapses to tightly embrace DNA.65 This flexible architecture helps p53 to fulfil its function of constantly watching over the DNA in the cell. Interestingly, the SAXS model of the nucleoprotein without the disordered N-terminal transactivation domains is in excellent agreement with an independent electron microscopy map of the same complex.
SAXS as a tool to validate computational models of unstructured proteins
For many years, considerable research efforts have been devoted to the development of realistic ensemble models of unstructured states of proteins.87 Initially, these models were focused on protein states under denaturing conditions for a better understanding of the folding process.88 In addition, molecular properties, such as solvent accessibility, straightforwardly derived from these ensembles serve as a basis for a quantitative interpretation of protein thermodynamics and stability.89,90 More recently, structural models of IDPs have been developed in order to structurally characterize this family of proteins.14The quality of in silico structural models has been evaluated by their capacity to properly reproduce experimental data measured for disordered proteins. SAXS has arguably been the most popular technique, although hydrodynamic measurements and NMR have also been used.91 Several types of models with varying degrees of structural resolution have been validated with previously mentioned compilations of Rg for denatured proteins.29,92–99 These studies report remarkable agreement with the experimental data. However, for most of the models an additional parameterization accounting for the exclusion, the solvation terms, or the conformational sampling at residue level was required.
In more advanced studies, complete scattering profiles were considered. Extending the momentum transfer range has stimulated the development of more adequate ensemble models, which have to be tested at higher resolution. Zagrovic et al. addressed the conformational study of a synthetic peptide by combining state-of-the-art molecular dynamic simulations with the experimentally measured SAXS profile.100 In another example, scattering patterns of the reduced ribonuclease A in a range of denaturing conditions were well reproduced with a proper selection of the solvation term.99 A very simplistic structural model based on polymer theory was used to describe the SANS curve of denatured phosphoglycerate kinase.101
Fewer studies of this kind have been performed for IDPs. To explain the SAXS curve measured for the complex of p27kip1/Cdk2/Cyclin A, the plasticity of the system was explicitly accounted for.86 Hundreds of snapshots of the molecular dynamics simulation of the complex were collected, and their theoretical SAXS profiles were computed and averaged, yielding a curve with a better description of the experimental data than single conformation models.
The Flexible-Meccano (FM) program has been the most tested structural model for IDPs. FM assembles peptidic units, considered rigid entities, in a consecutive way.14 The force-field used for this algorithm includes a coil description of the residue-specific Ramachandran space sampled by the amino acids, and a coarse-grained description of the side-chains thereby preventing steric clashes. This program has been tested for a large number of IDPs and has successfully described several NMR observables and SAXS data measured for these proteins.102 Remarkable agreement was found between the SAXS curve derived from FM ensembles and the experimental ones for the partially folded Sendai virus PX,14 the transactivation domain of p53,49 and the K18 construct of Tau protein (Fig. 4).53,103 In these two latter cases, transient levels of structuration were found by RDCs. Remarkably, in all these cases the same structural model simultaneously described NMR properties, which mainly report on the conformational (local) properties, and SAXS curves, which report on the size and shape (global) of the proteins. Again, these results underline the synergy between SAXS and NMR observables.
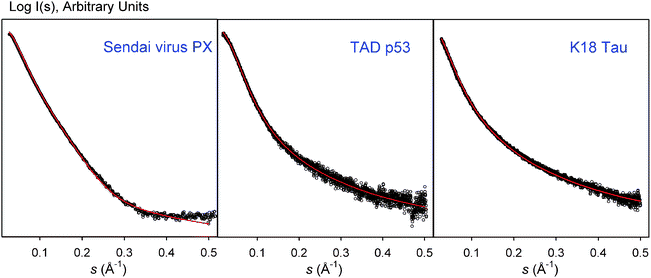 | ||
| Fig. 4 Comparison of the experimental SAXS profiles (empty dots) with the theoretical ones derived from large ensembles computed with Flexible-Meccano (FM)(red) for Sendai virus PX, Transactivation domain of p53, and K18 construct of Tau protein. FM ensembles were modified to reproduce RDC data in these cases. The excellent agreement in these three examples indicates the proper description of the overall properties of IDPs coded in FM. Note that these plots come from a direct comparison of SAXS curves and not from a fitting. | ||
The encouraging results obtained for the structural modeling of several IDPs using FM prompted the derivation of a specific parametrization of Flory's equation for these proteins (eqn (5)).29 This aim was accomplished by fitting Rg values derived from synthetic SAXS curves computed for large conformational ensembles, built with FM, of several proteins covering a large spectra of sizes (eqn (6)).
| Rg = (2.54 ± 0.01)·N(0.522 ± 0.01) | (6) |
The exponential value obtained from the parametrization, ν = 0.522 ± 0.01, was notably smaller than that derived from the dataset of denatured proteins, ν = 0.598 ± 0.028, indicating that IDPs are more compact than chemically denatured proteins. Given a natively disordered protein of N residues, this new parametrization provides the expected Rg assuming random coil behaviour as implemented in FM (see above). Fig. 5 displays Rg values measured for 50 IDPs (Table 1) as a function of their length compared with Flory's models derived for chemically denatured and natively disordered proteins. As some IDPs are expected to have populations of secondary or tertiary structure, this parametrization can be used as an interpretative tool, and departures from expected values are indications of compactness of extendedness of the protein. Several proteins present considerable degrees of extendedness (Fig. 5) and, in some cases, this can be rationalized by analyzing the secondary structure predictions. FEZ1 monomer is predicted to have regions prone to form coiled coils.47 Synthetic resilin, (GAPAQTPSSQY)16, probably observes some structuration in its repetitive units that cooperatively enlarges the apparent size.33 II-1 and IB5 expectedly display large Rg values as a result of their high content of proline residues known to form PPII secondary structures.36 A number of Tau protein constructs are also systematically above the threshold because of the presence of proline-rich domains and partially structured regions, which have been identified and characterized by NMR.103,104 According to this compilation of data, the presence of long-range contacts that induce protein compactness is less common. The N-tail of Measles virus, fragment 78–305 of MeCP2, and α-synuclein are examples of compaction. For the latter, NMR studies report transient end-to-end interactions, which are hypothesized to prevent aggregation.105,106
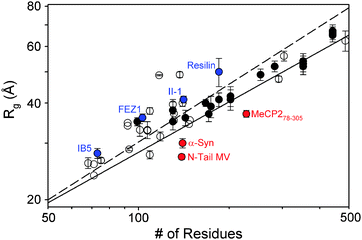 | ||
| Fig. 5 Dependence of the experimentally measured Rgs with the chain length for IDPs listed in Table 1. Full dots correspond to Tau protein constructs. Straight lines correspond to Flory's relationship parametrizations for the denatured proteins (dashed) and IDPs shown in eqn (6) (solid). Examples highlighted in text presenting enhanced extendedness (blue) or compactness (red) are localized in the plot. | ||
Amyloidogenic processes in IDPs monitored by SAXS
Through complex self-assembly, some IDPs form amyloid fibers, which are the hallmark of neurodegenerative disorders such as Alzheimer's, Parkinson's and Huntington's diseases.107 The relevant species present during fibrillation and their mechanism of interconversion are poorly understood. These are relevant questions as soluble oligomeric species that precede the formation of mature fibers have been hypothesized to be the cytotoxic agents that ultimately cause cellular damage. Recently, Giehm et al. demonstrated that SAXS is a valuable tool to address relevant structural questions related to amyloidogenesis.108 In that study, the fibrillation of intrinsically disordered α-synuclein, which forms intracellular inclusions associated with Parkinson's disease, was monitored using SAXS by measuring profiles every 30 minutes over 24 hours. The profiles contained contributions from all the species present at that time-point. The ensuing problem was then the deconvolution of the complex dataset to derive species-specific information. Singular Value Decomposition (SVD) indicated that only four species are required to describe the complete SAXS dataset. The authors assigned these four species to monomer, dimer, mature fibril, and a fourth species of unknown nature. Using SAXS profiles measured separately for the three components as fixed contributions, and the optimization approach previously designed to study insulin aggregation,10 they derived the SAXS curve for the fourth component. Time-dependent relative populations of all the species indicated that this component is an on-pathway oligomeric nucleus of fibrils. Structural modeling of this oligomer yielded a slightly elongated annular particle with a Dmax of 180 ± 30 Å with a central cavity containing ≈ 16 α-synuclein monomers (Fig. 6B). Ab initio models of the repeating unit of the fibers indicated a highly elongated (900 Å) symmetrical particle with a diameter of ≈180 Å (Fig. 6C), which is consistent with the oligomer Dmax, thereby suggesting that oligomers are the building blocks that form the fibers (Fig. 6A). Stacking of 26 oligomers through the flat side of the wreath and imposing a 360°/26 rotation yielded a fiber repeating unit consistent with that obtained by ab initio modeling (Fig. 6D).![Low-resolution SAXS models of the oligomer, fibril, and an on-pathway oligomer of α-synuclein. (A) The p(r) of the early and late fibrils (large spheres, light and dark colors respectively), and the cross section of the early fibril (inset, black spheres) compared with the p(r) of the oligomer [inset, (white spheres)]. (B) SAXS-derived structure of the α-synuclein oligomer. Two orthogonal views of the average structure (mesh representation) and the filtered averaged structure (surface representation) are displayed and superimposed. The filtered structure has a volume corresponding to the average volume of individual models, and the difference between the average and filtered structure indicates the general level of differences between individual models. (C) The SAXS-derived model of the symmetric, early fibril that is present in solution in equilibrium with native species and a fourth component. A single repeating unit is shown in cyan, with the averaged model and the filtered averaged models superimposed in mesh-representation. The principle of the repeats building the mature fibrils is shown to the right, where three repeats of the filtrated model are displayed. Repeats two and three have been translated 880 Å vertically with respect to the first repeat, and the model to the right is rotated 90° around a vertical axis with respect to the left model. (D) Model for the elongation of fibrils. In pink/purple, 26 oligomers constituting one repeating unit of the mature fibril (averaged and filtered model shown in cyan mesh) are displayed in surface representation. Below, the 26 oligomers are superimposed with the fibril repeating unit, whereas the two models are separated above. The lowest representation is rotated 90° around a horizontal axis with respect to the top two models. Figure reprinted from ref. 108.](/image/article/2012/MB/c1mb05275f/c1mb05275f-f6.gif) | ||
| Fig. 6 Low-resolution SAXS models of the oligomer, fibril, and an on-pathway oligomer of α-synuclein. (A) The p(r) of the early and late fibrils (large spheres, light and dark colors respectively), and the cross section of the early fibril (inset, black spheres) compared with the p(r) of the oligomer [inset, (white spheres)]. (B) SAXS-derived structure of the α-synuclein oligomer. Two orthogonal views of the average structure (mesh representation) and the filtered averaged structure (surface representation) are displayed and superimposed. The filtered structure has a volume corresponding to the average volume of individual models, and the difference between the average and filtered structure indicates the general level of differences between individual models. (C) The SAXS-derived model of the symmetric, early fibril that is present in solution in equilibrium with native species and a fourth component. A single repeating unit is shown in cyan, with the averaged model and the filtered averaged models superimposed in mesh-representation. The principle of the repeats building the mature fibrils is shown to the right, where three repeats of the filtrated model are displayed. Repeats two and three have been translated 880 Å vertically with respect to the first repeat, and the model to the right is rotated 90° around a vertical axis with respect to the left model. (D) Model for the elongation of fibrils. In pink/purple, 26 oligomers constituting one repeating unit of the mature fibril (averaged and filtered model shown in cyan mesh) are displayed in surface representation. Below, the 26 oligomers are superimposed with the fibril repeating unit, whereas the two models are separated above. The lowest representation is rotated 90° around a horizontal axis with respect to the top two models. Figure reprinted from ref. 108. | ||
The structural characterization of soluble oligomers in amyloidogenic processes is difficult to achieve as these molecules are in dynamic equilibrium with other species, are difficult to isolate, and are sensitive to surface conditions imposed by microscopy techniques. This pioneering work overcame these intrinsic limitations by isolating the scattering signal from complex mixtures instead of isolating molecular species. Using equivalent or similar approaches, we anticipate a pivotal role for SAXS in future studies of amyloidogenic processes linked to disease.
Ensemble representations of flexible proteins using SAXS
Proteins display a large spectrum of motional modes encompassing rapid fluctuations around the average globular structure, slow large-scale molecular reorganizations, and the inherent disorder observed in IDPs. In all these scenarios, protein dynamics is crucial for biological function, including recognition, regulation and catalysis. In recent years, guided by experimental data that represents average values for the complete ensemble of conformations, structural biologists have addressed the challenge of describing dynamic systems in terms of ensembles of reliable conformations.109SAXS has not been exempt of this tendency and several approaches have been developed to characterize protein mobility: The Ensemble Optimization Method (EOM),15 the Minimal Ensemble Search (MES),110 Basis-Set Supported SAXS (BSS-SAXS),111 and the Ensemble Refinement of SAXS (EROS).112 These methods are based on a common strategy that consists of the following two consecutive steps: (i) computational generation of a large ensemble describing the conformational landscape available to the protein, and (ii) selection of a subensemble of conformations that collectively describe the experimental profile using distinct optimization methods. In the following section we provide a more detailed description of the EOM approach as it is especially well suited for the structural characterization of IDPs.General description of the EOM
The EOM methodology has been developed as a general approach to address the structural characterization of IDPs by SAXS.15 Using this strategy, the experimental SAXS profile is assumed to derive from a (undetermined a priori) number of coexisting conformational states. A subensemble of conformations is selected by a genetic algorithm from the scattering patterns computed from a large pool representing the maximum flexibility allowed by the protein topology. In this regard, EOM can be considered as a data-driven optimizing ensemble strategy. Optimization of the large number of degrees of freedom by EOM using low-content information requires assumptions in order to generate the pool of conformations. The pool of random conformations is also used to establish a threshold for the later quantitative interpretation of the results in terms of distributions of selected structures. In this regard, the EOM approach is not entirely model-independent as it relies on the structural rules imposed for the generation of conformations. It is worth mentioning that EOM provides a new source of structural information for disordered and also for flexible multidomain proteins (see some examples in ref. 113–117). The major features of the EOM will be discussed in the following sections.The EOM algorithm
In the EOM algorithm, schematically depicted in Fig. 7, a potential solution is represented by an ensemble containing N different conformers of the same molecule (in practice, N is about 20 to 50). The appropriate ensemble is selected from a pool containing M ≫ N conformers, which should cover the conformational space available to the molecule. A genetic algorithm (GA)118 is then used to select subsets of configurations that collectively (averaging their individual scattering profiles) fit the experimental data.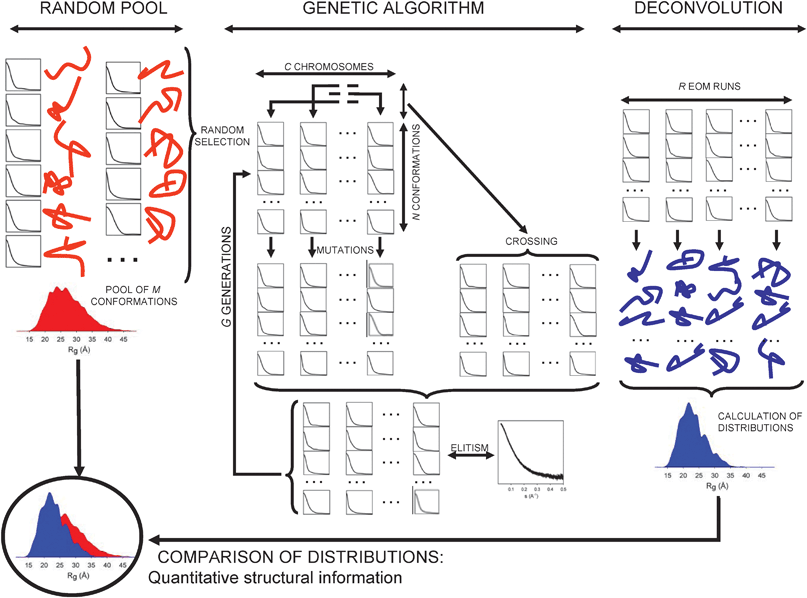 | ||
| Fig. 7 Schematic representation of the EOM strategy for the analysis of SAXS data in terms of Rg distributions. The M conformations/curves of the pool (random distribution), left part of the figure, are used to generate the initial Cchromosomes and to feed the genetic operators (mutations, crossing and elitism) along the GA process that runs for G generations. The complete process is repeated R independent times, and each run provides N selected structures/curves that fit the experimental profile. The structural analysis of the resulting conformations is displayed on the right part of the scheme, the Rg distribution of the selected (N × R) conformations is compared with that derived from the pool that is considered as a complete conformational freedom scenario. From this comparison it is possible to derive a quantitative structural estimation of the protein conformations coexisting in solution. | ||
The scattering data from such an ensemble are computed by summing up the individual scattering patterns (eqn (2)). It is assumed that all conformers equally populate the subset, so that the intensity of a subset I(s) containing N conformers is
 | (7) |
 | (8) |
The possibility to choose from among millions of combinations of scattering patterns in order to fit the experimental data may give the impression that EOM could provide aliased results fitting SAXS curves with artefacts such as oligomerization, aggregation or interparticle interactions. However, in our experience it is not possible to fit a SAXS curve when the structures contained in the pool are not a reliable representation of what is present in solution. In these cases, the χ2 values obtained are large, and systematic errors are found, especially in the initial part of the curve. In a recent study, Mosbæk et al. achieved good agreement with the experimental SAXS curve measured for Factor VIIa only when the pool was populated with dimers.120 Therefore, in addition to describing the conformational fluctuations of the protein, the oligomerization equilibrium was also characterized. As a consequence of this ability, EOM can also be used to discard or quantify the presence of oligomeric species in solution.113,120
Structural information coded in EOM ensembles
An ensemble of N ≈ 20–50 structures is far too small to explain the conformational behavior of a flexible protein sampling an astronomical number of conformations in solution. However, these subpopulations are sufficient to delineate the global properties of the protein in terms of size and shape (i.e. Rg, Dmax and anisotropy). One may also argue that, due to the restricted structural information content of SAXS data, the EOM model containing relatively small number of conformers adequately describes the entire system. Similar approaches using higher resolution and structurally richer data (e.g. RDCs in NMR) require much larger ensembles to reach reasonable levels of convergence.14,95,102Due to the low-resolution nature of SAXS data, selected conformations cannot be analyzed at residue level as they do not hold this detailed structural information. The structures selected by the EOM, even the most populated ones, cannot be claimed to truly be present in solution. Instead, the EOM ensemble must be interpreted and used as a tool to describe the size and shape properties in terms of the distributions of disordered proteins in solution. This interpretation is supported by the observation that selected ensembles derived from repeated EOM runs starting from distinct random chromosomes contain different conformations but provide similar Rg, Dmax and anisotropy distributions. Therefore, the algorithm is able to find equivalent minima in terms of distributions but not in terms of individual molecular configurations: the latter are not identifiable because of the low resolution of SAXS. Therefore, several high-resolution descriptions of the system give rise to common structural descriptions at a lower resolution. However, the distributions provided by EOM represent a major advance over traditional approaches that condense all structural characteristics of disordered systems in averaged parameters.
It is highly instructive to compare EOM-derived distributions with those of the random ensembles (initial pools) to detect the potential presence of nascent secondary structural elements or low populations of transient long-range contacts as perturbations of the distributions with respect to the pool. The presence of secondary structure induces Rg distributions that are shifted towards larger values. Transient long-range contacts and residual tertiary structure provide more compact distributions than the random coil scenario represented in the pool. It is worth mentioning that this comparison is valid only when the structural model used to build the pool is physically meaningful. In other words, it must provide a true representation of the structural features of complete disorder in the regions defined as flexible. As discussed above, FM and RanCh ensure proper random coil distributions for IDPs and intrinsically disordered regions of proteins. Other approaches, such as molecular dynamics simulations, even when yielding good fits can provide structurally biased ensembles that can induce a misinterpretation of the structural properties of the system when the previously mentioned comparison of distributions is applied.
Examples of the application of EOM to IDPs
EOM strategy has been used to characterize many disordered proteins. Two cases will be described in detail to underline the power of this approach to interpret SAXS data. The first example is the biophysical characterization of the N-terminal region of vesicular stomatitis virus phosphoprotein (VSV-P60), which interacts with the nucleoprotein to form a complex that is indispensable for the proper encapsidation of the RNA genome of VSV.52 With a length of 68 amino acids containing the recognition element of the nucleoprotein, this protein presents large Rg and Dmax values, thereby indicating that VSV-P60 is an IDP, which is in agreement with the poor dispersion of the 1H NMR signals, CD spectroscopy and SEC. Analysis of the chemical shifts and relaxation rates by NMR identify two regions of the protein with transient helical conformations. The EOM analysis of the SAXS curve displays a bimodal distribution of Rg values containing two subpopulations of compact and extended conformers. The bimodal distribution is maintained regardless of the parameters used for the GA procedure. This finding suggests the robustness of this observation. The structural nature of the two subpopulations was studied by means of a range of cosolutes with known distinct structural effects. Initial experiments were performed in a 50 mM Arg/Glu buffer that exerts compaction in proteins, thereby increasing their solubility and stability. A decrease in the amount of Arg/Glu to 10 mM induced a reduction in the number of compact conformations, and the addition of TMAO, a well-known stabilizing cosolute, substantially increased the subpopulation of compact conformations. Conversely, addition of 6 M of GdmCl, a destabilizing agent, induced a unimodal distribution that was shifted towards extended conformations. The authors hypothesized that the presence of fluctuating helical elements and the distribution of charged residues preconfigure certain VSV-P60 conformational states to facilitate the recognition event with the nucleoprotein. Interestingly, bimodal Rg distributions have been found in other IDPs.36,43 The question as to whether the presence of structural subpopulations is an IDP strategy to achieve desired biological activities remains open. We anticipate that EOM analysis of SAXS data will become a powerful tool to explore this and other intriguing structural properties of disordered proteins.HMGB1 consists of two tandem HMG-box domains joined by a linker with an acidic C-terminal tail. NMR studies showed that the acidic tail regulates HMGB1-DNA recognition by interacting intramolecularly with the DNA-binding surfaces of both HMG-boxes. On the basis of these studies, which were sensitive mainly to binding events at residue level, it was proposed that HMGB1 is in a dynamic equilibrium between a collapsed tail-bound and an open tail-free state. This scenario has been examined by the combined use of SAXS and NMR for the full-length protein and two deletion mutants lacking various residues of the acidic tail.121 The EOM analysis of a SAXS curve of HMGB1 at 0 mM salt displayed a relatively narrow Rg distribution shifted towards compact structures when compared to the pool of random conformations. The presence of the open conformation was not detected by this analysis, thereby suggesting the predominance of collapsed conformers in solution. Upon the increase of the ionic strength, the Rg distribution became slightly wider as a result of the breakage of some of the anchoring points of the tail, which are mainly of electrostatic nature. Importantly, not fully open conformations were detected in the EOM ensembles. Conversely, deletion mutants, unable to perform intramolecular interactions, displayed Rg distributions that were very similar to the disordered state represented in the pool. The collapsed nature of HMGB1 driven by the acidic tail was validated by NMR relaxation experiments, which yielded a large correlation time for HMGB1 when compared to deletion counterparts, for which the two HMG-boxes showed independent motions. Despite the residue level information provided by NMR, the domain architecture of HMGB1 was achieved only by performing EOM analysis of the SAXS data.
Multiple SAXS curve fitting with EOM
The EOM provides overall structural information of highly flexible proteins. However, the exact regions responsible for conformational restrictions remain elusive. More structural detail can be obtained in an indirect way when data are obtained from deletion mutants of the same system. Indeed, the scattering profiles from several deletion mutants of the full-length protein can be fitted simultaneously with EOM, and the sum of the individual figures of merit drives the optimization.15 In this way, contributions from different chain fragments to the SAXS data can be distinguished to identify the regions responsible for the increase or decrease in protein compactness. Therefore, the SAXS resolution is improved by the addition of multiple experimental curves reporting on the structural features of the encompassing regions. Note that this strategy is valid only when the structural elements of the full-length protein remain intact in the deletion mutants.Mylonas et al. applied the multiple SAXS curve fitting approach with EOM to the structural analysis of tau protein,53 an IDP involved in neuronal microtubule stabilization, and found in abnormal deposits in the brain of patients with Alzheimer's disease. Two tau isoforms were studied, and SAXS data for the full-length and several different deletion mutants for each isoform were used. The EOM unambiguously identified the so-called repeat region as the source of residual secondary structure in tau, in perfect agreement with previous NMR data indicating the presence of turns and extended fragments in this region.103,122 The multiple curve fitting, through the averaged Cα–Cα inter-residue distance matrix, identified a distinct conformational behavior depending on the number of repeats present in the isoforms. For isoform ht23, with three repeats, the maximum separation was found within the repeat domain itself. The ht40 isoform, with four domains, revealed an enhanced separation between the repeat domain and the preceding region. These results suggest that the variation in the number of turns (one per repeat) leads to distinct global arrangements of the chain in that region, thus enhancing or shortening the average interdomain distances expected from a random coil.
Integration of SAXS and NMR into ensemble descriptions of flexible proteins
In recent years considerable effort has been devoted to integrating SAS data into structural biology strategies in order to exploit the synergy between scattering data and other structural biology techniques.123 Especially fruitful has been the integration of SAXS with NMR for the elucidation of the structure of multi-domain proteins124 and biomolecular complexes125,126 by mutually solving the structural degeneracy problem of both sources of information. The integration of SAXS in combination with NMR data into disordered systems has also been addressed in the expectation that the distinct sensitivity of experimental observables to structural features can provide a more precise picture of these fluctuating molecules. The program ENSEMBLE, developed by Forman-Kay's group, derives ensembles of disordered proteins that collectively describe SAXS curves, in addition of several NMR observables: RDCs, J-couplings, chemical shifts (CS), Paramagnetic Relaxation Enhancement (PRE) induced by paramagnetic tags, Nuclear Overhauser effects, hydrodynamic radius, solvent accessibility restraints, hydrogen-exchange protection factors, and 15N R2 relaxation rates.127,128 Some of these parameters are back-calculated from the ensemble and compared with the experimental measurement, whereas others are transformed in structurally relevant parameters such as distances or solvent accessibility surfaces. This approach addresses the intrinsic problem of under-restraining and consequent over-fitting by finding the smallest ensemble that is consistent with all the experimental restraints imposed. ENSEMBLE has recently been applied to structurally characterize the intrinsically disordered protein Sic1 and its hexaphosphorylated version pSic1 by combining several NMR parameters, including CS, PREs, RDCs, and 15N R2, with SAXS data.50 The resulting ensembles confirmed that Sic1 and pSic1 contain significant amounts of secondary and tertiary structure despite their disordered nature. Mainly as a result of the incorporation of SAXS data into the ensemble refinement, it was demonstrated that pSic1 displays a more compact structure than Sic1, which requires conformations sampling Rg values from 10 to 60 Å. The authors attributed the origin of this difference to the high positive net charge in Sic1, which is alleviated in pSic1 upon phosphorylation. A structural model of the complex between pSic1, which contains several binding regions, and its partner Cdc4 was attempted by combining restraints of the free form of pSic1 with sparse NMR data of the complex and the known relative populations of free and bound forms. This model combined with previous results129 suggests a fuzzy complex where binding is not accompanied by folding. The dynamic nature of the complex creates a mean electrostatic field that facilitates the interaction of pSic1 binding sites while maintaining the affinity for the collective properties of the ensemble.The EOM approach provides information about the relative interdomain position in flexible multidomain proteins. However, the orientational configuration is missing because of the low-resolution nature of SAXS data. This limitation can be compensated by the use of NMR parameters such as RDCs and Pseudo-Contact Shifts (PCS), which are sensitive to the relative orientation of the domains. This synergy has recently been used to address the structural disorder of calmodulin, a two-domain flexible protein.130 Three RDC and PCS datasets measured in Tb3+, Tm3+ and Dy3+ loaded in the N-terminal domain of calmodulin demonstrated the presence of extensive interdomain mobility. NMR and SAXS data were integrated using a novel and innovative concept called Maximum Occurrence (MO). MO is defined as the fraction of time the molecule can spend in a given conformation. The MO of each conformation is achieved by computing conformational ensembles with an increasing population of this given confirmation whereas the percentage of the other members is optimized to collectively describe all the experimental data. The MO is set as the population at which the disagreement with experimental data exceeds a predefined threshold. This computationally expensive procedure was applied to 400 conformations belonging to a large pool of 56000 that exhaustively sample the translational and orientational interdomain space (Fig. 8). Representation of the MO for each conformation on a common frame showed the prevalence of extended conformations (35%) while closed and fully extended structures, normally trapped in crystallographic studies, reached only 5% and 15% MO, respectively. In addition, regions with very low MO also appeared in the analysis, thus indicating that a fraction of the interdomain space was not sampled (Fig. 8).
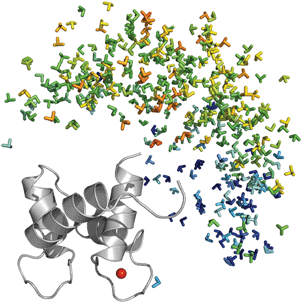 | ||
| Fig. 8 Preferred positions and orientations of the C-terminal domain of calmodulin relative to the N-terminal domain. Frames centered in the center-of-mass of the C-terminal domain of calmodulin, color-coded with respect to the MO of the corresponding conformation from blue (low occupancy < 5%) to red (high occupancy > 40%) for 400 structures generated randomly with Ranch. The MO were obtained by the simultaneous analysis of NMR (RDCs and PCS) and SAXS data. Reprinted with permission from ref. 130. | ||
Ensemble approaches have proven useful to derive precise pictures of the conformational disorder achieved by flexible macromolecules. However, the time-scale at which these motions proceed remains elusive because of the averaged nature of the information coded in a SAXS experiment. NMR relaxation rates can, in principle, provide this missing information as they are sensitive to reorientation phenomena in solution in a time-scale range that extends from hundreds of picoseconds to tens of nanoseconds. However, the application of NMR relaxation rates to flexible proteins is hampered by the coupling between motion of the individual domains and the overall molecular reorientation.131 In a recent study, these two facets of molecular dynamics, namely structural disorder and time-scale of motions, have been embedded in a single structural/dynamic model by combining SAXS with relaxation rates. This combination has been done using the isotropic Reorientational Eigenmode Dynamics (iRED) approach. Through a spherical harmonics normal mode description, iRED provides a framework to interpret relaxation experiments when a reliable description of the protein ensemble is available.132 This combination has been applied to the ribosomal protein L12, a dimeric two-domain protein connected by a 20 amino acid-long linker (Fig. 9A).133 The EOM analysis of the SAXS curve provided information on the three-dimensional space sampled by the C-terminal domains with respect to the dimeric N-terminal one, and indicated that the overall shape of L12 is larger, more anisotropic, and has longer interdomain distances than that expected for a random linker (Fig. 9). Interestingly, this analysis indicated asymmetric behavior of the two linkers, which is hypothesized to be relevant for biological function when the protein is docked on the ribosome (Fig. 9E). The iRED analysis of the EOM ensemble indicated a small degree of motional coupling between the two domains, thereby suggesting a transient structuration of the linker. Additionally, the asymmetric behavior of the linker was manifested in a degeneracy breakage of some motional modes. Correlation times derived when fitting relaxation rates (R1, R2 and het-NOE) to the motional modes ranged between 4.9 and 9 ns, indicating that the entire range of reorientational motions takes place on a rapid time-scale. This study, like previously described examples, demonstrates that complementarity between SAXS and NMR provide structural and dynamic information that is far beyond the sum of the individual techniques.
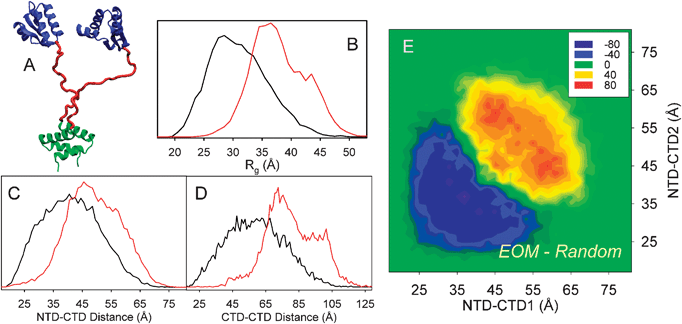 | ||
| Fig. 9 EOM analysis of ribosomal L12 protein. (A) Cartoon of a L12 conformation (1rqu) with the dimerization N-terminal domain (NTD) in green and the C-terminal domain (CTD) in blue, flexible linker is shown in red. (B) Rg distributions from the EOM-selected ensemble (red) and that corresponding to the pool (black). Interdomain distance distributions, NTD-CTD (C) and CTD-CTD (D), from the EOM-selected ensemble (red) and the pool (black). The shift in the distributions of the selected ensemble indicates that L12 behaves as a more extended particle than expected from a random coil linker, and some degree of interdomain correlation is present. (E) Correlation between interdomain NTD-CTD distances in each conformation of the EOM-selected ensemble with respect to those found in the random pool. Positive values indicate overpopulation in the selected ensemble, whereas negative values imply depleted correlations. Peaks outside of the diagonal indicate a strong degree of asymmetry in selected conformations. Adapted with permission from ref. 133. | ||
Conclusions
Flexible molecules like IDPs are difficult to study by high resolution methods. Among the most useful structural techniques is NMR, which provides residue-specific information but it is less sensitive to the overall conformation. SAXS, a rapid method applicable under a broad range of conditions (salinity, pH, temperature, etc) is a natural technique to characterize the low resolution structure of flexible systems. In the past, only average parameters like radius of gyration were extracted from SAXS data, accompanied by qualitative assessment of disorder by Kratky plots. Although useful information was provided by these limited means of analysis, the novel approaches exploring the conformational space of flexible systems and explicitly allowing for co-existence of multiple conformers in solution pave the way for a much more comprehensive use of SAXS. As demonstrated in the above examples, the ensemble optimization approach makes SAXS an effective tool for the characterization of the structure and dynamics of IDPs in solution. Especially useful is the joint application of SAXS with other biophysical techniques such as NMR, CD or FRET, techniques, all of which provide local structural information. These synergistic approaches, embedded in a variety of computational methods, offer more precise and complete pictures of highly disordered proteins. Therefore, combined strategies promise the exploration of emerging structure/function properties of this important but elusive family of biomolecules.List of abbreviations
| SAS | Small-angle scattering |
| SAXS | Small-angle X-ray scattering |
| SANS | Small-angle neutron scattering |
| IDP | Intrinsically disordered protein |
| EOM | Ensemble optimization method |
| NMR | Nuclear magnetic resonance |
| RDC | Residual dipolar coupling |
| GA | Genetic algorithm |
| FM | Flexible-Meccano |
| AUC | Analytical ultracentrifugation |
| DLS | Dynamic light scattering |
| MO | Maximum occurrence |
| CS | Chemical shifts |
| PRE | Paramagnetic relaxation enhancement |
Acknowledgements
The authors thank Yolanda Pérez and Miquel Pons (IRB Barcelona) for providing unpublished data, Giacomo Parigi and Claudio Luchinat (CERM-Florence), and Martin Blackledge (IBS-Grenoble) for providing figures and raw data. Tanya Yates (IRB Barcelona) is acknowledged for reading and correcting the manuscript. Financial support is acknowledged from the Generalitat de Catalunya (2009 SGR-1352) and FP7 contracts (BioNMR-261863 and WeNMR-261572).References
- L. A. Feigin and D. I. Svergun, Structure analysis by small-angle X-ray and neutron scattering, 1987, Plenum Press, New York, pp. 335 Search PubMed.
- D. I. Svergun and M. H. J. Koch, Curr. Opin. Struct. Biol., 2002, 12, 654–660 CrossRef CAS.
- M. V. Petoukhov and D. I. Svergun, Curr. Opin. Struct. Biol., 2007, 17, 562–571 CrossRef CAS.
- C. D. Putnam, M. Hammel, G. L. Hura and J. A. Tainer, Q. Rev. Biophys., 2007, 40, 191–285 CrossRef CAS.
- D. A. Jacques and J. Trewhella, Protein Sci., 2010, 19, 642–567 CrossRef CAS.
- H. D. Mertens and D. I. Svergun, J. Struct. Biol., 2010, 172, 128–141 CrossRef CAS.
- A. R. Round, D. Franke, S. Moritz, R. Huchler, M. Fritsche, D. Malthan, R. Klaering, D. I. Svergun and M. Roessle, J. Appl. Crystallogr., 2008, 41, 913–917 CrossRef CAS.
- G. L. Hura, A. L. Menon, M. Hammel, R. P. Rambo, F. L. Poole, S. E. Tsutakawa, F. E. Jenney, S. Classen, K. A. Frankel, R. C. Hopkins, S. J. Yang, J. W. Scott, B. D. Dillard, M. W. W. Adams and J. A. Tainer, Nat. Methods, 2009, 6, 606–612 CrossRef CAS.
- J. Blobel, P. Bernadó, D. I. Svergun, R. Tauler and M. Pons, J. Am. Chem. Soc., 2009, 131, 4378–4386 CrossRef CAS.
- B. Vestergaard, M. Groenning, M. Roessle, J. S. Kastrup, M. van de Weert, J. M. Flink, S. Frokjaer, M. Gajhede and D. I. Svergun, PLoS Biol., 2007, 5, e134 Search PubMed.
- S. Akiyama, A. Nohara and Y. Maéda, Mol. Cell, 2008, 29, 703–716 CrossRef CAS.
- S. Doniach, Chem. Rev., 2001, 101, 1763–1778 CrossRef CAS.
- L. Pollack and S. Doniach, Methods Enzymol., 2009, 469, 253–268 CAS.
- P. Bernadó, L. Blanchard, P. Timmins, D. Marion, R. W. H. Ruigrok and M. Blackledge, Proc. Natl. Acad. Sci. U. S. A., 2005, 102, 17002–17007 CrossRef.
- P. Bernadó, E. Mylonas, M. V. Petoukhov, M. Blackledge and D. I. Svergun, J. Am. Chem. Soc., 2007, 129, 5656–5664 CrossRef.
- A. E. Whitten and J. Trewhella, Methods Mol. Biol., 2009, 544, 307–323 CAS.
- D. I. Svergun and M. H. J. Koch, Rep. Prog. Phys., 2003, 66, 1735–1782 CrossRef CAS.
- P. V. Konarev, V. V. Volkov, A. V. Sokolova, M. H. J. Koch and D. I. Svergun, J. Appl. Crystallogr., 2003, 36, 1277–1282 CrossRef CAS.
- J. Pérez, P. Vachette, D. Russo, M. Desmandril and D. Durand, J. Mol. Biol., 2001, 308, 721–743 CrossRef.
- S. Ayuso-Tejedor, R. García-Fandiño, M. Orozco, J. Sancho and P. Bernadó, J. Mol. Biol., 2011, 406, 604–619 CrossRef CAS.
- A. Guinier, Ann. Phys. (Paris), 1939, 12, 161–237 CAS.
- P. Calmettes, D. Durand, M. Desmadril, V. Receveur and J. C. Smith, Biophys. Chem., 1994, 53, 105–114 CrossRef CAS.
- P. J. Flory, Principles of polymer chemistry, Cornell University Press, Ithaca, NY, 1953 Search PubMed.
- J. C. LeGuillou and J. Zinn-Justin, Phys. Rev. Lett., 1977, 39, 95–98 CrossRef.
- J. E. Kohn, I. S. Millet, J. Jacob, B. Zagrovic, T. M. Dillon, N. Cingel, R. S. Dothager, S. Seifert, P. Thiyagarajan, T. R. Sosnick, M. Z. Hasan, V. S. Pande, I. Ruczinski, S. Doniach and K. W. Plaxco, Proc. Natl. Acad. Sci. U. S. A., 2004, 101, 12491–12496 CrossRef CAS.
- D. K. Wilkins, S. B. Grimshaw, V. Receveur, C. M. Dobson, J. A. Jones and L. J. Smith, Biochemistry, 1999, 38, 16424–16431 CrossRef CAS.
- M. C. Stumpe and H. Grubmüller, J. Am. Chem. Soc., 2007, 129, 16126–16131 CrossRef CAS.
- S. Meier, S. Grzesiek and M. Blackledge, J. Am. Chem. Soc., 2007, 129, 9799–9807 CrossRef CAS.
- P. Bernadó and M. Blackledge, Biophys. J., 2009, 97, 2839–2845 CrossRef.
- C. Yang, M. J. van der Woerd, U. M. Muthurajan, J. C. Hansen and K. Luger, Nucleic Acids Res., 2011, 39, 4122–4135 CrossRef CAS.
- S. S. Shell, C. D. Putnam and R. D. Kolodner, Mol. Cell, 2007, 26, 565–578 CrossRef CAS.
- G. C. Bressan, J. C. Silva, J. C. Borges, D. O. dos Passos, C. H. I. Ramos, I. L. Torriani and J. Kobarg, J. Proteome Res., 2008, 7, 4465–4474 CrossRef CAS.
- K. M. Nairn, R. E. Lyons, R. J. Mulder, S. T. Mudie, D. J. Cookson, E. Lesieur, M. Kim, D. Lau, F. H. Scholes and C. M. Elvin, Biophys. J., 2008, 95, 3358–3365 CrossRef CAS.
- T. Konno, N. Tanaka, M. Kataoka, E. Takano and M. Maki, Biochim. Biophys. Acta, 1997, 1342, 73–82 CAS.
- A. D. Gazi, M. Bastaki, S. N. Charola, E. A. Gkougkoulia, E. A. Kapellios, N. J. Panapoulos and M. Kokkinidis, J. Biol. Chem., 2008, 283, 34062–34068 CrossRef CAS.
- H. Boze, T. Marlin, D. Durand, J. Pérez, A. Vernhet, F. Canon, P. Sarni-Manchado, V. Cheynier and B. Cabane, Biophys. J., 2010, 99, 656–665 CrossRef CAS.
- J. Li, V. N. Uversky and A. L. Fink, NeuroToxicology, 2002, 23, 553–567 CrossRef CAS.
- S. Longhi, V. Receveur-Brechot, D. Karlin, K. Johansson, H. Darbon, D. Bhella, R. Yeo, S. Finet and B. Canard, J. Biol. Chem., 2003, 278, 18638–18648 CrossRef CAS.
- V. N. Uversky, J. Li, P. Souillac, I. S. Millett, S. Doniach, R. Jakes, M. Goedert and A. L. Fink, J. Biol. Chem., 2002, 277, 11970–11978 CrossRef CAS.
- A. B. Norholm, R. Hendus-Altenburger, G. Bjerre, M. Kjaergaard, S. F. Pedersen and B. B. Kragelund, Biochemistry, 2011, 50, 3469–3480 CrossRef CAS.
- M. Kjaergaard, A. B. Norholm, R. Hendus-Altenburger, S. F. Pedersen, F. M. Poulsen and B. B. Kragelund, Protein Sci., 2010, 19, 1555–1564 CrossRef CAS.
- Z. Lens, F. Dewitte, D. Monté, J. L. Baert, C. Bompart, M. Sénéchal, C. van Lint, Y. de Launoit, V. Villeret and A. Verger, Biochem. Biophys. Res. Commun., 2010, 399, 104–110 CrossRef CAS.
- A. Paz, T. Zeev-Ben-Mordehai, M. Lundqvist, E. Sherman, E. Mylonas, L. Weiner, G. Haran, D. I. Svergun, F. A. A. Mulder, J. L. Sussman and I. Silman, Biophys. J., 2008, 95, 1928–1944 CrossRef CAS.
- P. Gosselin, N. Oulhen, M. Jam, J. Ronzca, P. Cormier, M. Czjzek and B. Cosson, Nucleic Acids Res., 2011, 39, 3496–3503 CrossRef CAS.
- V. N. Uversky, J. R. Gillespie, I. S. Millett, A. V. Khodyakova, A. M. Vasiliev, T. V. Chernovskaya, R. N. Vasilenko, G. D. Kozlovskaya, D. A. Dolgikh, A. L. Fink, S. Doniach and V. M. Abramov, Biochemistry, 1999, 38, 15009–15016 CrossRef CAS.
- D. Johansen, C. M. J. Jeffries, B. Hammouda, J. Trewhella and D. P. Goldenberg, Biophys. J., 2011, 100, 1120–1128 CrossRef CAS.
- M. R. Alborghetti, A. S. Furlan, J. C. Silva, A. F. Paes Leme, I. C. L. Torriani and J. Kobarg, J. Proteome Res., 2010, 9, 4595–4603 CrossRef CAS.
- M. Foucault, K. Mayol, V. Receveur-Brechot, M. C. Bussat, C. Klinguer-Hamour, B. Verrier, A. Beck, R. Haser, P. Gouet and C. Guillon, Proteins: Struct., Funct., Genet., 2010, 78, 1441–1456 CAS.
- M. Wells, H. Tidow, T. J. Rutherford, P. Markwick, M. R. Jensen, E. Mylonas, D. I. Svergun, M. Blackledge and A. R. Fersht, Proc. Natl. Acad. Sci. U. S. A., 2008, 105, 5762–5767 CrossRef CAS.
- T. Mittag, J. Marsh, A. Grishaev, S. Orlicky, F. Sicheri, M. Tyers and J. D. Forman-Kay, Structure, 2010, 18, 494–506 CrossRef CAS.
- K. Moncoq, I. Broutin, C. T. Craescu, P. Vachette, A. Ducruix and D. Durand, Biophys. J., 2004, 87, 4056–4064 CrossRef CAS.
- C. Leyrat, M. R. Jensen, E. A. Ribeiro Jr., F. C. A. Gérard, R. W. H. Ruigrok, M. Blackledge and M. Jamin, Protein Sci., 2011, 20, 542–556 CrossRef CAS.
- E. Mylonas, A. Hascher, P. Bernadó, M. Blackledge, E. Mandelkow and D. I. Svergun, Biochemistry, 2008, 47, 10345–10353 CrossRef CAS.
- A. Shkumatov, S. Chinnathambi, E. Mandelkow and D. I. Svergun, Proteins: Struct., Funct., Genet., 2011, 79, 2122–2131 CrossRef CAS.
- K. Gast, H. Damaschun, K. Eckert, K. Schulze-Forster, H. R. Maurer, M. Müller-Frohne, D. Zirwer, J. Czarnecki and G. Damaschun, Biochemistry, 1995, 34, 13211–13218 CrossRef CAS.
- R. L. Kingston, D. J. Hamel, L. S. Gay, F. W. Dahlquist and B. W. Matthews, Proc. Natl. Acad. Sci. U. S. A., 2004, 101, 8301–8306 CrossRef CAS.
- K. Houben, D. Marion, N. Tarbouriech, R. W. H. Ruigrok and L. Blanchard, J. Virol., 2007, 81, 6807–6816 CrossRef CAS.
- M. R. Jensen, K. Houben, E. Lescop, L. Blanchard, R. W. H. Ruigrok and M. Blackledge, J. Am. Chem. Soc., 2008, 130, 8055–8061 CrossRef CAS.
- M. Fuxreiter, I. Simon, P. Friedrich and P. Tompa, J. Mol. Biol., 2004, 338, 1015–1026 CrossRef CAS.
- K. Sugase, H. J. Dyson and P. E. Wright, Nature, 2007, 447, 1021–1025 CrossRef CAS.
- J. M. R. Baker, R. P. Hudson, V. Kanelis, W.-Y. Choy, P. H. Thibodeau, P. J. Thomas and J. D. Forman-Kay, Nat. Struct. Mol. Biol., 2007, 14, 738–745 CAS.
- M. Nardini, D. Svergun, P. V. Konarev, S. Spano, M. Fasano, C. Bracco, A. Pesce, A. Donadini, C. Cericola, F. Secundo, A. Luini, D. Corda and M. Bolognesi, Protein Sci., 2006, 15, 1042–1050 CrossRef CAS.
- M. Islam and S. J. Perkins, J. Mol. Biol., 2001, 309, 1117–1138 CrossRef.
- C. Q. Schmidt, A. P. Herbert, H. D. T. Mertens, M. Guariento, D. C. Soares, D. Uhrin, A. J. Rowe, D. I. Svergun and P. N. Barlow, J. Mol. Biol., 2010, 395, 105–122 CrossRef CAS.
- H. Tidow, R. Melero, E. Mylonas, S. M. V. Freund, J. G. Grossmann, J. M. Carazo, D. I. Svergun, M. Valle and A. R. Fersht, Proc. Natl. Acad. Sci. U. S. A., 2007, 104, 12324–12329 CrossRef CAS.
- L. M. T. R. Lima, Y. Cordeiro, L. W. Tinoco, A. F. Marques, C. L. P. Oliveira, S. Sampath, R. Kodali, G. Choi, D. Foguel, I. Torriani, B. Caughey and J. L. Silva, Biochemistry, 2006, 45, 9180–9187 CrossRef CAS.
- X. Shi, S. Opi, A. Lugari, A. Restouin, T. Coursindel, I. Parrot, J. Pérez, E. Madore, P. Zimmermann, J. Corbeil, M. Huang, S. T. Arold, Y. Collette and X. Morelli, Biochem. J., 2010, 431, 93–102 CrossRef CAS.
- F. Paoletti, S. Covaceuszach, P. V. Konarev, S. Gonfloni, F. Maleaba, E. Schwarz, D. I. Svergun, A. Cattaneo and D. Lamba, Proteins: Struct., Funct., Genet., 2009, 75, 990–1009 CrossRef CAS.
- A. García-Pino, S. Balasubramanian, L. Wyns, E. Gazit, H. De Greve, R. D. Magnuson, D. Charlier, N. A. J. van Nuland and R. Loris, Cell, 2010, 142, 101–111 CrossRef.
- M. Hammel, Y. Yu, S. Fang, S. P. Lees-Miller and J. A. Tainer, Structure, 2010, 18, 1431–1442 CrossRef CAS.
- H. S. Kim, M. C. J. Wilce, Y. M. K. Yoga, N. R. Pendini, M. J. Gunzburg, N. P. Cowieson, G. M. Wilson, B. R. G. Williams, M. Gorospe and J. A. Wilce, Nucleic Acids Res., 2011, 39, 1117–1130 CrossRef CAS.
- D. I. Pretto, S. Tsutakawa, C. A. Brosey, A. Castillo, M. E. Chagot, J. A. Smith, J. A. Tainer and W. J. Chazin, Biochemistry, 2010, 49, 2880–2889 CrossRef CAS.
- I. Bertini, M. Fragai, C. Luchinat, M. Melikian, E. Mylonas, N. Sarti and D. I. Svergun, J. Biol. Chem., 2009, 284, 12821–12828 CrossRef CAS.
- P. R. Elliott, B. T. Goult, P. M. Kopp, N. Bate, J. G. Grossmann, G. C. K. Roberts, D. R. Critchley and I. L. Barsukov, Structure, 2010, 18, 1289–1299 CrossRef CAS.
- M. R. Jensen, G. Communie, E. A. Ribeiro Jr., N. Martinez, A. Desfosses, L. Salmon, L. Mollica, F. Gabel, M. Jamin, S. Longhi, R. W. H. Ruigrok and M. Blackledge, Proc. Natl. Acad. Sci. U. S. A., 2011, 108, 9839–9844 CrossRef CAS.
- P. Bernadó, Eur. Biophys. J., 2010, 39, 769–780 CrossRef.
- R. A. Edwards, M. S. Lee, S. E. Tsutakawa, R. S. Williams, I. Nacer, F. E. Kleiman, J. A. Tainer and J. N. Glover, Biochemistry, 2008, 47, 11446–11456 CrossRef CAS.
- L. A. Munishkina, A. L. Fink and V. N. Uversky, J. Mol. Biol., 2004, 342, 1305–1324 CrossRef CAS.
- G. He, A. Ramachandran, T. Dahl, S. George, D. Schultz, D. Cookson, A. Veis and A. George, J. Biol. Chem., 2005, 280, 33109–33114 CrossRef CAS.
- A. Binolfi, R. M. Rasia, C. W. Bertoncini, M. Ceolin, M. Zweckstetter, C. Griesinger, T. M. Jovin and C. O. Fernández, J. Am. Chem. Soc., 2006, 128, 9893–9901 CrossRef CAS.
- D.-P. Hong, A. L. Fink and V. N. Uversky, J. Mol. Biol., 2008, 383, 214–223 CrossRef CAS.
- D. C. F. Lanza, J. C. Silva, E. M. Assmann, A. J. C. Quaresma, G. C. Bressan, I. L. Torriani and J. Kobarg, Proteins: Struct., Funct., Genet., 2009, 74, 104–121 CrossRef CAS.
- V. N. Uversky, J. R. Gillespie, I. S. Millett, A. V. Khodyakova, R. N. Vasilenko, A. M. Vasiliev, I. L. Rodionov, G. D. Kozlovskaya, D. A. Dolgikh, A. L. Fink, S. Doniach, E. A. Permyanov and V. M. Abramov, Biochem. Biophys. Res. Commun., 2000, 267, 663–668 CrossRef CAS.
- P. E. Wright and H. J. Dyson, Curr. Opin. Struct. Biol., 2009, 19, 31–38 CrossRef CAS.
- J.-M. Bourhis, V. Receveur-Bréchot, M. Oglesbee, X. Zhang, M. Buccellato, H. Darbon, B. Cannard, S. Finet and S. Longhi, Protein Sci., 2005, 14, 1975–1992 CrossRef CAS.
- C. A. Galea, A. Nourse, Y. Wang, S. G. Sivakolundu, W. T. Heller and R. W. Kriwacki, J. Mol. Biol., 2008, 376, 827–838 CrossRef CAS.
- H.-X. Zhou, Biochemistry, 2004, 43, 2141–2154 CrossRef CAS.
- D. Shortle, FASEB J., 1996, 10, 27–34 CAS.
- A. D. Robertson and K. P. Murphy, Chem. Rev., 1997, 97, 1251–1267 CrossRef CAS.
- P. Bernadó, M. Blackledge and J. Sancho, Biophys. J., 2006, 91, 4536–4543 CrossRef.
- T. Mittag and J. D. Forman-Kay, Curr. Opin. Struct. Biol., 2007, 17, 3–14 CrossRef CAS.
- H. X. Zhou, J. Phys. Chem. B, 2002, 106, 5769–5775 CrossRef CAS.
- D. P. Goldenberg, J. Mol. Biol., 2003, 326, 1615–1633 CrossRef CAS.
- N. C. Fitzkee and G. D. Rose, Proc. Natl. Acad. Sci. U. S. A., 2004, 101, 12497–12502 CrossRef CAS.
- A. K. Jha, A. Colubri, K. F. Freed and T. R. Sosnick, Proc. Natl. Acad. Sci. U. S. A., 2005, 102, 13099–13104 CrossRef CAS.
- H. T. Tran, X. Wang and R. V. Pappu, Biochemistry, 2005, 44, 11396–11380 Search PubMed.
- F. Ding, R. K. Jha and N. V. Dokholyan, Structure, 2005, 13, 1047–1054 CrossRef CAS.
- Z. Wang, K. W. Plaxco and D. E. Makarov, Biopolymers, 2007, 68, 321–328 CrossRef.
- Y. Wang, J. Trewhella and D. P. Goldenberg, J. Mol. Biol., 2008, 377, 1576–1592 CrossRef CAS.
- B. Zagrovic, J. Lipfert, E. J. Sorin, I. S. Millett, W. F. van Gunsteren, S. Doniach and V. S. Pande, Proc. Natl. Acad. Sci. U. S. A., 2005, 102, 11698–11703 CrossRef CAS.
- A.-J. Petrescu, V. Receveur, P. Calmettes, D. Durand, M. Desmandril, B. Roux and J. C. Smith, Biophys. J., 1997, 72, 335–342 CrossRef CAS.
- M. R. Jensen, P. R. Markwick, S. Meier, C. Griesinger, M. Zweckstetter, S. Grzesiek, P. Bernadó and M. Blackledge, Structure, 2009, 17, 1169–1185 CrossRef CAS.
- M. D. Mukrasch, P. Markwick, J. Biernat, M. Bergen, P. Bernadó, C. Griesinger, E. Mandelkow, M. Zweckstetter and M. Blackledge, J. Am. Chem. Soc., 2007, 129, 5235–5243 CrossRef CAS.
- M. D. Mukrasch, S. Bibow, J. Korukattu, S. Jeganathan, J. Biernat, C. Griesinger, E. Mandelkow and M. Zweckstetter, PLoS Biol., 2009, 17, e34 Search PubMed.
- P. Bernadó, C. W. Bertoncini, C. Griesinger, M. Zweckstetter and M. Blackledge, J. Am. Chem. Soc., 2005, 127, 17968–17969 CrossRef.
- L. Salmon, G. Nodet, V. Ozenne, G. Yin, M. R. Jensen, M. Zweckstetter and M. Blackledge, J. Am. Chem. Soc., 2010, 132, 8407–8418 CrossRef CAS.
- F. Chiti and C. M. Dobson, Annu. Rev. Biochem., 2006, 75, 333–366 CrossRef CAS.
- L. Giehm, D. I. Svergun, D. E. Otzen and B. Vestergaard, Proc. Natl. Acad. Sci. U. S. A., 2011, 108, 3246–3251 CrossRef CAS.
- P. Bernadó and M. Blackledge, Nature, 2010, 468, 1046–1048 CrossRef.
- M. Pelikan, G. L. Hura and M. Hammel, Gen. Physiol. Biophys., 2009, 28, 174–189 CrossRef CAS.
- S. Yang, L. Blachowicz, L. Makowski and B. Roux, Proc. Natl. Acad. Sci. U. S. A., 2010, 107, 15757–15762 CrossRef CAS.
- B. Rozycki, Y. C. Kim and G. Hummer, Structure, 2011, 19, 109–116 CrossRef CAS.
- P. Bernadó, Y. Pérez, D. I. Svergun and M. Pons, J. Mol. Biol., 2008, 376, 492–505 CrossRef.
- S. Wang, M. T. Overgaard, Y. X. Hu and D. B. McKay, Biophys. J., 2008, 94, L01–L03 CrossRef CAS.
- I. Bertini, V. Calderone, M. Fragai, R. Jaiswal, C. Luchinat, M. Melikian, E. Mylonas and D. I. Svergun, J. Am. Chem. Soc., 2008, 130, 7011–7021 CrossRef CAS.
- J. VanOudenhove, E. Anderson, S. Krueger and J. L. Cole, J. Mol. Biol., 2009, 387, 910–920 CrossRef CAS.
- A. L. Molinier, M. Nouailler, O. Valette, C. Tardif, V. Receveur-Bréchot and H. P. Fierote, J. Mol. Biol., 2011, 405, 143–157 CrossRef CAS.
- G. Jones, Genetic and evolutionary algorithms. Encyclopedia of computational chemistry, Wiley, Chichester, U.K., 1998 Search PubMed.
- D. I. Svergun, C. Barberato and M. H. J. Koch, J. Appl. Crystallogr., 1995, 28, 768–773 CrossRef CAS.
- C. R. Mosbæk, D. Nolan, E. Persson, D. I. Svergun, J. T. Bukrinsky and B. Vestergaard, Biochemistry, 2010, 49, 9739–9745 CrossRef.
- K. Stott, M. Watson, F. S. Howe, J. G. Grossmann and J. O. Thomas, J. Mol. Biol., 2010, 403, 706–722 CrossRef CAS.
- M. D. Mukrasch, J. Biernat, M. von Bergen, C. Griesinger, E. Mandelkow and M. Zweckstetter, J. Biol. Chem., 2005, 280, 24978–24986 CrossRef CAS.
- P. Bernadó, Wiley Interdiscip. Rev.: Comput. Mol. Sci., 2011, 1, 283–297 CrossRef.
- A. Grishaev, J. Wu, J. Trewhella and A. Bax, J. Am. Chem. Soc., 2005, 127, 16621–16628 CrossRef CAS.
- J. Wang, X. Zuo, I. J. Byeon, J. Jung, X. Wang, M. Dyba, S. Seifert, C. D. Schwieters, J. Quin, A. M. Gronenborn and Y. X. Wang, J. Am. Chem. Soc., 2009, 131, 10507–10515 CrossRef CAS.
- C. D. Schwieters, J. Y. Suh, A. Grishaev, R. Ghirlando, Y. Takayama and G. M. Clore, J. Am. Chem. Soc., 2010, 132, 13026–13045 CrossRef CAS.
- J. A. Marsh, C. Neale, F. E. Jack, W. Y. Choy, A. Y. Lee, K. A. Crowhurst and J. D. Forman-Kay, J. Mol. Biol., 2007, 367, 1494–1510 CrossRef CAS.
- J. A. Marsh and J. D. Forman-Kay, J. Mol. Biol., 2009, 391, 359–374 CrossRef CAS.
- T. Mittag, S. Orlicky, W. Y. Choy, X. Tang, H. Lin, F. Sicheri, L. E. Kay, M. Tyers and J. D. Forman-Kay, Proc. Natl. Acad. Sci. U. S. A., 2008, 105, 17772–17777 CrossRef CAS.
- I. Bertini, A. Gianchetti, C. Luchinat, G. Parigi, M. V. Petoukhov, R. Pieratelli, E. Ravera and D. I. Svergun, J. Am. Chem. Soc., 2010, 132, 13553–13558 CrossRef CAS.
- M. Blackledge, Biophys. J., 2010, 98, 2043–2044 CrossRef CAS.
- J. J. Prompers and R. Brüschweiler, J. Am. Chem. Soc., 2002, 124, 4522–4534 CrossRef CAS.
- P. Bernadó, K. Modig, P. Grela, D. I. Svergun, M. Tchorzewski, M. Pons and M. Akke, Biophys. J., 2010, 98, 2374–2382 CrossRef.
Footnote |
| † Published as part of a Molecular BioSystems themed issue on Intrinsically Disordered Proteins: Guest Editor M. Madan Babu. |
| This journal is © The Royal Society of Chemistry 2012 |