Conformational propensities and residual structures in unfolded peptides and proteins†
Reinhard
Schweitzer-Stenner
*
Department of Chemistry, Drexel University, 3141 Chestnut Street, Philadelphia, PA 19104, USA. E-mail: rschweitzer-stenner@drexel.edu; Fax: 001-215-895-1265; Tel: 001-215-895-2268
First published on 30th August 2011
Abstract
Ample evidence gathered over the last ten years indicates that unfolded and naturally disordered proteins and peptides can show local order in that short segments can adopt turn or polyproline II-like conformations. These findings show that unfolded states cannot be described by the so-called random coil model which assumes that individual amino acid residues sample the entire sterically accessible parts of the Ramachandran with very similar probabilities. This article reviews the experimental evidence for the notion that amino acid residues have different propensities for polyproline II, β-strand, helical and turn conformations in water. These propensities are changed by interactions with nearest neighbours. We show that for a substantial number of residues the conformational propensities in the unfolded state correlate with values for helix propagation and the Chou–Fasman propensities for β-strands. Based on the presented results we hypothesize that the conformational distributions of a representative set of short peptides could be used for predicting structural distributions of disordered peptides and proteins in the future.
 Reinhard Schweitzer-Stenner | Reinhard Schweitzer-Stenner was born in Herne/Germany. He received his diploma (1980) in Physics from the University of Wuppertal, his doctoral degree in Physics from the University of Bremen (1983) and his habilitation from this institution in 1990. He worked as visiting scientist at the Weizmann Institute in Rehovot/Israel (1986) and the University of Michigan in Ann Arbor (1994). In 1999, he became an Associate Professor of Chemistry at the University of Puerto Rico in Río Piedras. In 2003, he joined the faculty of the Chemistry Department at Drexel University in Philadelphia, where he now holds the rank of a professor. |
Introduction
One of the central dogmas of modern biochemistry has been the notion that proteins and peptides have to adopt a stable and ordered structure for performing a biological function. This view has been challenged by the discovery of intrinsically disordered proteins (peptides) (IDPs), which can carry out an enormous spectrum of biological tasks, in spite of having limited or no well defined structures at all.1–8 IDPs play a significant role in molecular recognition by means of so-called molecular recognition features (MoRFs).9 Disordered proteins and peptides are further involved in cell signaling and regulation, cell cycle regulation and gene expression.10 Besides their role in normal biological functions, IDPs also play a role in malicious processes such as the formation of amyloid plaques, the early stage of which is thought to be involved in multiple diseases such as Alzheimers, Huntington, and Parkinson.11–14IDPs and unfolded proteins have in common that their structure is generally described as a random coil polymer. The term ‘random coil’ suggests that in this state all amino acid residues sample the sterically allowed region of the Ramachandran plot randomly.15–17 This scenario is visualized in Fig. 1, which displays a Ramachandran distribution of all amino acid residues with the exception of glycine, proline and residues following a proline in the polypeptide chain.18 This distribution was calculated with a hard sphere model which solely considers repulsive interactions between peptide/protein atoms. The random coil concept entails that the overall conformational distribution of a polypeptide does not significantly depend on its amino acid composition, because individual residues do not exhibit any conformational preference. Moreover, the conformational sampling of a residue is considered as independent of the properties and conformations of nearest neighbors (isolated pair hypothesis).17 A modification of the random coil model, in which many peptide or protein conformations are nearly isoenergetic, is the statistical coil model by Scheraga and coworkers.19–21 It allows energy differences in the RT-range between different conformers. However, this definition is somewhat ambiguous, since it does not define a clear borderline between coil and non-coil behaviour.
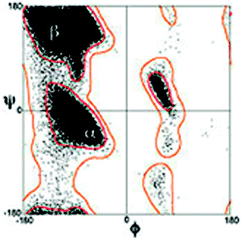 | ||
| Fig. 1 Classical Ramachandran plot distribution of amino acid residues with the exception of glycine and proline. Taken from ref. 18 and modified. | ||
While the random coil model is still considered as a fact in many of today's research papers, its validity has been questioned over the last 10–15 years, based on multiple mostly experimental evidence for the notions (a) that individual amino acids do not sample the entire sterically accessible region of the Ramachandran plot22–33 and (b) that local order exists in unfolded peptides and proteins alike.12,14,34–42 This review focuses on the former finding in that it provides an overview of experimental results which shed some light on the conformations of amino acid residues in unfolded peptides dissolved in aqueous solution. The relevance and significance of obtained conformational propensities for understanding the properties of unfolded peptides and proteins are briefly discussed and an outlook over open questions is given at the end of the article.
Random and statistical coils
As indicated in the introductory section a random coil is basically a statistical coil with negligible Gibbs energy differences between conformations. We therefore focus on the more general statistical coil model in the following. For the sake of clarity, we make the assumption that conformational sampling of unfolded peptides and proteins does not involve any major volume change so that the Gibbs energy can be replaced by the Helmholtz energy F:| F(ϕ,ψ) = U(ϕ,ψ) − TS(ϕ,ψ) | (1) |
 | (2) |
As we will describe in more detail in the subsequent paragraphs ample evidence exists for the necessity to replace the rather broad minimum in the upper left quadrant of the Ramachandran plot by a somewhat more complex (free) energy profile with at least two minima associated with β-strand (βS, −180° ≤ ϕ ≤ 100°) and polyproline II (PPII, −100° < ϕ ≤ −40°) type conformations.22,24,27,32,43–46 The designation ‘polyproline II’ type stems from the fact that trans-poly-L-proline adopts a left handed 31-helix with (ϕ,ψ) = (−70°, 150°).47 Hence, the Ramachandran plot contains three main troughs assignable to PPII, β-strand, and right-handed helical (rh) (Fig. 2). This basic model has to be augmented by additional minima to take into account various β- and γ-turns as well as left-handed helical structures (lh).33
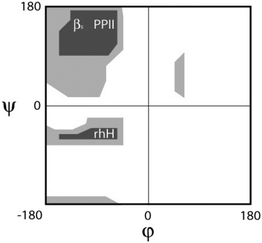 | ||
| Fig. 2 Schematic Ramachandran plot indicating the positions of PPII, β-strand and right handed helical conformations. | ||
For the sake of comparability and clarity, we will use the following definitions for random and statistical coil throughout this paper. We call a conformational distribution of a single residue random coil (rcoil) like, if the total fractions of PPII, β-strand and turn-like conformations (including rh, which can be described as a type III β-turn) do not differ by more than ±10% from the average fraction of the sub-ensemble formed by these three conformations. Hence, a distribution with χPPII = 0.3, χβ = 0.32 and χturn = 0.28 could be described as random coil type. We call the distribution a statistical coil (scoil), if the fraction of none of the PPII-, β-strand, and turn-sub-ensembles is lower than 10% of the total ensemble. A distribution with 30% PPII, 40% β-strand and 10% rh would still fit this criterion, since the smallest fraction (rh) contains still 12% of the total fraction. With these definitions, a random coil is a special case of a statistical coil. If a distribution does not meet the criterion for a statistical coil, we call it partially ordered (po).
Early evidence for partial order in unfolded peptides
Evidence for the notion that the conformational ensemble of unfolded peptides can deviate from a random coil behaviour has been reported by Tiffany and Krimm more than fifty years ago.48 They compared the far UV circular dichroism (CD) spectra of trans-poly-L-proline and fully ionized poly-L-lysine and found them to be very similar, in that they both show an asymmetric, negatively biased couplet with a pronounced negative maximum at lower and a much less intense positive maximum at higher wavelengths (Fig. 3). Since trans-poly-L-proline was known to adopt a PPII conformation, Tiffany and Krimm concluded that the structure of poly-L-lysine exhibits at least local order rather than a random coil. More than thirty years later, vibrational circular dichroism experiments on the very same peptides strongly supported this notion.49 Woody and co-workers provided convincing evidence for the validity of relating the CD couplets in Fig. 3 to PPII rather than to a random coil ensemble.50–52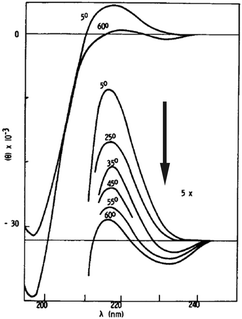 | ||
| Fig. 3 UV-CD spectrum of poly-L-lysine measured as a function of temperature. Taken from ref. 48 and modified. | ||
Are the negatively biased couplets in Fig. 3 indicative of a preponderance of PPII in the unfolded state? This issue is discussed in an earlier review article of Shi et al., who compared the UVCD spectra of various denatured (by urea and guanidine chloride) and thermally unfolded states.23 These spectra have in common that the small positive maximum at 220 nm is either absent or replaced by a negative shoulder (Fig. 4).52 The more intense negative maximum is reduced compared with signal for e.g. poly-L-lysine. This seems to suggest a reduced PPII content. However, the following observations argue against assigning them to a random coil distribution. First, different denatured proteins exhibit CD signals of different intensities, which suggests that conformational sampling depends on the amino acid composition. Second, CD spectra of denatured proteins are temperature dependent, which is at variance with the notion of coexisting iso-energetic states. Interestingly, the spectra of denatured proteins measured at high temperature (>70 °C) and of the respective thermally unfolded proteins become very similar, which indicates that their conformational ensemble becomes indeed random coil like at high temperatures. Shi et al. estimated a PPII content of ca. 30% for denatured proteins at room temperature, while they obtained nearly 0% at high temperatures.23 As we will see below, this is most likely an underestimation. As a matter of fact, a zero fraction for PPII is inconsistent with the random coil and even with the statistical coil model. Altogether, the CD spectra analyzed by Shi et al. are indicative of a statistical coil.
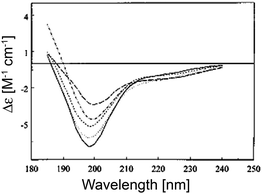 | ||
| Fig. 4 UV-CD spectra of five denatured proteins included in the Exp37 reference protein set. The proteins are: apocytochrome c, 5 °C (short dashes); apocytochrome c, 90 °C (long dashes); staphylococcal nuclease, 6 °C (solid); staphylococcal nuclease, 70 °C (dot dashed); and oxidized. Taken from ref. 52 and modified. | ||
VCD is as suited as CD spectroscopy to distinguish between random coil, statistical coil and partially ordered conformational ensembles. A dominance of PPII causes a pronounced negative couplet at the amide I band position, which reflects rather strong coupling between amide I modes. For a statistical coil the signal is substantially reduced. For a random coil it is nearly absent or very weak.32,33,50,52 In this context it should be remembered that we considered individual residues rather than proteins or peptides for our definition of random and statistical coils. Even if spectroscopic data indicate an overall statistical coil behaviour, this does not exclude the possibility that local segments of the molecule are locally ordered.
Conformational propensity of alanine
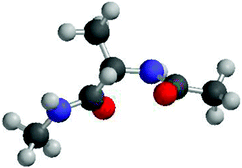
The experiments discussed thus far generally did not deal with individual propensities of amino acids in unfolded peptides and proteins. The CD spectrum of poly-L-lysine and a similar spectrum of poly-L-glutamic acid could be interpreted suggesting that K and E have a high PPII propensity. However, it is unclear whether these peptides' properties result to a substantial extent from the close proximity of charged residues which might prevent individual residues from sampling other conformations.Over the last ten years alanine has been the focus of an intensive debate on whether or not the conformational ensemble sampled by individual alanine residues departs significantly from random coil and even statistical coil behaviour. Three papers initiated this debate. First Han et al. performed a very thorough DFT based computational study on the alanine dipeptide (Adp) in explicit water.53 As shown in Fig. 5, this peptide exhibits a single alanine residue flanked by two peptide groups. Both termini are blocked by methyl groups. Adp is a classical model system which Ramachandran et al.15 as well as Brant and Flory17 used to demonstrate random coil behaviour. However, Han et al. found that a AdP–(H2O)4 complex with water molecules bound to the two carbonyl and amide groups of the peptide linkages prefers to sample PPII and rh type conformations. In the absence of water the energy minimum at PPII disappears. These calculations did not take into account entropic contributions which generally favor β-strand over PPII conformations.54–56 Second, Woutersen and Hamm performed a femtosecond two-dimensional IR-study on trialanine in D2O.28 They determined the strength of the conformationally sensitive excitonic coupling between the amide I modes of the two peptide groups and the angle between their transition dipole moments. By additionally utilising the conformational dependence of the excitonic coupling constant obtained from ab initio Hartree–Fock calculations they determined the dihedral angle of the central residue to be (ϕ,ψ) = (−60°, 140°). This is rather close to the canonical PPII conformation. This led the authors to conclude that this is indeed the dominant conformation adopted by alanine in water. The notion of a single, dominant PPII-like conformation was later supported by NMR-studies on Adp in water and by vibrational spectroscopy studies.57,58 In a third study, Shi et al. reported based on the 3J(HNHα) constants and the UVCD spectrum of a X2A7O2 (XAO-peptide, X: aminobutyric acid, O: ornithine) that the alanine residues in this peptide have a strong preference for PPII (>80%).24 The remaining fraction was assigned to β-strand-like conformations. All these studies indicated that alanine does not exhibit a statistical coil behaviour.
The above results initiated a very controversial debate about the conformational propensity of alanine, which cannot be accounted for in all its detail in this review. The interested reader is referred to an excellent review of Kallenbach and coworkers.25 Here, we confine ourselves on a brief review of the most important aspects and results of this debate.
Scheraga, Vila and their respective associates raised major concerns about the data interpretation that led Shi et al. to conclude a preponderance of PPII in the conformational distribution of XAO.59–61 They argued that the NMR and CD data reported in the paper of Shi et al. could easily be explained with a statistical coil distribution, for which PPII accounts only for 30% of the sampled conformations.59 An even more serious experimental challenge arose from small angle X-ray scattering (SAXS) data which Zagrovic et al. obtained for XAO. The radius of gyration derived from these data was 7.2 Å, which is by far shorter than the 19 Å expected from a 100% PPII structure.62 Makowska et al. showed that the rather compact structure indicated by the small radius of gyration can be reproduced by MD simulations with time-averaged restraints from NMR experiments.61 The results revealed an above average population of multiple β-turn structures, which gives rise to a rather compact structure of the peptide. A compromise emerged from vibrational spectroscopy study of Schweitzer-Stenner and Measey, who showed that a conformational model, which considers turn sampling solely for X2A or AO2 segments of the peptide with the central alanine remaining predominantly PPII can nicely explain the amide I′ profiles of the IR, polarized Raman and vibrational circular dichroism (VCD) spectra, all 3J(HNHα) constants of the alanine residues and the experimental radius of gyration.63 Later, Kallenbach and coworkers provided some more evidence for the notion that the PPII fraction of the alanines in XAO is high.64
The conflicting data and analyses reviewed above indicated the necessity that a more precise and reliable determination of the conformational distribution of alanine was necessary. This has been accomplished recently by two-dimensional NMR spectroscopy, which was later augmented by results from vibrational spectroscopy. Graf et al. measured seven J-coupling constants of An-polypeptides with n = 3–7.65 These seven constants depend differently on the dihedral angles ϕ and ψ. These relationships are describable by empirical Karplus equations. The authors used their NMR-data to restrict the conformational sampling in MD simulations and thus found that all their data could be accounted for only by PPII fractions above 80%. For trialanine, the PPII fraction reaches 90%. Schweitzer-Stenner employed a model describing the conformational ensembles of residues as a superposition of two-dimensional Gaussian functions to simultaneously reproduce for trialanine the J-coupling constant reported by Graf et al.65,66 and the amide I′ band profiles earlier reported by Eker et al (Amide I′ indicates that the peptide was dissolved in D2O).67 The result was practically identical with the PPII fraction reported by Graf et al. In a subsequent paper Hagarman et al. used again both J-coupling constants and amide I′ profiles of the tripeptide GAG to obtain a PPII fraction or 79% for alanine.32 The slightly lower value compared with that of AAA68 indicates that alanine neighbours can stabilise PPII conformations slightly. A three-dimensional plot of the conformational distribution of alanine in GAG is shown in Fig. 6. Recently, Grdadolnik et al. reported a 60% fraction of PPII for alanine in Adp based on an analysis of the amide III region in the respective IR spectrum.69 However, some caution has to be exercised with respect to the significance of distributions obtained for blocked dipeptides. Preliminary experiments in our laboratory indicate that the conformational ensemble of alanine in Adp is substantially different from that found for polyalanines. We attribute this to the certainly limited solvation of the aliphatic terminal CH3-groups (Verbaro, Schweitzer-Stenner, unpublished).
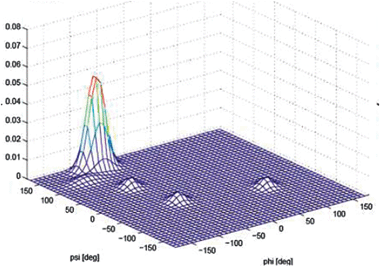 | ||
| Fig. 6 Conformational distribution of alanine in cationic GAG in water obtained from its amide I′ profiles and NMR coupling constants. Taken from ref. 32 and modified. | ||
Several groups have tried to explore the conformational propensity of alanine by molecular dynamics (MD) simulation. Unfortunately, these attempts have remained inconclusive thus far owing to the fact that the obtained results depend heavily on the force field used for the simulation and to some extent also on the choice of the solvent model.70 Most force fields yielded random coil like distributions or a dominant sampling of rh-like conformations.46,62,71–73 As an example, Fig. 7 depicts the Ramachandran plot of a blocked tetra-alanine peptide produced by MD simulation with an AMBER-force field for which the force constants of the main chain torsional angles were obtained from DFT calculations.71 A few exceptions are noteworthy. Gnanakaran and Garcia simulated the structural ensemble of various polyalanines (including trialanine) in explicit water with a modified Amber force field and obtained a rather high PPII propensity.26 The respective fraction of trialanine exceeds 80% at room temperature (Fig. 8). With increasing number of residues the PPII fraction first increases and reaches an optimum for four residues. For longer peptides, the fraction of rh-conformations increases at the expense of PPII. Mu and Stock carried out simulations with a GROMOS force field.43,44 Their results are not indicative of any barrier between PPII and β-strand. Their rather broad trough in the upper left quadrant of the Ramachandran plot was found to account for 80% of the ensemble, whereas ca. 16% of it sampled rh-like conformations. With respect to PPII/β, this would be a perfect random coil, where the entire ensemble is a statistical coil.
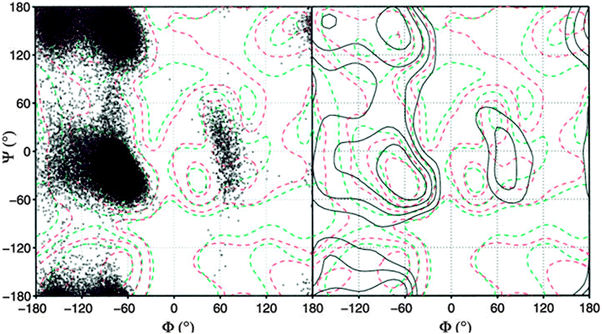 | ||
| Fig. 7 Ramachandran plot of the Ace-(Ala)4–Nme penta-peptide from simulation in TIP3P water. PMFs from statistical analysis of high-resolution X-ray structures are shown in contours (red and green). Here, the distribution obtained from the simulation is shown as both scatters (A) and contours (B). The red dashed contours are A-residues from the high-resolution X-ray protein structures, and the green dashed contours are for all residues except Gly and Pro. Taken from ref. 71 and modified. | ||
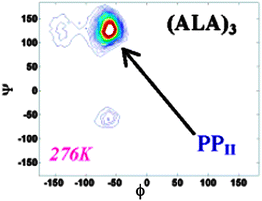 | ||
| Fig. 8 Conformational map of backbone dihedrals of trialanine in water at specified temperatures. The log of the probability is plotted. The three main conformations sampled are marked. Taken from ref. 27 and modified. | ||
Recent modifications of force fields or even new force fields have not really eliminated the gap between the experimentally predicted PPII propensity of alanine and predicted distributions. Best and Hummer used a version of AMBER for which they modified rather than eliminating the functions for the torsional dihedral angles. They found their distributions to be in good agreement with experimentally determined NMRJ-coupling constants for an A5-peptide.46 The obtained distributions suggest a dominant sampling of PPII (ca. 50%), but the populations of rh and β-strand are still significant. Verbaro et al. used their results to simulate the amide I′ band profile of the VCD and IR spectrum of A5W and found that a higher PPII fraction must be assumed to account for their spectroscopic data.74 They also showed that the end to end distance derived from a model describing the above MD distribution is larger than an experimental value determined from fluorescence resonance energy transfer measurements on a Dbo-A5W derivative.
Improvements have been achieved recently by using different models of the aqueous solvent. Nerenberg and Head-Gordon simulated trialanine in explicit water with AMBER ff99SB and ff99SB* force fields and different models for explicit water termed TIP3P and TIP4P-Ew. Simulations with the conventional TIP3P model yielded a statistical coil with 10% rh, 39% β and 48% PPII for a temperature of 275 K. For the newly developed TIP4P-Ew model, the authors obtained a slightly higher PPII fraction, namely 52%, 40% β and 6% rh.70 Very recently, Ishizuka et al. employed an alternative solvent approach to obtain the conformational ensemble of Adp.75 They used a new implicit solvent model based on the extended reference interaction site model to account for peptide–solvent interaction. However, the obtained PPII fraction of 22% is not really close to experimental values.
Taken together the latest experimental results all suggest that alanine has indeed a very high intrinsic propensity for PPII. The results for XAO suggest that its conformational distribution can be modified if the nearest neighbors are charged amino acid residues. MD simulations have still to catch up with the experimental results.
Conformational propensities of other amino acid residues
Experimental data about the conformational distributions of non-alanine residues have only recently emerged. Shi et al. analyzed the 3J(HNHα) of all natural amino acid residues (x) besides glycine and proline in a AcGGxGGNH2 host–guest system in terms of a two-state model of PPII and β-strand conformations.76 Turns and helices were neglected. Conformational sub-ensembles associated with PPII and β-strand were represented by single conformations with ϕ values obtained from relative maxima of coil library distributions. The PPII propensities of the investigated amino acid residues are visualised in Fig. 9. Their results confirm the high PPII propensity of alanine (ca. 82%). With the exception of histidine all residues were found to exhibit a PPII propensity of more than 50%. If this was true it would make PPII the dominant conformation in all unfolded proteins and peptides, which would be in agreement with theoretical predictions by Tran et al.31 Surprisingly, the PPII propensity scale by Shi et al. ranks hydrophobic side chains like valine and tryptophan very high, which is at variance with the results of spectroscopic studies to be discussed below.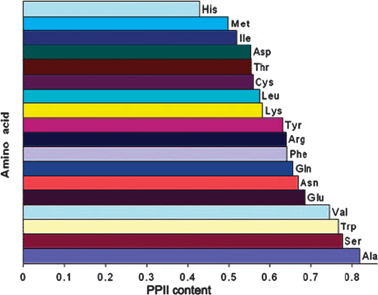 | ||
| Fig. 9 Histogram illustrating the PPII propensity of amino acid residues in AcGGxGGNH2 host–guest systems derived from individual 3J(HNHα) coupling constants. Taken from ref. 76 and modified. | ||
Recently Hagarman et al. undertook a very detailed conformational analysis of amino acid residues in GxG peptides which yielded conformational distributions for the chosen guest residues.32,33 Their results were obtained from a self-consistent analysis of seven J-coupling constants earlier used by Graf et al. for polyalanines and amide I′ band profiles of the respective IR, Raman and VCD spectra.65 The total PPII and β-strand fractions are visualised by the histograms in Fig. 10. With respect to the latter, the authors distinguished between β-strand conformations, which are found in parallel and antiparallel β-sheets. In addition, they followed Tranet al. by separately considering a transition region between parallel β-sheet and PPII (Fig. 11).31 As mentioned before, their results confirm the high PPII propensity of alanine, but it is the only residue with such a high PPII fraction, in contrast to what the propensity scale by Shi et al. suggested.76 The total set of amino acid residues investigated by Hagarman et al. can be subdivided into four categories.32,33Alanine is the sole representative of category I in that it has PPII propensities above 75%. Since the fraction of β-strand like conformers (6%) is less than 10%, this ensemble has to be considered as partially ordered. Category II encompasses all residues with PPII propensities between 50 and 75%. It contains M, L, K, E, and C. They have all in common that they show more balanced contributions from β-strand and PPII like conformations (with β-strand fractions between 26 and 41%). The turn-fractions vary between 0 (M) (this means not detectable) and 20% (L). Hence, most of the distributions of category II are statistical coils with a dominance of extended structures (PPII and β), only the distribution of M should be considered as partially ordered. Category III contains branched aliphatic and aromatic side chains (V,F) with PPII propensities below 50% and a comparatively high β-strand fraction (ca. 40%). Interestingly, these residues exhibit some above average sampling of rh as well as left handed helical and γ-turn like structures, which add up to 18% (F) and 21% (V) of the total ensemble. Hence, both ensembles are statistical coils. The fourth category contains S, C, T, N and D. They all have in common that their distribution contains more than 25% turns. It is likely that these conformations are stabilised by hydrogen bonding between the side chain and an amide proton. Aspartic acid stands out in that the total fraction of turns exceeds 50%. All these ensembles should be considered statistical coils, though with very different compositions.
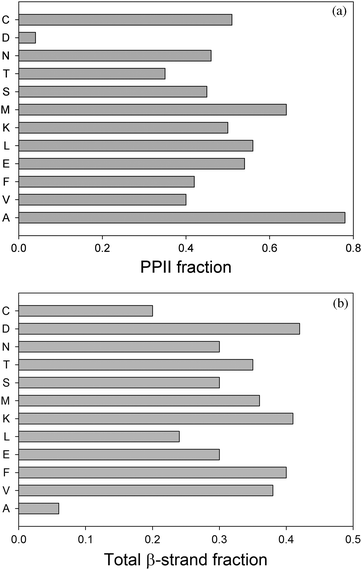 | ||
| Fig. 10 Histogram illustrating the PPII (upper panel) and β-strand propensities (lower panel) of amino acid residues in GxG host–guest systems derived from amide I′ band and individual J-coupling constants. The data were taken from ref. 32 and 33. | ||
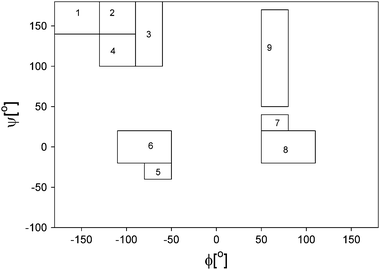 | ||
| Fig. 11 Representative Ramachandran representation of the mesostates considered for simulating amide I′ band profile and NMR coupling constants. These states are described in detail in the Data Analysis section. The Arabic numbers represent the following conformations: aβ (1), aβt (2), PPII (3), pβ(4), type I β-turn, i + 1 residue and type III β turn (right handed helical) (5), type I and II β-turns, i + 2 residue, corner residues of type IV β-turn (6), i + 1 residue of type I′ β-turn (7), type I′ and II′ β-turns, i + 2 residue (8), inverse γ-turn (9) and classical γ-turn (10). Taken with permission from ref. 33. | ||
Another more recent experimental study on conformational propensities of amino acids in water deserves to be mentioned here. Grdadolnik et al.69 investigated 19 amino acid dipeptides in water. They identified PPII, β-strand and rh fractions from the intensity of different bands in the amide III region of these peptides IR and Raman spectra. As indicated above, their PPII value for alanine is lower than those reported by Hagarman et al.32 and Graf et al.,65 but with the exception of Ddp the respective PPII-fractions are not too different from each other. However, the β-strand fractions reported by Grdadolnik et al. are generally larger than the respective values reported by Hagarman et al. There are different explanations for this discrepancy. First, dipeptides might behave differently from tripeptides because the nearest neighbours of the central residue should show a different solvation structure. Second, Grdadolnik et al. did not discriminate between different types of β-strand conformations,69 which Hagarman et al. found pivotal for reproducing the amide I′ VCD signal and the J-coupling constants of GxG peptides.32 Third, Gradadolnik et al. did not take into account the possibility that individual residues can adopt conformations observable in β- and γ-turns.33
Very limited data are currently available which shed light on the influence of nearest neighbours on the conformational propensities of amino acid residues. Pizzanelli et al. combined NMR data, MD simulation and vibrational spectroscopy to compare GFG and AFA.77 Interestingly they found that alanine as neighbour increases the PPII propensity of phenylalanine thus moving it into category II. For trivaline, Graf et al. and Schweitzer-Stenner obtained a much higher β-strand propensity than for valine in GVG.65,66 The respective differences between mole fractions correspond to a Helmholtz energy difference of ca. 1.2 kJ mol−1.
Some theoretical studies have been performed to elucidate the conformational propensity of amino acids and their dependence on the nearest neighbour. Tran et al. used Monte-Carlo simulations to study the propensity of all 20 amino acids and their context dependencies.31 With respect to PPII, they obtained very similar propensity values between 0.4 and 0.5 (these numbers are the sum of what Tranet al. called PII and Phyp). Leucine again departs from this pattern in that the authors found its distribution dominated by a conformational sub-ensemble located in the transition region between PPII and the antiparallel β-strand coordinate (Fig. 11). This agrees well with the results which Hagarman et al. obtained for GLG. They found 24% of the total ensemble in a region, which heavily overlaps with the PII/Phyp™a® transition region by Tran et al.32 Interestingly, Tranet al. obtained a substantial population for V in this region,31 which also agrees with Hagarman et al.32 With the exception of leucine, the simulations by Tran et al. overestimate the helical propensities, mostly at the expense of the β-strand content, which is underestimated. The study did not identify any special propensities for turn structures. Overall, the results reported by Tran et al. are closer to the experimental data than most MD studies. The distributions obtained from our studies can mostly be considered as statistical coils.
Recently, Beck et al. used a novel program termed ENCAD to perform MD simulations aimed at exploring the conformational distributions of all twenty amino acid residues in a GGXGG host–guest system.73 Their results suggest random coil distributions for all residues, generally associated with a very low PPII content even for x = A. Unfortunately, none of their propensity values agree with recently reported experimental data.32,33,69,76 The reported PPII fraction for alanine lies below 0.2 which contradicts the values obtained by practically all experimental studies reported thus far. Verbaro et al. recently demonstrated that these author's distribution for alanine does not even yield the correct sign of the amide I′ VCD couplet A5W.74
Do the obtained conformational propensities have any significance for structural preferences in the folded state of peptides and proteins? In a recent book article, Elamet al. indicated that this is not the case.78 These authors compared the different PPII scales discussed in this paper with a large set of different secondary structure scales derived from protein structures and did not find any significant correlation. We chose a simpler approach which relies less on statistics and more on physical characteristics of parameters, we plotted the helix propagation parameter s derived from the helix ↔ coil transitions of alanine based host–guest systems79versus the PPII propensities obtained by Hagarman et al.32,33 The plot is shown in Fig. 12. If one takes all amino acid residues investigated the correlation is indeed not great. However, if one eliminates the data points for D, C, E and M, one obtains a rather good correlation with r = 0.92. D and C are turn-forming peptides which makes it understandable that their propensities do not correlate with s. The deviations of E and M are more difficult to understand. It should be mentioned that their helical propensity ranks much higher on statistically derived scales. Overall, the plot in Fig. 13 shows that the PPII propensity correlates indeed with propensities for helix propagation.
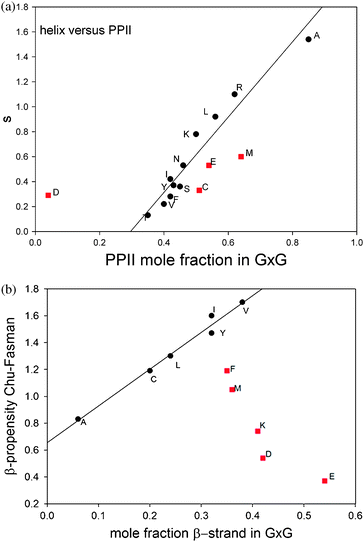 | ||
| Fig. 12 Upper figure: correlation plot of the Zimm–Bragg helix propagation parameter s values of the indicated amino acid residues versus the corresponding molar fraction of PPII79 obtained from a structural analysis of GxG guest–host systems in aqueous solution.32,33 Lower figure: correlation plot of Chou–Fasman β-sheet propensity values80 of the indicated amino acid residues versus the corresponding molar fraction of β-strand obtained from a structural analysis of GxG guest–host systems in aqueous solution.32,33 Only the black data points were used for the linear regression depicted as a solid line. | ||
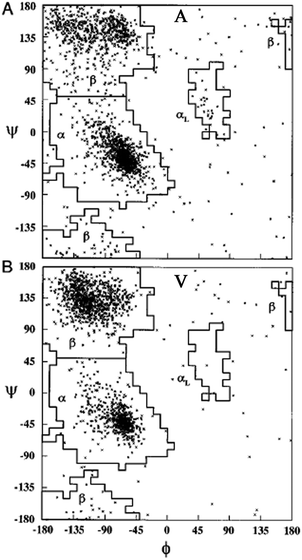 | ||
| Fig. 13 Ramachandran plot for alanine (A) and valine (B). Each point represents one of the 2096 and 1728 entries found for alanine and valine in the coil library of Fiebig et al.,81 respectively. Taken from ref. 81 and modified. | ||
We also investigated the GxG peptides explored by Hagarman et al. for a correlation between β-strand propensities of their guest residues and the β-sheet propensity determined by Chou and Fasman.80 The result is also shown in Fig. 12. The number of amino acid residues for which a good correlation can be obtained is less than that obtained for the correlation between PPII and s, but it should still be considered as significant. The set of amino acid residues which are not close to the correlation line contains M, F, K, D and E. Three of them (K, D and E) can form hydrogen bonds and salt bridges which could add non-local contributions to their β-sheet propensities which are of course not reflected in their β-strand propensities. It is remarkable that methionine lies again below the correlation line. The deviation obtained for phenylalanine is somewhat surprising since this is a classical candidate for β-sheet formation. However, its propensity could be in part due to its involvement in ππ-stacking. It should be noted that the two sets of ‘correlating’ amino acids have five amino acid residues in common, i.e. A, L, Y, I and V. If one tolerates a slightly lower correlation coefficient for PPIIversus s, one could add C to this set. It deserves to be mentioned that the subset formed by M, F, D, E and K in Fig. 12 seems to indicate somewhat of an anti-correlation between intrinsic β-strand propensity and Chou–Fasman propensity scale for β-sheet.
Comparison with coil libraries
An alternative strategy for determining the conformational propensities of amino acids in unfolded peptides and proteins (i.e. in the absence of any non-local interactions) is the analysis of conformational distributions in coil libraries. Generally, researchers have considered two types of coil libraries. The most general choices just incorporate a rather large set of proteins from the protein data bank without any restrictions with respect to their involvement in secondary structures. This strategy was based on the argument that non-local interactions are averaged out if the number of proteins considered is sufficiently large.81 This notion was supported by linear correlations between e.g. the average 3J(HNHα) of amino acids in coil libraries and corresponding values obtained for AcGGxGGNH2 peptides in water. The distributions obtained from these unrestricted coil libraries contain substantial fractions of helical conformations. Fig. 13 depicts the distributions, which Fiebig et al. obtained for alanine and valine.81 They are both reminiscent of a random coil ensemble with little differences between them. They are clearly distinct from what Hagarman et al. observed for GAG and GVG.An different approach has been carried out by Serrano and by Sosnick and coworkers.82–87 Here we focus on the latter because of the wealth of online available data provided by these researchers. They compared distributions obtained from unrestricted coil libraries with those for which regular secondary structures had been omitted and found that this restriction has a substantial influence on the obtained conformational distribution.83 The histograms in Fig. 14 compare the basin preferences (integrated population of PPII, β and rh) in different libraries, i.e. the unrestricted set, a library without helices and sheets, a library without helices, sheets, and turns, and a library without helices, sheets, turns, and terminal, pre-proline, and most exposed residues. The differences between the respective distribution are clearly apparent for alanine. For the unrestricted library, rh is the dominant conformation. The PPII fraction is below 20%. Omitting helices, sheets and turns substantially increases the PPII fraction to 55%; this amount is slightly reduced if residues following prolines are omitted.
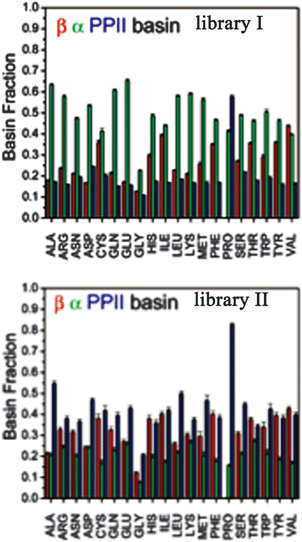 | ||
| Fig. 14 Histogram of basin populations in coil libraries. Upper panel: no restrictions; lower panel: helical, β-strand and turn conformations omitted. Taken from ref. 83 and modified. | ||
Another insight from these coil library studies is noteworthy. A very meticulous analysis showed that the distribution of a given amino acid can be heavily influenced by its nearest neighbors.83,87 This finding, which is in line with the above reported experimental finding for tripeptides, is at variance with the isolated pair hypothesis. This can be visualised by the Ramachandran plots of GAG and DAG retrieved from the online sources which Sosnick and coworkers made available (Fig. 15).86 Apparently, the substitution of glycine by aspartic acid has a clear effect on the distribution of alanine in that it is shifted from predominantly PPII to a distribution which encompasses the rh-basin and the bridge region between rh and PPII.
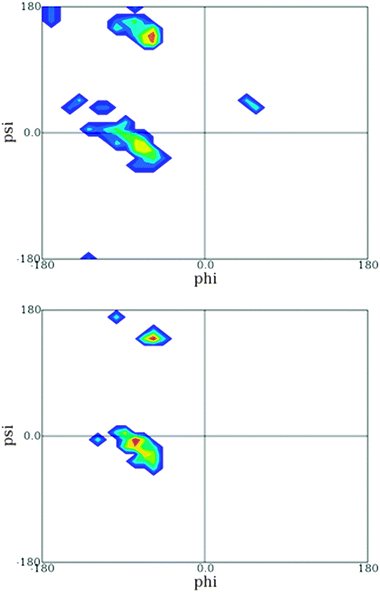 | ||
| Fig. 15 Ramachandran plot of the central leucine residue in GAG (upper figure) and DAG (lower figure) segments derived from the coil library from which residues in helices and sheets have been omitted. The plot was obtained from ref. 86. | ||
Do the distributions obtained from restricted coil libraries represent the behavior of amino acid sequences in solution? They should if one wants to use them for the prediction of the conformational ensembles of unfolded proteins/peptides and IDPs. However, a comparison of the distributions of A and L in GxG obtained by Hagarman et al.32 and from the above restricted coil library (no helices and strands/sheets) reveals differences. For alanine, the coil library distribution exhibits a dominance of PPII, followed by a significant rh-fraction. β-Strand fractions are small. As mentioned before, the distribution by Hagarman et al. shows only traces of rh-type conformations, which they found to be in line with the very low values of this residue's nucleation parameter for helix formation.32 The difference between the experimental and the coil library distribution is much more pronounced for GLG (Fig. 16). The coil library derived plot indicates a rather high propensity for conformations located right above the canonical right-handed helix trough of the classical Ramachandran plot. PPII ranks second and the remaining fractions are in the transition region between PPII and β-strand. The distribution obtained from amide I′ profiles and J-coupling constants contains 58% PPII and 26% of conformations located between PPII and canonical β-strand.32
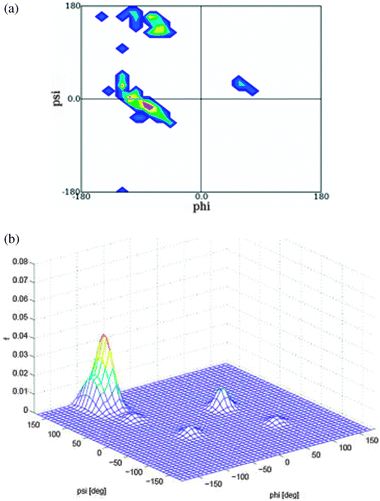 | ||
| Fig. 16 Upper figure: Ramachandran plot of the central leucine residue in GLG segments derived from a coil library from which residues in helices and sheets have been omitted. The plot was obtained from ref. 86. Lower figure: three dimensional distribution plot of the leucine conformational ensemble adopted by GLG in water. Produced based on the results in ref. 32. | ||
One might argue that blocked dipeptides are better model systems than unblocked tripeptides for a comparison with tripeptide segments of coil libraries.88 However, several lines of evidence suggest that the influence of terminal charges on the conformation of the central residue is limited even if the latter carries a charge.32,67 We compared the 3J(HNHα) of GxG and of corresponding dipeptides69 and found them to be rather similar. The average difference between respective coupling constants of 14 amino acid residues is 0.13 Hz. Interestingly, differences are much larger between the 3J(HNHα) constants of GxG and AcGGxGGNH2. For these two sets, one obtains an average difference of 0.34 Hz.
We currently think that the differences between propensities from coil libraries and residues in GxG peptides reflect the fact that not all residues even of restricted coil libraries are always fully solvated and that e.g. loop regions are not conformationally disordered. Their backbone structure is to some extent dictated by the tertiary structure, namely the spatial arrangement of sheets and helices in a protein. Such effects are non-existing in unfolded proteins and IDPs.
Future implications
Can the results reviewed in this article be used to learn more about the unfolded state of much larger peptides and proteins. We believe that the question should be given a positive answer. However, for a valid prediction of the ensemble of unfolded peptides and proteins a complete picture of nearest neighbour interactions must be obtained. We think that this has to be done based on experimental data, namely a representative set of unblocked or blocked GxyzG host–guest peptides in aqueous solution. Here, x, y, z denote amino acid residue variables. Representative amino acids shall be chosen out of the four categories introduced in this article based on conformational studies of GxG peptides.32,33 The Ramachandran plots published by Sosnick and co-workers might provide a guide for deciding the most prominent candidates for nearest neighbour interactions, but it remains to be seen whether coil libraries really reflect the situation in fully solvated peptides in this regard.DeBartolo et al. have developed a strategy which uses amino acid residue trimer conformations from coil libraries as a starting point. Their iterative strategy, which cannot be described in this article, led to a homology-free protein structure prediction.88,89 In their study they have clearly shown that the backbone conformation in the unfolded state really matters. The correlation between secondary structure and unfolded state propensities presented in this paper points in the same direction.
Conformational propensities of amino acid residues can be used to predict conformations of unfolded proteins/peptides and IDPs. A step into this direction has recently been undertaken by Jhaet al., who utilized the propensities obtained from restricted coil libraries to calculate residual dipole coupling values of residues experimentally obtained from NMR measurements.84 Predicting the structural properties of IDPs is particularly important for identifying a section of local order. Basically two types of local orders have been identified in IDPs. Type I encompasses all types of turns (β-turns, γ-turns and most likely also so called asx-turns, which involve hydrogen bonding between side chains and backbone groups).9,40,90 Type II are short segments which adopt a polyproline II (pP2) conformation.9,91,92 In principal one could add a type III to this list, namely short segments in a β-strand conformation. They contain amino acids like valine, phenylalanine and isoleucine which are considered as order promoting and which are therefore underrepresented in IDPs.1 However, short motifs with these amino acids exist in self-aggregating peptides.30,31 The biological relevance of local structures is still a matter of investigation. For example, two mechanisms can be involved in the binding of IDPs to target proteins and corresponding disorder → order transitions. One of these mechanism utilizes the predominance of a local structure of the unbound ligand, whereas in the second mechanism any original structural preferences of the unbound ligand are overridden by ligand–receptor interactions.9 With respect to disorder ↔ order transition of IDPs upon their binding to protein receptors the question arises, whether or not local structure in the disordered state pre-configures the ordered structure.
Acknowledgements
The work from the authors group presented in this paper has been supported by a grant from the National Science Foundation (Chem 0804492). I thank Siobhan Toal for critical reading of the manuscript.Notes and references
- V. N. Uversky, in Unfolded Proteins. From Denatured to Intrinsically Disordered, ed. T. P. Creamer, Nova, Hauppauge, NY, 2008 Search PubMed.
- V. N. Uversky, Eur. J. Biochem., 2002, 269, 2–12 CrossRef CAS.
- V. N. Uversky, C. J. Oldfield and K. A. Dunker, J. Mol. Recognit., 2005, 18, 343–384 CrossRef CAS.
- A. K. Dunker, J. D. Lawson, C. J. Brown, R. M. Williams, P. Romero, J. S. Oh, C. J. Oldfield, A. M. Campen, C. M. Ratliff, K. W. Hipps, J. Ausio, M. S. Nissen, R. Reeves, C. Kang, C. R. Kissinger, R. W. Bailey, M. D. Griswold, W. Chiu, E. C. Garner and Z. Obradovic, J. Mol. Graphics Modell., 2001, 19, 26–59 CrossRef CAS.
- A. K. Dunker, M. S. Cortese, P. Romero, I. M. Iakoucheva and V. N. Uversky, FEBS J., 2005, 272, 5129–5148 CrossRef CAS.
- K. A. Dunker and Z. Obradovic, Nat. Biotechnol., 2001, 19, 805–806 CrossRef.
- X. Li, P. Romero, M. Rani, A. K. Dunker and Z. Obradovic, Genome Inf., 1999, 10, 30 CAS.
- P. Romero, Z. Obradovic, X. Li, E. C. Garner, C. J. Brown and A. K. Dunker, Proteins: Struct., Funct., Genet., 2001, 42, 38–48 CrossRef CAS.
- A. Mohan, C. J. Oldfield, P. Radivojac, V. Vacic, M. S. Cortese, A. K. Dunker and V. N. Uversky, J. Mol. Biol., 2006, 362, 1043–1059 CrossRef CAS.
- J. Liu and B. Rost, Protein Sci., 2001, 10, 1970–1979 CrossRef CAS.
- C. M. Dobson, Trends Biochem. Sci., 1999, 24, 329–332 CrossRef CAS.
- P. Bernado, C. W. Bertoncini, C. Griesinger, M. Zweckstetter and M. Blackledge, J. Am. Chem. Soc., 2005, 127, 17968–17969 CrossRef CAS.
- K. Toriumi, Y. Oma, Y. Kino, E. Futai, N. Sasagawa and S. Ishiura, J. Neurosci. Res., 2008, 86, 1529–1537 CrossRef CAS.
- M. D. Mukrasch, P. Markwick, J. Biernat, M. von Bergen, P. Bernado, C. Greisinger, E. Mandelkow, M. Zweckstetter and M. Blackledge, J. Am. Chem. Soc., 2007, 129, 5235–5243 CrossRef CAS.
- G. N. Ramachandran, C. Ramachandran and V. Sasisekharan, J. Mol. Biol., 1963, 7, 95–99 CrossRef CAS.
- D. A. Brant and P. J. J. Flory, J. Am. Chem. Soc., 1965, 87, 2791–2800 CrossRef CAS.
- P. J. Flory, Statistical Mechanics of Chain Molecules, Wiley & Sons, New York, 1969 Search PubMed.
- B. K. Ho, A. Thomas and R. Brasseur, Protein Sci., 2003, 12, 2508–2522 CrossRef CAS.
- S. Tanaka and H. A. Scheraga, Macromolecules, 1976, 9, 150–167 Search PubMed.
- S. Tanaka and H. A. Scheraga, Macromolecules, 1976, 9, 142–157 CrossRef CAS.
- S. S. Zimmerman and H. A. Scheraga, Proc. Natl. Acad. Sci. U. S. A., 1977, 74, 4126–4129 CrossRef CAS.
- F. Eker, K. Griebenow, X. Cao, L. Nafie and R. Schweitzer-Stenner, Proc. Natl. Acad. Sci. U. S. A., 2004, 101, 10054–10059 CrossRef CAS.
- Z. Shi, R. W. Woody and N. R. Kallenbach, Adv. Protein Chem., 2002, 62, 163–240 CrossRef CAS.
- Z. Shi, C. A. Olson, G. D. Rose, R. L. Baldwin and N. R. Kallenbach, Proc. Natl. Acad. Sci. U. S. A., 2002, 99, 9190–9195 CrossRef CAS.
- Z. Shi, K. Shen, Z. Liu and N. R. Kallenbach, Chem. Rev., 2006, 106, 1877–1897 CrossRef CAS.
- A. E. Garcia, Polymer, 2004, 120, 885–890 Search PubMed.
- S. Gnanakaran and A. E. Garcia, J. Phys. Chem. B, 2003, 107, 12555–12557 CrossRef CAS.
- S. Woutersen and P. Hamm, J. Phys. Chem. B, 2000, 104, 11316–11320 CrossRef CAS.
- S. Woutersen and P. Hamm, J. Chem. Phys., 2001, 114, 2727–2737 CrossRef CAS.
- S. Woutersen, R. Pfister, P. Hamm, Y. Mu, D. S. Kosov and G. Stock, J. Chem. Phys., 2002, 117, 6833–6840 CrossRef CAS.
- H. T. Tran, X. Wang and R. V. Pappu, Biochemistry, 2005, 44, 11369 CrossRef CAS.
- A. Hagarman, T. J. Measey, D. Mathieu, H. Schwalbe and R. Schweitzer-Stenner, J. Am. Chem. Soc., 2010, 132, 542 CrossRef.
- A. Hagarman, D. Mathieu, S. Toal, T. J. Measey, H. Schwalbe and R. Schweitzer-Stenner, Chem.–Eur. J., 2011, 17, 6789–6797 CrossRef CAS.
- H. J. Dyson and P. E. Wright, Curr. Opin. Struct. Biol., 1993, 3, 60–65 CrossRef CAS.
- H. J. Dyson and P. E. Wright, Adv. Protein Chem., 2002, 62, 311–340 CrossRef CAS.
- P. E. Wright, H. J. Dyson and R. A. Lerner, Biochemistry, 1988, 27, 7167–7175 CrossRef CAS.
- R. W. Kriwacki, L. Hengst, L. Tennant, S. I. Reed and P. E. Wright, Proc. Natl. Acad. Sci. U. S. A., 1996, 123, 6142 Search PubMed.
- K. A. Dill and D. Shortle, Annu. Rev. Biochem., 1991, 60, 795–825 CrossRef CAS.
- S. Ohnishi, A. L. Lee, M. H. Egdell and D. Shortle, Biochemistry, 2004, 43, 4064–4070 CrossRef CAS.
- D. Shortle, Adv. Protein Chem., 2002, 62, 1–23 CrossRef CAS.
- R. Brüschweiler, M. Blackledge and R. R. Ernst, J. Biomol. NMR, 1991, 1, 3 CrossRef.
- S. Meier, S. Grzesiek and M. Blackledge, J. Am. Chem. Soc., 2007, 129, 9799–9807 CrossRef CAS.
- Y. Mu, D. S. Kosov and G. Stock, J. Phys. Chem. B, 2003, 107, 5064 CrossRef CAS.
- Y. Mu and G. Stock, J. Phys. Chem. B, 2002, 106, 5294–5301 CrossRef CAS.
- R. B. Best, N. V. Buchete and G. Hummer, Biophys. J., 2008, 95, L07 CrossRef CAS.
- R. B. Best and G. Hummer, J. Phys. Chem. B, 2009, 113, 9004–9015 CrossRef CAS.
- P. M. Cowan and S. Mc Gavin, Nature, 1955, 176, 501–503 CrossRef CAS.
- M. L. Tiffany and S. Krimm, Biopolymers, 1968, 6, 1767–1770 CrossRef CAS.
- R. Dukor and T. A. Keiderling, Biopolymers, 1991, 31, 1747–1761 CrossRef CAS.
- R. W. Woody, Adv. Biophys. Chem., 1992, 2, 37–79 CAS.
- R. W. Woody, Protein Sci., 2003, 12, 384–388 CrossRef.
- N. Sreerama and R. W. Woody, Protein Sci., 2003, 12, 384–388 CrossRef CAS.
- W.-G. Han, K. J. Jakanen, M. Elstner and S. Suhai, J. Phys. Chem. B, 1998, 102, 2587–2602 CrossRef CAS.
- F. Eker, K. Griebenow and R. Schweitzer-Stenner, J. Am. Chem. Soc., 2003, 125, 8178–8185 CrossRef CAS.
- K.-I. Oh, K.-K. Lee, E. K. Park, D.-G. Yoo, G.-S. Hwang and M. Cho, Chirality, 2010 Search PubMed , in press.
- S. Toal, A. Omidi and R. Schweitzer-Stenner, J. Am. Chem. Soc., 2011, 133, 12728–12739 CrossRef CAS.
- C. D. Poon, E. T. Samulsi, C. F. Weise and J. C. Weisshaar, J. Am. Chem. Soc., 2000, 122, 5612–5613 CrossRef.
- C. F. Weise and J. C. Weisshaar, J. Phys. Chem. B, 2003, 107, 3265–3277 CrossRef CAS.
- J. A. Vila, H. A. Baldoni, D. R. Ripoli, A. Gosh and H. A. Scheraga, Biophys. J., 2004, 86, 731–724 CrossRef CAS.
- J. Makowska, S. Rodziewicz, K. Baginska, M. Makowski, J. A. Vila, A. Liwo, L. Chmurzyňski and H. A. Scheraga, Biophys. J., 2007, 92, 2904–2917 CrossRef CAS.
- J. Makowska, S. Rodziewicz-Motowidlo, K. Baginska, J. A. Vila, A. Liwo, L. Chmurzynski and H. A. Scheraga, Proc. Natl. Acad. Sci. U. S. A., 2006, 103, 1744–1749 CrossRef CAS.
- B. Zagrovic, J. Lipfert, E. J. Sorin, I. S. Millett, W. F. van Gunsteren, S. Doniach and V. S. Pande, Proc. Natl. Acad. Sci. U. S. A., 2005, 102, 11698–11703 CrossRef CAS.
- R. Schweitzer-Stenner and T. Measey, Proc. Natl. Acad. Sci. U. S. A., 2007, 104, 6649–6654 CrossRef CAS.
- K. Chen, Z. Liu, C. Zhou, W. C. Bracken and N. R. Kallenbach, Angew. Chem., Int. Ed., 2007, 46, 9036–9039 CrossRef CAS.
- J. Graf, P. H. Nguyen, G. Stock and H. Schwalbe, J. Am. Chem. Soc., 2007, 129, 1179–1189 CrossRef CAS.
- R. Schweitzer-Stenner, J. Phys. Chem. B, 2009, 113, 2922–2932 CrossRef CAS.
- F. Eker, X. Cao, L. Nafie and R. Schweitzer-Stenner, J. Am. Chem. Soc., 2002, 124, 14330–14341 CrossRef CAS.
- R. Schweitzer-Stenner, J. Phys. Chem. B, 2009, 113, 2922–2932 CrossRef CAS.
- J. Grdadolnik, V. Mohacek-Grosev, R. L. Baldwin and F. Avbelj, Proc. Natl. Acad. Sci. U. S. A., 2011, 108, 1794–1798 CrossRef.
- P. Nerenberg and T. Head-Gordon, J. Chem. Theor. Comput., 2011 Search PubMed , in press.
- Y. Duan, C. Wu, S. Chowdury, M. C. Lee, G. Xiong, W. Zhang, R. Yang, P. Cieplak, R. Luo, T. Lee, J. Caldwell, J. Wang and P. Kollman, J. Comput. Chem., 2003, 24, 1999–2012 CrossRef CAS.
- M. C. Lee and Y. Duan, Proteins: Struct., Funct., Bioinf., 2004, 55, 620 CrossRef CAS.
- D. A. C. Beck, D. O. V. Alonso, D. Inoyama and V. Dagget, Proc. Natl. Acad. Sci. U. S. A., 2008, 105, 12259–12264 CrossRef CAS.
- D. Verbaro, I. Ghosh, W. M. Nau and R. Schweitzer-Stenner, J. Phys. Chem. B, 2010, 114, 17201–17208 CrossRef CAS.
- R. Ishizuka, G. A. Huber and J. A. McCammon, J. Phys. Chem. Lett., 2011, 1, 2279–2283 CrossRef.
- Z. Shi, K. Chen, Z. Liu, A. Ng, W. C. Bracken and N. R. Kallenbach, Proc. Natl. Acad. Sci. U. S. A., 2005, 102, 17964–17968 CrossRef CAS.
- S. Pizzanelli, C. Forte, S. Monti and R. Schweitzer-Stenner, J. Phys. Chem. B, 2008, 112, 1251 CrossRef CAS.
- W. A. Elam, T. P. Schrank and V. J. Hilser, in Proteins and Peptides. Folding, Misfolding and Unfolding, ed. R. Schweitzer-Stenner, Wiley & Sons, Chichester, 2011, in press Search PubMed.
- A. Chakrabartty, T. Kortemme and R. L. Baldwin, Protein Sci., 1994, 3, 843–852 CrossRef CAS.
- P. Y. Chou and G. D. Fasman, Biochemistry, 1974, 13, 211 CrossRef CAS.
- K. M. Fiebig, H. Schwalbe, M. Buck, L. J. Smith and C. M. Dobson, J. Phys. Chem., 1996, 100, 2661–2666 CrossRef CAS.
- L. Serrano, J. Mol. Biol., 1995, 254, 322–333 CrossRef CAS.
- A. K. Jha, A. Colubri, M. H. Zaman, S. Koide, T. R. Sosnick and K. F. Freed, Biochemistry, 2005, 44, 9691–9702 CrossRef CAS.
- A. K. Jha, A. Kolubri, K. F. Freed and T. R. Sosnick, Proc. Natl. Acad. Sci. U. S. A., 2005, 102, 13099–13104 CrossRef CAS.
- Z. S. Shi, K. Chen, Z. G. Liu, T. R. Sosnick and N. R. Kallenbach, Proteins: Struct., Funct., Bioinf., 2006, 63, 312–321 CrossRef CAS.
- T. R. Sosnick, sampling library.
- M. H. Zaman, M.-Y. Shen, R. S. Berry, K. F. Freed and T. R. Sosnick, J. Mol. Biol., 2003, 331, 693–711 CrossRef CAS.
- J. DeBartolo, A. Jha, K. F. Freed and T. R. Sosnick, in Proteins and Peptides. Folding, Misfolding and Unfolding, ed. R. Schweitzer-Stenner, Wiley & Sons, Chichester, 2012, in press Search PubMed.
- J. DeBartolo, A. Colubri, A. K. Jha, J. E. Fitzgerald, K. F. Freed and T. R. Sosnick, Proc. Natl. Acad. Sci. U. S. A., 2009, 106, 3734–3739 CrossRef CAS.
- H. Lee, K. H. Mok, R. Muhandiram, K.-H. Park, J.-E. Suk, D.-H. Kim, J. Chang, K. Y. Choi and K.-H. Han, J. Biol. Chem., 2000, 38, 29426–29432 CrossRef.
- T. S. Jardetzky, J. H. Brown, J. C. Gorga, L. J. Stern, R. G. Urban, J. L. Strominger and D. C. Wiley, Proc. Natl. Acad. Sci. U. S. A., 1996, 93, 734–738 CrossRef CAS.
- T. Mittag and J. Forman-Kay, Curr. Opin. Struct. Biol., 2007, 17, 3–14 CrossRef CAS.
Footnote |
| † Published as part of a Molecular BioSystems themed issue on Intrinsically Disordered Proteins: Guest Editor M. Madan Babu. |
| This journal is © The Royal Society of Chemistry 2012 |

