Continuous microfluidic DNA and protein trapping and concentration by balancing transverse electrokinetic forces†
Mercedes C.
Morales
a,
Hao
Lin
b and
Jeffrey D.
Zahn
*a
aBioMEMS Laboratory, Department of Biomedical Engineering, Rutgers, The State University of New Jersey, 599 Taylor Road, Piscataway, New Jersey 08854, USA. E-mail: jdzahn@rci.rutgers.edu; Fax: +1-732-445-3753; Tel: +1-732-445-4500 x6311
bDepartment of Mechanical & Aerospace Engineering, Rutgers, The State University of New Jersey, 98 Brett Rd, Piscataway, New Jersey 08854, USA. E-mail: hlin@jove.rutgers.edu; Fax: +1-732-445-3124; Tel: +1-732-445-2322
First published on 1st November 2011
Abstract
Sample pre-concentration can be a critical element to improve sensitivity of integrated microchip assays. In this work a converging Y-inlet microfluidic channel with integrated coplanar electrodes was used to investigate transverse DNA and protein migration under uniform direct current (DC) electric fields to assess the ability to concentrate a sample prior to other enzymatic modifications or capillary electrophoretic separations. Employing a pressure-driven flow to perfuse the microchannel, negatively charged samples diluted in low and high ionic strength buffers were co-infused with a receiving buffer of the same ionic strength into a main daughter channel. Experimental results demonstrated that, depending of the buffer selection, different DNA migration and accumulation dynamics were seen. Charged analytes could traverse the channel width and accumulate at the positive bias electrode in a low electroosmotic mobility, high electrophoretic mobility, high ionic strength buffer or migrated towards an equilibrium position within the channel in a high electroosmotic mobility, high electrophoretic mobility, low ionic strength buffer. The various migration behaviours are the result of a balance between the electrophoretic force and a drag force induced by a recirculating electroosmotic flow generated across the channel width due to the bounding walls. Under continuous flow conditions, DNA samples were concentrated several-fold by balancing these transverse electrokinetic forces. The electrokinetic trapping technique presented here is a simple technique which could be expanded to concentrate or separate other analytes as a preconditioning step for downstream processes.
Introduction
The development of microfluidic technologies in recent decades has ushered a paradigm shift in the way chemical and biological analyses can be implemented. For example, significant research efforts have been undertaken to develop miniaturized platforms to purify, amplify, separate and analyze DNA in microchannels, with additional efforts considering other important analytes like proteins, cells, organelles, and bacteria.In microscale devices, sample pre-concentration is an important key step which often must be undertaken to improve the sensitivity of a microchip assay, and along these lines, numerous microfluidic approaches have been investigated for concentrating dilute analytes prior to micro-capillary electrophoretic (μCE) separations in order to increase the signal at the output of the device. In some applications, pre-conditioning of samples is critical to increase an analyte concentration above the detection limit or to improve sample injection reproducibility which can be negatively affected by diffusion, hydrodynamic and electrodynamic broadening, Joule heating, and electromigration dispersion.1
Concentration methods for both DNA and proteins have included using electrophoretic sample stacking techniques including field-amplified sample stacking (FASS), isotachophoresis (ITP), and pH-mediated stacking. FASS is one of the most widely used pre-concentration methods for both DNA and proteins because it is one of the simplest techniques; achieved by preparing the sample solution with conductivity lower than that of a background electrolyte. An abrupt change in conductivity between the sample and background electrolyte from low conductivity to high conductivity causes a rapid reduction of the local electric field which slows the electrophoretic velocity of an analyte as it passes into the high conductivity region, ultimately producing a local accumulation of the analyte at the conductivity interface.2–4 Moreover, FASS has been investigated in combination with μCE injection strategies5 and with the use of porous polymer structures to enable a pressure driven injection scheme while avoiding instabilities due to high-conductivity gradients.6
In ITP, a multi-analyte sample is sandwiched between two electrolytes, termed leading and terminating electrolytes, with faster and slower electrophoretic mobilities than the sample solution, respectively. During voltage application, analytes move forward forming discrete high concentration zones according to their electrophoretic mobilities. After a transient period where the discrete zones are formed, the samples move at constant velocity in the direction of the leader as a fixed concentration profile. ITP has been reported for on-line sample preparation to enrich components with low initial concentrations.7,8 ITP is not commonly used for the separation of nucleic acids, but rather as a pre-concentration step, since DNA free solution mobility is relativity constant over a large range of DNA sizes (>0.4 kb).9
pH-mediated stacking is a method of sample pre-concentration that uses a pH gradient to decelerate and stack samples similar to the FASS approach described previously. A plug containing a sample in a low pH matrix is injected into a microchannel previously filled with a high pH background electrolyte. A steep pH boundary is developed at the front end of the plug where cationic analytes dissolved in the low pH plug are made anionic once they enter the high pH background electrolyte. This effect focuses the analytes at the pH interface by retarding their movement as they migrate to a detection zone.10 This approach cannot only be used as a pre-concentration method but also as an analyte separation technique using differences in isoelectric point.11,12 pH mediated stacking is most applicable to protein solutions due to their widely varying isoelectric points. DNA mobility, on the other hand, is fairly constant over a wide pH range.13
In addition to electrophoretic methods for sample concentration, an additional electrokinetic phenomenon used for sample trapping is dielectrophoresis (DEP). When exposed to a non-homogenous electric field, polarizable particles including cells, proteins and DNA can develop a strong electric dipole moment depending upon the relative polarizability of the particle with respect to the surrounding electrolyte that can be used to move them toward (positive DEP) or away (negative DEP) from areas of high electric fields in order to concentrate or separate them from other particles. Since the dielectrophoretic force is dependent on the square of the field gradient, it often employs alternating current (AC) fields in order to avoid any additional electrophoretic effects, with the polarizability of the particle (positive or negative DEP) being AC frequency dependant. Trapping of DNA has been investigated by using DEP with AC electric fields,14,15 in combination with electrode geometric configurations which create non-uniform fields16,17 as well as with AC electroosmotic flows.18
Additionally, other methods have been explored to capture and concentrate samples using chemical binding through the use of streptavidin-coated magnetic beads,19 photoactivated polycarbonate surfaces20 for DNA concentration, and the utilization of membranes for protein concentration enhancements.21,22
In this work, a continuous-flow DNA and protein concentration method is demonstrated by employing uniform DC electric fields applied across the width of a microchannel. Negatively charged samples are conjunctly infused in a converging Y-inlet with a receiving buffer of the same conductivity into a main daughter channel where coplanar electrodes running axially along the length of the channel are used to apply a transverse electric field. Depending on the buffer selection, the samples could be concentrated by electrophoretic forces at the positive bias electrode or trapped at an equilibrium position within the channel by balancing the electrophoretic (EP) force with a drag force generated by an induced electroosmotic (EO) flow in the opposite direction. To the authors knowledge this is the first report of such trapping and concentration of DNA and protein samples using transverse DC electric fields. Such a technique could have advantages over other electrokinetic preconcentration techniques such as FASS, ITP pH-mediated stacking, and DEP in that it is a simple technique which can be implemented in a continuous flow environment and does not require a conductivity, pH, or field gradient.
Electrokinetic theory
Most surfaces in contact with an electrolyte solution acquire a net charge due to various charging mechanisms.23 As a result, these charged surfaces attract opposite-charge ions (counterions) in the solution while repelling equal-charge ions (co-ions) leading to the formation of an electric double layer (EDL) at the surface. Electrokinetic phenomena is a term applied to four distinct phenomena (electroosmosis, electrophoresis, streaming potential, and sedimentation potential) that arise when the mobile region of the EDL and an external electric field interact with a viscous shear layer near the charged surfaces.24 In this work, two of these phenomena, electrophoresis and electroosmosis, are considered within a confined geometry by the application of a transverse electric field across the width of a microchannel with fluid recirculation due to the bounding walls.Electrophoresis
Electrophoresis is defined as the motion of a charged particle through an electrolyte solution due to an applied external electric field. For a thin diffuse EDL at the particle surface, the velocity due to the electrophoretic effect can be calculated by the Helmholtz-Smoluchowski equation as24 | (1) |
 | (2) |
As noted before, it should stressed that the free solution mobility of larger DNA fragments is independent of the molecule size, so size fractionation can only be produced by physical interaction of DNA within a confining geometry like capillaries, sieving gels or nanostructures.25 Stellwagen et al. measured DNA free solution mobility for various sized DNA fragments in the most commonly used electrophoretic buffers, demonstrating size independence on DNA free solution mobility for fragments lengths greater than 400 bp.9 It has also been shown that the DNA EP mobility decreases with increasing buffer ionic strength and conductivity. Lastly, counterion type can affect DNA mobility, where the DNA mobility is significantly reduced in the presence of high NaCl concentration buffers, such as phosphate-buffered saline (PBS), due to electrostatic shielding of surface charges on DNA phosphodiester backbone.26,27
Electroosmosis
An electroosmotic flow is created by a net migration of ions of the EDL at a solid surface due to the application of a tangential external electric field. This ionic movement is transmitted to the bulk fluid due to viscous forces causing a net fluid flow (slip velocity) relative to the stationary surface.23,24 | (3) |
 | (4) |
When applied axially along a channel and under constant longitudinal electric field, the electroosmotic velocity developed by the bulk flow is equal to the Smoluchowski slip velocity.24 The zeta potential of the wall determines the magnitude of the EO flow. Like the zeta potential of a particle during electrophoresis, the wall zeta potential is affected by ionic strength, counterion type and pH of the solution,28–32 but is also dependant on the surface properties of the wall. The effect of channel material and/or surface modifications to the development of the EDL has been widely investigated to enhance or suppress EO flow.9,33–35
Combined electrophoresis and electroosmosis in confining geometries
As a result of EP and EO phenomena, charged analytes will move at a velocity that depends on both the EP mobility of the analyte and any induced EO flow. The net velocity of a particle is therefore a superposition of the EP velocity and EO velocity due to drag on the particle from the EO flow. In a unidirectional linear flow field the net velocity of a charged particle is| UP = UEP + UEO = (μEP + μEO)E | (5) |
Thus, the velocity of a DNA or protein molecule will be not only affected by its net charge but also by the flow convection due to the EO flow.
If a constant driving electric field is applied across the width of a microchannel, the electroosmotic slip velocity at the top and bottom of the channel is predicted by eqn (3). However, since the channel has bounding walls the bulk flow must recirculate in order to conserve fluid mass similar to the classic lid driven (Couette) cavity flow problem. This recirculation profile is shown schematically in Fig. 1a with the velocity profile as a function of channel depth at the centre of the channel. The net flow rate of the recirculation is zero due to conservation of mass. An uncharged particle (μEP = 0) would follow the streamlines set up by this flow profile.
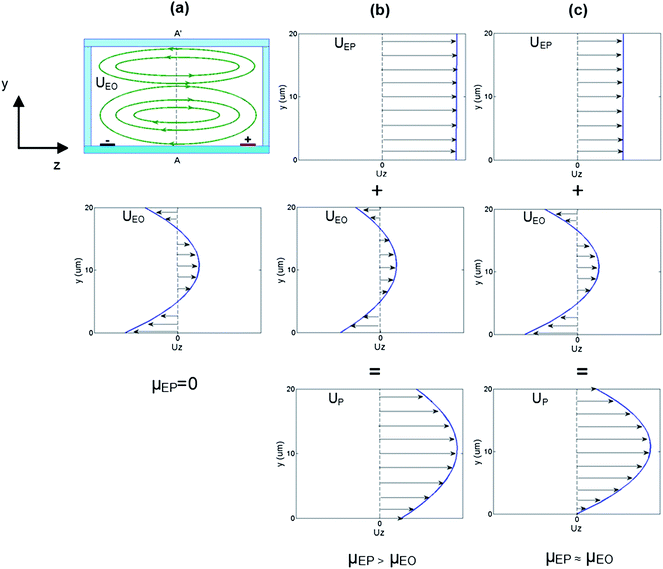 | ||
| Fig. 1 Transverse electroosmotic flow and electrophoresis in closed glass/PDMS microchannels (cross-sectional view). (a) Particles with μEP = 0 will recirculate with the same velocity as the EO flow. The channel centre EO flow profile across A–A′ was calculated by considering the one dimensional Navier–Stokes equation with an imposed conservation of mass condition. The slip velocity at the bottom surface is larger than at the top surface due to the higher zeta potential of glass compared to PDMS. (b) When the EP mobility is greater than the EO mobility, the net particle velocity (UP) is always positive so particles can traverse the channel width ultimately accumulating at the biased electrode. (c) When the particle EP mobility is similar to the EO mobility of the solution the particle velocity (UP) close to the wall is expected to be close to zero. Due to the recirculation profile, it is expected the particles will ultimately migrate to an equilibrium position where the net velocity is zero (either at the wall or in the centre of a vortex). | ||
Such transverse recirculation profiles have previously investigated but for micromixing enhancement between two solutions.36 The flows can be divided into DC electroosmosis (time-independent), where non-uniform zeta potentials are used to induce a change in the surface charge distribution to mix fluids,36–38 and AC electroosmosis (time-dependent), where high frequency (∼1 kHz)39 and low frequency (∼1 Hz)40–42 EO flow recirculation has been studied. In addition, by using spatially patterned electrodes integrated along the length of a microchannel, a helical recirculation path down the length of the channel was produced which promoted mixing of rhodamine B dye using DC fields.43,44
However, if the particle has a significant surface charge, it will feel an additional EP force where the local particle velocity is the superposition of the EP velocity with the EO flow velocity. When the EP mobility is larger than the EO mobility (μEP > μEO) then the particle velocity at the channel centre is estimated to look like Fig. 1b and have a positive magnitude throughout the depth of the channel. In this case, the particle can migrate towards the biased electrode, traverse the channel width, and ultimately collect at the electrode surface.
If the EP mobility and EO mobility are approximately of equal magnitude (μEP ≈ μEO) then the particle velocity at the channel centre will behave as shown in Fig. 1c. In this case, the wall velocity is now expected to be close to zero while the rest of the velocity profile is in the positive direction. Any particle flowing with a net positive velocity (away from the channel top and bottom) will ultimately recirculate around and back across the channel due to the recirculation flow profile set up by the bounding wall. This particle will ultimately migrate to an equilibrium position where the net velocity is zero (either at the wall or in the centre of a vortex), allowing trapping of the particle at this position.
Methods
Module Fabrication
Microchannels were fabricated using the soft lithography technique as described in the literature.45 The master mold was lithographically patterned using SU-8 negative photoresist (MicroChem, Newton, MA) and then cast in polydimethylsiloxane (PDMS) by mixing the elastomer base and curing agent (Sylgard 184 Silicone Elastomer Kit, Dow Corning, Midland, MI) at a ratio of 10![[thin space (1/6-em)]](https://www.rsc.org/images/entities/char_2009.gif) :
:![[thin space (1/6-em)]](https://www.rsc.org/images/entities/char_2009.gif) 1 and poured on top of the master mold. The PDMS was degassed in a vacuum chamber and then cured in an oven at 65 °C for 1 h. The channels were designed as a two inlet, two outlet converging/diverging geometry with a daughter channel 20 μm in depth, 300 μm wide and 5 cm long.
1 and poured on top of the master mold. The PDMS was degassed in a vacuum chamber and then cured in an oven at 65 °C for 1 h. The channels were designed as a two inlet, two outlet converging/diverging geometry with a daughter channel 20 μm in depth, 300 μm wide and 5 cm long.
A pair of co-planar metal electrodes was patterned onto a glass slide using a lift-off technique. First, the slide was lithographically patterned and developed using Microposit S1818 positive photoresist (Microposit, Marlborough, MA, USA). The exposed area on the patterned glass slides were recessed slightly by submerging the slides in 5![[thin space (1/6-em)]](https://www.rsc.org/images/entities/char_2009.gif) :
:![[thin space (1/6-em)]](https://www.rsc.org/images/entities/char_2009.gif) 1 buffered hydrofluoric acid for 1 min. The patterned slides were placed in a metal sputtering system (Kurt Lesker PVD 75, Kurt J. Lesker Company, Pittsburgh, PA) to deposit titanium and platinum resulting in a total electrode thickness of 290 nm. Finally, the photoresist was removed by dissolution in an acetone bath using a sonicator. The parallel electrodes were designed with a centre to centre separation distance of 231 μm and electrode width and length of 45 μm and 5 cm, respectively. An electrical connection was made by depositing CW2400 conductive epoxy (Chemtronics, Kennesaw, GA) onto the terminals of the patterned electrodes and attaching wires connected to an external power supply. The electrode mask also contained a second electrode pair located at the channel entrance and outlet, perpendicular to channel length that can be seen in some of the images provided. They were originally designed to provide a longitudinal electroosmotic flow but were not used in this work
1 buffered hydrofluoric acid for 1 min. The patterned slides were placed in a metal sputtering system (Kurt Lesker PVD 75, Kurt J. Lesker Company, Pittsburgh, PA) to deposit titanium and platinum resulting in a total electrode thickness of 290 nm. Finally, the photoresist was removed by dissolution in an acetone bath using a sonicator. The parallel electrodes were designed with a centre to centre separation distance of 231 μm and electrode width and length of 45 μm and 5 cm, respectively. An electrical connection was made by depositing CW2400 conductive epoxy (Chemtronics, Kennesaw, GA) onto the terminals of the patterned electrodes and attaching wires connected to an external power supply. The electrode mask also contained a second electrode pair located at the channel entrance and outlet, perpendicular to channel length that can be seen in some of the images provided. They were originally designed to provide a longitudinal electroosmotic flow but were not used in this work
The PDMS microchannel structure was then irreversibly bonded to the glass slide containing the electrode pattern by surface activation of the PDMS and glass with oxygen plasma at 100 W, 300 mTorr, for 60 s. After the surface modification, a few drops of methanol were placed on both the glass and PDMS surfaces to provide lubrication during the alignment of the channels and electrodes. The two components were aligned under a microscope and brought into contact to initiate the bonding process. The bonded device was cured at 65 °C for one hour. Fig. 2 shows a schematic of the two device components and a photograph of the assembled device with both electrical and fluid connections.
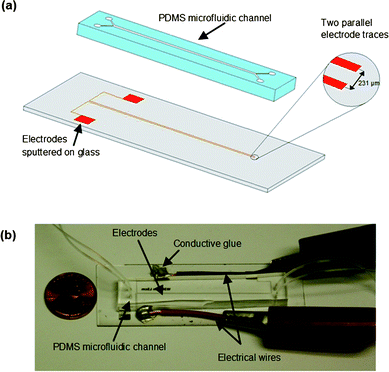 | ||
| Fig. 2 (a) Schematic of the device consisting of two parts: co-planar electrodes patterned on a glass slide and a PDMS microchannel. (b) Photograph of the microchip including fluid and electrical connections. | ||
Buffers and sample preparation
The device was tested with DNA samples of known concentrations diluted in either 1 × TBE buffer (89 mM Tris Base, 89 mM Boric Acid, 2 mM EDTA pH 8.0) (Rockland, ME), 1 × TE buffer (10 mM Tris-HCl, 1 mM EDTA pH 8.0) (Rockland, ME), or 1 × phosphate-buffered saline (PBS) (150 mM NaCl, 8.4 mM Na2HPO4·7H2O 1.8 mM NaH2PO4·H2O pH 7.5) (HyClone, Thermo Scientific, Logan, UT). Lambda phage DNA (48 kbp) and pUC19 vector (2,686 bp) were purchased from New England BioLabs (Beverly, MA) and labelled using a fluorescent YOYO-1 intercalating dye at a ratio of one molecule of dye per five base pairs of DNA (1![[thin space (1/6-em)]](https://www.rsc.org/images/entities/char_2009.gif) :
:![[thin space (1/6-em)]](https://www.rsc.org/images/entities/char_2009.gif) 5), as described in the literature.46 The average molecular weight of a base pair used in stoichiometric calculations was 650 grams/mole-bp. The dye solution was mixed with 4% (v/v) β-mercaptoethanol (Gibco Invitrogen Corporation, Grand Island, NY), which is an oxygen scavenger to protect the DNA-dye complex from degradation due to oxygen free radicals. The dye incubation was prepared at room temperature in the dark, for a minimum of two hours. All DNA samples were prepared at a 0.05 μg μl−1 concentration.
5), as described in the literature.46 The average molecular weight of a base pair used in stoichiometric calculations was 650 grams/mole-bp. The dye solution was mixed with 4% (v/v) β-mercaptoethanol (Gibco Invitrogen Corporation, Grand Island, NY), which is an oxygen scavenger to protect the DNA-dye complex from degradation due to oxygen free radicals. The dye incubation was prepared at room temperature in the dark, for a minimum of two hours. All DNA samples were prepared at a 0.05 μg μl−1 concentration.
Bovine serum albumin (BSA) protein (Omnipur, fraction V; EMD Biosciences) was conjugated with 5-6-carboxy-tetra-methylrhodamine (TAMRA) succinimidyl ester dye (Fluka, Switzerland). The rhodamine fluorescent dye was dissolved in dimethyl sulfoxide (DMSO) (Amresco, Solon, OH) at a concentration of 10 mg ml−1 and added to a 10 mg ml−1 BSA solution at a 10![[thin space (1/6-em)]](https://www.rsc.org/images/entities/char_2009.gif) :
:![[thin space (1/6-em)]](https://www.rsc.org/images/entities/char_2009.gif) 1 M ratio of dye to protein and mixed using a rotary shaker for 30 min at room temperature. The labelled protein solution was then filtered through a PD-10 desalting column (Sephadex G-25M; GE Healthcare) to remove the unconjugated dye from the solution. The output fraction with the labelled proteins was collected and diluted at a 0.25 μg μl−1 concentration in the appropriate buffer solutions.
1 M ratio of dye to protein and mixed using a rotary shaker for 30 min at room temperature. The labelled protein solution was then filtered through a PD-10 desalting column (Sephadex G-25M; GE Healthcare) to remove the unconjugated dye from the solution. The output fraction with the labelled proteins was collected and diluted at a 0.25 μg μl−1 concentration in the appropriate buffer solutions.
Buffer characterization
The conductivity of the different buffers used during the experiments were measured using a digital conductivity meter (Oakton Instruments, Vernon Hills, IL, USA) and the ionic strength was calculated using the expression ,47 where ci is the molar concentration and zi the charge of species i. The zeta potentials for glass/PDMS microchannel walls were found in literature48 for the three different buffers. Table I summarizes the electroosmotic mobilities for the buffers used which were calculated using the corresponding zeta potential. For the buffers used in this work, the free-solution electrophoretic mobility of DNA could only be found for TBE buffer where it was reported as 4.5 × 10⁻⁴ cm2 V−1 s−1.9
Experiment setup and quantification methods
The microfluidic device was connected with 0.254 mm ID Tygon tubing (Small Parts Inc., Miami Lakes, FL) to glass syringes (Hamilton, Reno, NV) and the fluid infusion was made via syringe pumps (PicoPlus 22, Harvard apparatus, Holliston, MA).Since the centre to centre electrode spacing is 231 μm, a relatively large electric field can be generated at low DC voltages (3 VDC or less) in order to avoid solution electrolysis. The electric field was applied as a constant DC field using a DC power supply (Agilent Technologies, model E3631A). A pulsed DC field can also be used to increase the DC field strength while avoiding electrolysis as described in the supplemental material.
In order to visualize the YOYO-1 labelled DNA the fluorescence intensity in the microchannel was observed using a Nikon Eclipse TE2000U inverted microscope (Nikon, Tokyo, Japan) operating in epifluorescence mode with a FITC filter cube (Chroma Technology, Brattleboro, VT) and a charged coupled device (CCD) camera (PowerView 1.4 MP, TSI Incorporated, Shoreview, MN) was used to acquire microscopy images. All images were acquired using a 10 × objective, neutral density filter ND1 for the epifluorescence arc lamp (Nikon, Tokyo, Japan), a 100-ms exposure time at 5 frames per second. The intensity profiles of the images were determined using NIH-ImageJ software (National Institutes of Health). Concentration enhancement was determined by pixel intensity analysis of the acquired epifluorescent images. These images were used to obtain intensity profiles after background elimination. Concentration enhancement was calculated by normalizing the peak fluorescence intensity of the concentrated DNA after field application to the mean intensity of the solution prior to the application of the electric field. Mass conservation was estimated by using the intensity integral of the DNA concentration profile by the sum of the pixel intensity values above a set threshold across the image width.
Results and discussion
Transverse migration of DNA in 1 × TBE
In order to investigate the DNA migration within a transversely applied electric field, initially DNA samples diluted in 1 × TBE buffer were pumped conjunctly with a clean 1 × TBE buffer solution at a fixed flow rate (0.5 μl min−1) into the main channel where a DC voltage was applied across the width of the channelvia the coplanar electrode pair. Fig. 3 shows pUC19 samples at the outlet of the device under different field conditions. When a 1 VDC voltage (Eave = 43.29 V cm−1) was applied (Fig. 3b) no DNA migration was observed and the two infused streams flowed parallel to each other just as when no field was applied (Fig. 3a). When the voltage was increased to 2 VDC (Eave = 86.58 V cm−1), the electrophoretic force was large enough to produce DNA migration toward the positive electrode located at the bottom of the images but the residence time of the DNA in the microchannel was not long enough for the DNA to traverse the entire channel width (Fig. 3c). When the voltage was increased to 3 VDC (Eave = 129.87 V cm−1), the DNA EP velocity was high enough so that the DNA could accumulate at the positive electrode and was convected to the device outlet by the axial pressure-driven flow (Fig. 3d). After turning on the power supply, the DNA would concentrate at the electrode in approximately 15 s.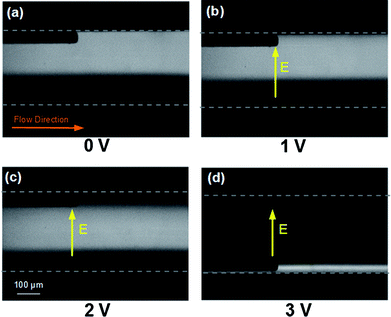 | ||
| Fig. 3 pUC19 electrophoretic migration using 1 × TBE buffer, infused at 0.5 μl min−1 under transverse DC electric fields (bottom-up view). (a) No field applied. (b) 1 VDC applied, DNA does not move transversely. (c) 2 VDC applied, DNA migrates partially across the channel. (d) 3 VDC applied, DNA migrates completely across the channel and accumulates at the positive electrode. The electrodes are spaced 231 μm centre to centre and appear as the dark streaks in the optical path of the inverted epifluorescent microscopy images. | ||
The same experimental conditions were repeated using λ-phage DNA (48 kbp), observing the same electrophoretic movement in opposition to the electric field direction as expected. Intensity profiles for both types of DNA at the outlet of the device as a function of time are shown in Fig. 4. The peak fluorescence intensity of the concentrated DNA increased 4 fold for pUC19 and 2 fold for λ-phage DNA over the infused DNA intensity. The area under the fluorescence intensity curve was also evaluated, comparing the intensity integral between the initial (no field) and final (concentrated) DNA solutions to estimate the total amount of DNA in the images. The concentrated intensity integrals were 169% and 110% compared to the intensity profile without an applied field, for pUC19 and λ-phage DNA respectively. There was no significant difference in the temporal evolution of the DNA trapping at the positive electrode between the short (pUC19) or long (λ-phage) DNA types, agreeing with previously observed results showing a lack of size separation during free flow electrophoresis.25
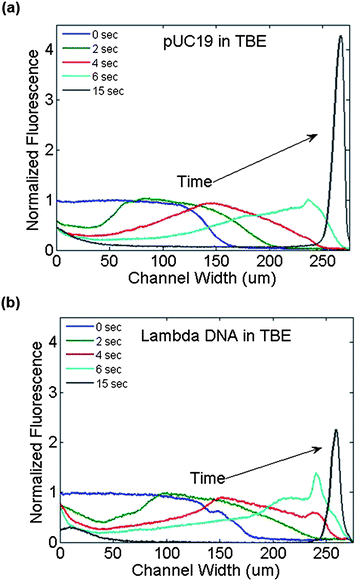 | ||
| Fig. 4 Fluorescence intensity profiles at the channel outlet as a function of time during the application of a transverse electric field (3VDC) across the channel width. (a) pUC19 and (b) λ-phage DNA in 1 × TBE buffer traversed the channel width rapidly from the negative electrode region (left side) to the positive electrode (right side). | ||
Transverse migration of DNA in 1 × TE
Next, the same experimental conditions were repeated except that the solution buffer was changed, replacing the TBE buffer with 1 × TE buffer in both the DNA solution and the receiving buffer. By changing the electrolyte solution to a low ionic strength buffer, the DNA then showed a different migration profile compared to when 1 × TBE was used as a buffer. Fig. 5, shows images of the DNA solution in TE buffer with different applied voltages. As shown in Fig. 5a–c, the lower applied voltages produce very little DNA migration across the channel width. However, when the voltage is raised to 3 VDC (Fig. 5d), the DNA migrates to the centre of the channel where it is trapped and concentrates. It takes the DNA approximately 10 s to migrate to its trapped position following the application of voltage. This is in contrast to Fig. 3d where the DNA migrates completely across the channel to the positive electrode. Fig. 6 compares the temporal intensity profiles for both pUC19 and λ-phage DNA as they migrate to their steady state position in the channel centre, again independent of the DNA size and basepair number. The peak fluorescence intensity of the concentrated DNA increased 2 fold for pUC19 and 3 fold for λ-phage DNA over the infused DNA intensity. Again, the concentrated intensity integrals were 73% and 129% compared to the zero field intensity profile, for pUC19 and λ-phage DNA respectively.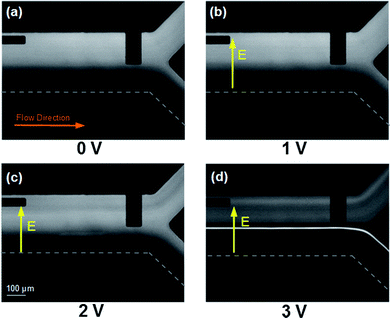 | ||
| Fig. 5 pUC19 electrophoretic migration using 1 × TE buffer, infused at 0.5 μl min−1 under transverse DC electric fields (bottom-up view). (a) No field applied. (b) 1 VDC applied, the electrophoretic force is low and DNA does not move transversely, like when TBE buffer was used. (c) 2 VDC applied, DNA migrated partially towards the channel center. (c) 3 VDC applied, DNA accumulates in the middle of the channel. Due to a lack of contrast with the dark channel background, the bottom electrode cannot be seen in the images but is located at the bottom edge of the channel. | ||
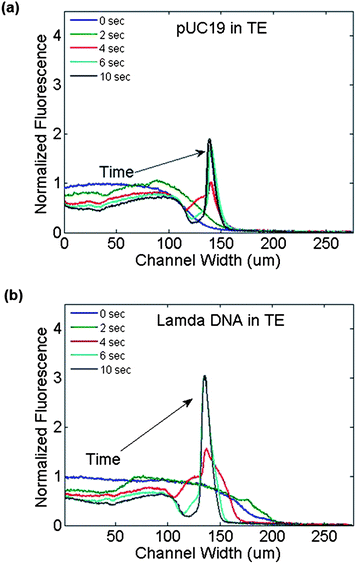 | ||
| Fig. 6 Fluorescence intensity profiles at the channel outlet as a function of time during the application of a transverse electric field (3VDC) across the channel width. (a) pUC19 and (b) λ-phage DNA in 1 × TBE buffer both accumulated at the centre of the channel. | ||
The trapping location and transient behaviour for both experiments using TBE and TE buffers were highly reproducible over multiple (n = 3 for TBE, n = 5 for TE) experiments. In experiments using either TBE or TE buffers, the electrical conductivity across the width of the channel is homogeneous, so the electric field should also be constant across the width of the device so other electrokinetic phenomena like FASS, isotachophoresis or dielectrophoresis are not expected. The absolute concentration enhancement varied between experiments, but based on the fluorescence intensity profile of the DNA after it had concentrated at its equilibrium position in both TBE and TE buffers, the DNA concentration clearly increased several fold over the initial infused concentration.
When analyzing fluorescence intensity profiles, it was found that the concentrated intensity integrals which are predictive of DNA mass were usually within ±30% compared to the zero field intensity profile. Errors in mass quantification are attributed to two main factors, fluorescence quantification and non-specific DNA absorption onto the microchannel surfaces. Since the DNA concentrates to a thin line, the concentrated intensity integrals are only summed over a pixel width of ∼50 pixels which can lead to errors in the integral quantification. Second, due to non-specific absorption of DNA to the channel surfaces DNA could be lost in other areas of the channel or accumulate at the location where the DNA concentrated leading to a larger measured fluorescence intensity. This was particularly apparent when using a low ionic concentration buffer such as TE, where a non-specific background fluorescence intensity can be seen in the top half of the channel even after the DNA was concentrated (Fig. 5d). It was also found that when channels were flushed with buffer following DNA concentration, the area where the DNA was concentrated was still slightly fluorescent indicating non-specific adsorption of the DNA to the channel surface (data not shown).
Transverse migration of protein
In addition to experiments using DNA samples, experiments were conducted to assess the ability to trap and concentrate proteins. When using anionic BSA protein (pI = 4.7), the same trapping behaviour seen when using DNA in both TE and TBE buffers was observed (Fig. 7). When no field is applied, the protein can diffuse partially across the channel width (Fig. 7a). With an applied electric field, when TBE was used as a buffer, the protein migrated completely to the positive electrode (Fig. 7b) but was trapped and concentrated in the channel centre when diluted in TE buffer (Fig. 7c). The intensity profiles are shown in Fig. 7d and appear to be slightly wider than those observed when using DNA.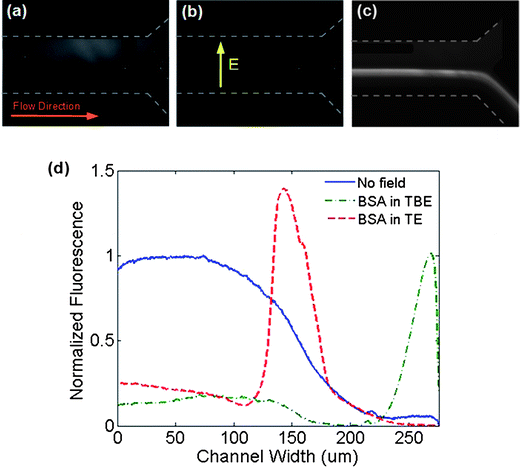 | ||
| Fig. 7 Rhodamine labeled BSA electrophoretic migration using 1 × TBE and 1 × TE buffer, infused at 0.5 μl min−1 under transverse DC electric fields. Bottom-up images of BSA protein when (a) no field was applied, (b) diluted in 1 × TBE buffer being collected at the positive electrode, (c) diluted in 1 × TE buffer, where protein accumulated at the middle of the channel, similar to the observed DNA trapping behavior. (d) Equilibrium fluorescence intensity profiles at the channel outlet across the channel width when no voltage was applied, during the application of 3 VDC for a BSA solution diluted in TBE and in TE buffers. | ||
Effect of EO and EP mobility on DNA migration and concentration
As noted previously, the buffer ionic strength plays an important role in the zeta potential formation. As the ionic strength increases, the double layer becomes compressed resulting in a lower zeta potential and hence lower electroosmotic mobility.30–32 Therefore, the electroosmotic velocity will be faster in low ionic strength buffers like TE buffer and slower in TBE and PBS buffers. The EO mobilities are calculated to be 4.80 × 10⁻⁴, 3.40 × 10⁻⁴ and 1.50 × 10⁻⁴ cm2 V−1 s−1 in TE, TBE and PBS respectively.The free-solution EP mobility of DNA is also buffer dependent, decreasing monotonically as the buffer conductivity and salt concentration increase.26,27 From literature, the DNA electrophoretic mobility in TBE was found to be 4.5 × 10⁻⁴ cm2 V−1 s−1. No report was found regarding DNA mobility in PBS or TE buffer. However, based on the conductivities of these buffers (Table I), the DNA mobility in TE is expected to be slightly higher that the TBE mobility while the DNA mobility in PBS is expected to be much smaller due to the high NaCl salt concentration (137 mM) and electrostatic shielding.26,27
The observed migration behaviour of DNA in different buffers is explained by a balance of EP and EO forces and the effect of the different buffers on the relative EP and EO mobility, as illustrated in Fig. 1. By changing the solution buffer, the EP and EO mobility can be parametrically changed to observe different migration dynamics and equilibrium DNA positions. The effect of varying buffers is shown in Fig. 8. The images were acquired at the device outlet showing pUC19 concentration at different locations along the width of the channel depending on the buffer conditions. When a transverse electric field (3 VDC) and pressure-driven flow (0.5 μl min−1) were applied, different concentration dynamics were observed using three different buffers.
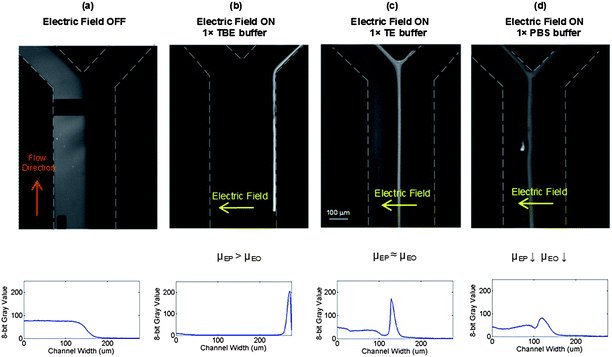 | ||
| Fig. 8 Effect of buffer on pUC19 migration under transverse electric field (3 VDC). (a) No field applied. (b) 1 × TBE buffer: DNA migrated completely across the channel width and accumulated at the positive electrode due to the higher DNA EP mobility than solution EO mobility. (c) 1 × TE buffer: high EP and EO mobility, DNA moved to an equilibrium position at the centre of the channel. (d) 1 × PBS buffer: low EP mobility because of high NaCl salt concentration and low EO mobility due to the high solution ionic strength, DNA moves partially to the middle. The equilibrium fluorescence intensity profiles are shown below each image. | ||
When TBE was used as a buffer, the EP mobility (4.50 × 10⁻⁴ cm2 V−1 s−1) is larger than the EO mobility (3.40 × 10⁻⁴ cm2 V−1 s−1) so the net DNA velocity should be positive everywhere along the depth of the channel as shown in Fig. 1b allowing the DNA to transverse the channel to the positive electrode (Fig. 8b).
When TE was used as a buffer, the EP and EO mobility are approximately equally (∼4.50 × 10⁻⁴versus 4.80 × 10⁻⁴ cm2 V−1 s−1) due to the low ionic strength of the TE buffer, so the migration dynamics are expected to follow those shown in Fig. 1c where there is a zero velocity point (either at the wall or in the centre of the recirculation vortex) which traps the DNA at the centre of the channel (Fig. 8c).
Finally, when PBS was used as a buffer (Fig. 8d) the DNA migrated partially toward the positive electrode while a large portion of the sample remained in the left side of the channel. The fact that the DNA could not transverse the channel is attributed to both a decrease in the EP and EO mobility so that the recirculation vortex is less prominent while the EP force is also reduced slowing the DNA migration across the channel.
Further investigation of migration dynamics
Several experiments were conducted to better understand the dynamics of DNA migration observed in order to rule out other mechanisms such as DEP, axial flow dependence, to enhance the migration, and to observe the recirculation flow profile predicted in Fig. 1a. When an AC field or square wave was applied across the electrodes, DNA migration in the transverse direction was not seen (ESI, Figure S1†), demonstrating that the DNA trapping and concentration seen is a result of the field polarity (electrophoretic forces) and not due to dielectrophoresis. The perfusion flow rate was also varied to observe any influence of the axial parabolic flow on the DNA migration (ESI, Figure S2†). A decrease in the axial velocity allowed the DNA to concentrate closer to the entrance of the channel, since the DNA was being convected forward at a slower velocity, but the transverse location and width of the concentrated DNA plug did not change. The voltage used to promote DNA migration was limited by buffer hydrolysis. At applied voltages larger than 3 VDC, formation of electrolysis bubbles was apparent. Experiments were also conducted using a pulsed DC field which showed identical DNA trapping and concentration at the same channels positions as a continuous DC field (ESI, Figure S3†). There is strong evidence that transverse DC fields in combination with axial fields or pressure driven flows result in a vortical recirculation EO flow profile which follow a helical path down the length of the channel. In order to observe the recirculating flow, fluorescent uncharged melamine and negatively charged polystyrene beads suspended in TE buffer were infused allowing visualization of the recirculation vortex at the device entrance (ESI, video 1†).Conclusions and future work
This work demonstrated, for the first time, that DNA and protein samples could be trapped and concentrated under continuous flow conditions by balancing a DC electrophoretic force with the electroosmotic flow force. Such a mechanism could be used as a pre-concentration method prior to DNA loading into a CE separation column. The trapping behaviour makes this technique suitable for concentration enhancements of dilute solutions to improve detection.Future work will explore the integration of DNA modifying enzymes (restriction endonucleases, ligases, polymerases, etc.) with the receiving buffer for integrated reaction control to explore improving the efficiency of DNA modifications. Additionally, approaches will be taken to suppress the non-specific absorption of DNA and/or protein onto the channel surfaces without modifying the wall zeta potential to allow better DNA concentration quantification. This work will also seek to infuse a low concentration DNA solution below the fluorescence detection limit in order to concentrate the DNA to a level that can be detected viaepifluorescence microscopy. A better understanding of the trapping mechanism will also provide the possibility of controlling concentration enhancement and location across the channel in order to expand this technique to the concentration or separation of other analytes for downstream analysis techniques such as capillary electrophoresis. This will be explored by the development of high fidelity numerical tools which can simulate complex, nonlinear electrokinetic phenomena by coupling electromigration fluxes of all species with the predicted electroosmotic and hydrodynamic flow profiles.
Acknowledgements
This work was supported, in part, by the National Science Foundation (NSF), award number CBET 0721341.Notes and references
- D. Kohlheyer, J. C. T. Eijkel, A. van den Berg and R. B. M. Schasfoort, Electrophoresis, 2008, 29, 977–993 CrossRef CAS.
- R. Bharadwaj and J. G. Santiago, J. Fluid Mech., 2005, 543, 57–92 CrossRef CAS.
- S. Devasenathipathy, R. Bharadwaj and J. Santiago, Exp. Fluids, 2007, 43, 959–967 CrossRef.
- D. S. Burgi and R. L. Chien, Anal. Chem., 1991, 63, 2042–2047 CrossRef CAS.
- M. Gong, K. R. Wehmeyer, P. A. Limbach, F. Arias and W. R. Heineman, Anal. Chem., 2006, 78, 3730–3737 CrossRef CAS.
- B. Jung, R. Bharadwaj and J. G. Santiago, Electrophoresis, 2003, 24, 3476–3483 CrossRef CAS.
- A. Wainright, S. J. Williams, G. Ciambrone, Q. F. Xue, J. Wei and D. Harris, J. Chromatogr., A, 2002, 979, 69–80 CrossRef CAS.
- M. C. Breadmore and J. P. Quirino, Anal. Chem., 2008, 80, 6373–6381 CrossRef CAS.
- C. N. Stellwagen, C. Gelfi and P. G. Righetti, Biopolymers, 1997, 42, 687–703 CrossRef.
- M. R. N. Monton, K. Imami, M. Nakanishi, J.-B. Kim and S. Terabe, J. Chromatogr., A, 2005, 1079, 266–273 CrossRef CAS.
- D. Kohlheyer, G. A. J. Besselink, S. Schlautmann and R. B. M. Schasfoort, Lab Chip, 2006, 6, 374–380 RSC.
- G. J. Sommer and A. V. Hatch, Electrophoresis, 2009, 30, 742–757 CrossRef CAS.
- T. Osafune, H. Nagata and Y. Baba, Anal. Sci., 2004, 20, 971–974 CrossRef CAS.
- C. L. Asbury, A. H. Diercks and G. van den Engh, Electrophoresis, 2002, 23, 2658–2666 CrossRef CAS.
- C. L. Asbury and G. van den Engh, Biophys. J., 1998, 74, 1024–1030 CrossRef CAS.
- L. Wang, L. A. Flanagan, N. L. Jeon, E. Monuki and A. P. Lee, Lab Chip, 2007, 7, 1114–1120 RSC.
- S. Fiedler, S. G. Shirley, T. Schnelle and G.n. Fuhr, Anal. Chem., 1998, 70, 1909–1915 CrossRef CAS.
- J.-R. Du, Y.-J. Juang, J.-T. Wu and H.-H. Wei, Biomicrofluidics, 2008, 2, 044103–044110 CrossRef.
- P. Liu, X. Li, S. A. Greenspoon, J. R. Scherer and R. A. Mathies, Lab Chip, 2011, 11, 1041–1048 RSC.
- M. g. A. Witek, S. D. Llopis, A. Wheatley, R. L. McCarley and S. A. Soper, Nucleic Acids Res., 2006, 34, e74 CrossRef.
- A. V. Hatch, A. E. Herr, D. J. Throckmorton, J. S. Brennan and A. K. Singh, Anal. Chem., 2006, 78, 4976–4984 CrossRef CAS.
- R. S. Foote, J. Khandurina, S. C. Jacobson and J. M. Ramsey, Anal. Chem., 2005, 77, 57–63 CrossRef CAS.
- R. J. Hunter, Foundations of Colloid Science, Oxford University, Oxford, 1987 Search PubMed.
- R. F. Probstein, Physicochemical Hydrodynamics, Wiley, Hoboken, 2003 Search PubMed.
- J. L. Viovy, Rev. Mod. Phys., 2000, 72, 813–872 CrossRef CAS.
- E. Stellwagen and N. C. Stellwagen, Electrophoresis, 2002, 23, 1935–1941 CrossRef CAS.
- E. Stellwagen and N. C. Stellwagen, Biophys. J., 2003, 84, 1855–1866 CrossRef CAS.
- V. Tandon, S. K. Bhagavatula, W. C. Nelson and B. J. Kirby, Electrophoresis, 2008, 29, 1092–1101 CrossRef CAS.
- B. J. Kirby and E. F. Hasselbrink, Electrophoresis, 2004, 25, 187–202 CrossRef CAS.
- W. L. Tseng, M. M. Hsieh, S. J. Wang and H. T. Chang, J. Chromatogr., A, 2000, 894, 219–230 CrossRef CAS.
- A.-M. Spehar, S. Koster, V. Linder, S. Kulmala, N. F. de Rooij, E. Verpoorte, H. Sigrist and W. Thormann, Electrophoresis, 2003, 24, 3674–3678 CrossRef CAS.
- J. Gaudioso and H. G. Craighead, J. Chromatogr., A, 2002, 971, 249–253 CrossRef CAS.
- D. Wu, J. Qin and B. Lin, J. Chromatogr., A, 2008, 1184, 542–559 CrossRef CAS.
- D. Wu, J. Qin and B. Lin, Lab Chip, 2007, 7, 1490–1496 RSC.
- D. Xiao, T. V. Le and M. J. Wirth, Anal. Chem., 2004, 76, 2055–2061 CrossRef CAS.
- C. C. Chang and R. J. Yang, Microfluid. Nanofluid., 2007, 3, 501–525 CrossRef CAS.
- S. Qian and H. H. Bau, Anal. Chem., 2002, 74, 3616–3625 CrossRef CAS.
- A. D. Stroock, M. Weck, D. T. Chiu, W. T. S. Huck, P. J. A. Kenis, R. F. Ismagilov and G. M. Whitesides, Phys. Rev. Lett., 2000, 84, 3314 CrossRef CAS.
- N. Sasaki, T. Kitamori and H.-B. Kim, Lab Chip, 2006, 6, 550–554 RSC.
- I. Glasgow, J. Batton and N. Aubry, Lab Chip, 2004, 4, 558–562 RSC.
- H. Song, Z. Cai, H. Noh and D. J. Bennett, Lab Chip, 2010, 10, 734–740 RSC.
- L.-M. Fu, R.-J. Yang, C.-H. Lin and Y.-S. Chien, Electrophoresis, 2005, 26, 1814–1824 CrossRef CAS.
- N. S. Lynn, C. S. Henry and D. S. Dandy, Microfluid. Nanofluid., 2008, 5, 493–505 CrossRef.
- S. J. Kim, I. S. Kang and B. J. Yoon, Chem. Eng. Commun., 2006, 193, 1075–1089 CrossRef CAS.
- Y. Xia and G. M. Whitesides, Angew. Chem., Int. Ed., 1998, 37, 550–575 CrossRef CAS.
- P. J. Shrewsbury, S. J. Muller and D. Liepmann, Biomed. Microdevices, 2001, 3, 225–238 CrossRef CAS.
- J. N. Butler, Ionic Equilibrium: Solubility and PH Calculations, Wiley, New York, 1998 Search PubMed.
- Z. A. Almutairi, T. Glawdel, C. L. Ren and D. A. Johnson, Microfluid. Nanofluid., 2008, 6, 241–251 CrossRef.
Footnote |
| † Electronic supplementary information (ESI) available: pUC19 under alternative square wave excitation (Fig. S1), flow rate dependence (Fig. S2), pulsed field application (Fig. S3) and vortex visualization using micro beads (Video 1). See DOI: 10.1039/c1lc20605b |
| This journal is © The Royal Society of Chemistry 2012 |
