Molecular dynamics simulations of the interactions of potential foulant molecules and a reverse osmosis membrane
Zak E.
Hughes
* and
Julian D.
Gale
Nanochemistry Research Institute, Department of Chemistry, Curtin University, P.O. Box U1987, Perth, WA 6845, Australia. E-mail: zak@ivec.org
First published on 13th October 2011
Abstract
Reverse osmosis (RO) is increasingly one of the most common technologies for desalination worldwide. However, fouling of the membranes used in the RO process remains one of the main challenges. In order to better understand the molecular basis of fouling the interactions of a fully atomistic model of a polyamide membrane with three different foulant molecules, oxygen gas, glucose and phenol, are investigated using molecular dynamics simulations. In addition to unbiased simulations, umbrella-sampling methods have been used to calculate the free energy profiles of the membrane-foulant interactions. The results show that each of the three foulants interacts with the membrane in a different manner. It is found that a build up of the two organic foulants, glucose and phenol, occurs at the membrane-saline solution, due to the favourable nature of the interaction in this region, and that the presence of these foulants reduces the rate of flow of water molecules over the membrane-solution interface. However, analysis of the hydrogen bonding shows that the origin of attraction of the foulant for the membrane differs. In the case of oxygen gas the simulations show that a build up of gas within the membrane is likely, although no deterioration in the membrane performance was observed.
Introduction
Over the past decade a growing percentage of our drinking water has been obtained from seawater or brackish water that has been desalinated by some means. Moreover, the fact that the population of the world is still growing and the predicted changes to our environment and climate mean that it is likely that in the future even more drinking water will be obtained through desalination.1–4 While thermal desalination processes, such as multi-stage flash (MSF) distillation, are still popular, especially in those areas of the world where energy is cheap,2 most desalination plants being built today remove salt from water using reverse osmosis (RO).1,3,4In RO the saltwater is filtered through a membrane at high pressure, and while the water passes through the membrane a large proportion (95–99%) of the salt ions are unable to. The nature of the membrane plays a major role in determining how efficient the RO process is, both in terms of the level of salt rejection and the flow rate for a given applied pressure. Obviously, the best membranes will combine a high salt rejection rate with a fast flow rate to allow the maximum amount of water to be desalinated in a short time, for the lowest possible input of energy. However, there is another factor that must be taken into account when deciding on the choice of membrane, namely fouling. Seawater contains a great number of species that may interfere with the efficiency of, or even damage, the membrane.5–8 While commercial desalination plants have a pre-treatment stage, where the most problematic compounds are removed from the saltwater before the actual desalination process, typically by microfiltration, it is not always possible, or economically feasible, to remove every species capable of interfering with the RO membrane. Consequently, it is necessary to periodically halt the RO process and reverse the direction of water flow to flush out foulants, and ultimately to replace the membrane material itself. Developing membranes that are resistant to fouling, thereby maintaining maximum operating efficiency for longer, is an important goal. Greater understanding of how fouling occurs will assist in this aim, and computer simulations that can investigate the interaction of the species at the atomic level could play a valuable role here.
The membranes currently used in commercial RO are largely based upon two different types of polymer,1,9 either cellulose-acetate (CA) or aromatic polyamides (PA). The membranes based on CA were developed first, but due to a number of drawbacks they have largely been superseded by membranes based on aromatic polyamides. This newer generation of materials are thin film composite (TFC) materials10–12 that consist of a thin polyamide layer, approximately 2000 Å thick, which is responsible for the rejection of the salt ions, on top of a thicker (∼1 μm) layer of a microporous material, usually polysulfone (PS), which provides mechanical stability but plays no role in the removal of salt from the water.
In a previous study,13 the interaction of the FT30 polyamide-polysulfone membrane with water and salt ions was investigated, with the result that the model was demonstrated to reliably capture the behaviour of the real system in terms of quantities such as the water content of the membrane, the diffusivities of ions in the saline solution, etc. The structure of polyamide FT30 is comprised of the repeat units shown in Fig. 1. For the present study the model developed previously will be used to investigate the interaction of the membrane with three different foulant species.
 | ||
| Fig. 1 Two repeat units of the polyamide simulated in the present study. The carbon, oxygen, nitrogen and hydrogen atoms are coloured grey, red, blue and white, respectively. | ||
The range of molecules that are capable of fouling PA membranes is quite diverse but one of the most important groups of compounds are humic substances. This family of species not only have a high fouling potential for PA membranes but also have a relatively high concentration in water from a range of environments.5,8 There have been a number of experimental studies of the fouling of RO membranes by humic substances.14–16 However, the large number of different compounds that are labelled as humic matter makes any investigation of the interaction of the foulant and the membrane challenging. Polysaccharides, such as alginic acid, are another component of the natural organic matter (NOM) responsible for RO membrane fouling and these species too have been investigated experimentally.6–8
Recently, there has been interest in the role that gases present in water might have on the reverse osmosis process. A study by Rzeehowicz and Pashley17 showed that if the saltwater was degassed before being passed through the RO system improvements in the flow rate of the membrane were observed. While perhaps not fouling in the traditional sense, N2 and O2 gases present in water does seem to impair the efficiency of polyamide membranes.
Three different foulant species have been chosen for investigation in the present study in order to contrast their interactions with the membrane. As described above, humic substances and polysaccharides are important foulants within the NOM found in water sources. However, the wide variety of compounds that constitute these substances make them difficult to simulate, a problem compounded by their large molecular weights. Therefore, it was decided to initially use a model compound that would be representative of the interactions of larger systems. Of the range of moieties that are present in humic substances one of the most common are phenolic groups; likewise sugars are another common group present in both humic and alginic acids. Glucose and phenol, with their relatively simple structures, are common building blocks of larger structures and can act as representative organic foulants. In future simulations the complexity of the problem can be expanded to investigate further compounds of higher molecular weight. The final foulant species, O2 gas, was chosen as an example of a simple inorganic molecule that is known to influence the properties of RO membranes while possessing very different interactions to humic substances.
Methods
When simulating the interface between a reverse osmosis membrane and saline solution, it is necessary to employ large models that comprise many thousands of atoms, such that the thickness of the membrane and solution regions are adequate. Furthermore, both the polymer and solution regions exhibit fast diffusion and are highly dynamic. Therefore, the most appropriate technique to sample the extensive configuration space is to employ molecular dynamics based on classical interatomic potentials to describe the interaction energy of the system.As with our previous study on polyamide RO membranes13 the OPLS_AA force-field18,19 was used to model the polyamide membrane and phenol molecule. The same force-field has also been used to describe the oxygen diatomic molecule and its interactions. Although the oxygen molecule has a triplet ground state, and thus the potential for spin–spin interactions between molecules exists, it is assumed that this represents a small contribution and is neglected. The glucose molecule is modelled with extensions to the force-field developed specifically for carbohydrate molecules.20,21Water was again modelled using the rigid four-site TIP4P-Ew model22 and the parameters for the salt ions were taken from the work of Joung and Cheatham,23 whose parameters are specifically designed to work with TIP4P-Ew water.
The molecular dynamics simulations were performed using a modified version of the DL_POLY code version 2.1924 with the PLUMED plugin.25 The equations of motion have been propagated using a Velocity Verlet algorithm with a timestep of 0.5 fs. A smooth particle mesh Ewald sum26 was utilised to compute the electrostatic interactions. Simulations were performed in either the NVT or NPT ensembles at 300 K and 1 atm using the Nosé-Hoover thermostat and barostat27,28 with relaxation parameters of 1.0 and 10.0 ps, respectively.
The full details of the construction and equilibration of the system have been given in detail previously,13 and so only the final system arrangement will be described. The systems simulated consist of a solution layer in contact with a layer of the solvated polyamide, which in turn is in contact with a lattice of atoms representing a coarse-grained polysulfone support. The model for the polyamide membrane was constructed such that the water content of the membrane is ∼23% by mass and with 9.8% of the repeat units being cross-linked, details that match structural information known about FT30.12,29 The density of the simulated membrane compares well with that of the experimental system, 1.34 ± 0.01 as opposed to 1.38 g cm−1. The polysulfone support was modelled by a hexagonal lattice of atoms, tethered to their positions by a harmonic spring with a force constant of 419 kJ mol−1. These atoms were assigned van der Waals parameters of σ = 3.5 Å and ε = 2.76 kJ mol−1, equivalent to an aliphatic carbon in the OPLS-AA force-field, and with no partial charge. Fig. 2 shows a snapshot of the system following equilibration, but before any foulant species is introduced.
 | ||
| Fig. 2 The system arrangement of the polyamide membrane simulated in the present work. The water is coloured green, the polyamide grey, and the coarse-grained polysulfone support blue. | ||
Table 1 summarises the details of the different configurations explored for simulations involving O2 molecules. In order to obtain statistically meaningful results the concentration of oxygen in all the simulated systems had to be increased compared with the very low concentration that would result from the experimental solubility of this species in water. Before conducting simulations of the polyamide membrane in the presence of oxygen, three control simulations of the diatomic molecules in water at two different salt concentrations (0.00 and 0.55 molal) and two different oxygen concentrations (0.04 and 0.07 molal) were performed. For the simulations involving the interaction of oxygen with the membrane two sets of calculations were performed at the same two salt concentrations, pure water and seawater (0.55 molal) and again with oxygen concentrations of 0.04 and 0.07 molal. In the first set of simulations the gas molecules were initially placed in the solution layer, 8–12 Å from the membrane interface. In the second set of simulations a number of oxygen diatomic molecules were placed directly inside the membrane.
| Run | Membrane present | [NaCl]/molal | Number of O2 molecules | Location of O2 molecules | Duration of production run/ns |
|---|---|---|---|---|---|
| a Results taken from ref. 13. | |||||
| OC1 | No | 0.00 | 4 | In solution | 4 |
| OC2 | No | 0.55 | 4 | In solution | 4 |
| OC3 | No | 0.55 | 12 | In solution | 4 |
| MC1 a | Yes | 0.55 | 0 | N/A | 10 |
| OP1 | Yes | 0.00 | 4 | In solution | 8 |
| OP2 | Yes | 0.55 | 4 | In solution | 6 |
| OP3 | Yes | 0.55 | 12 | In solution | 6 |
| OP4 | Yes | 0.00 | 4 | In membrane | 6 |
| OP5 | Yes | 0.55 | 12 | In membrane | 6 |
The details of the different simulations performed for the systems containing one or more of the organic foulant molecules (phenol or glucose) molecules are described in Table 2. The β-D-glucofuranose isomer of glucose was the molecular configuration simulated in all the runs. Given the achiral nature of the membrane polymer, it is unlikely that the choice of specific conformation for glucose will substantially change the results. As with the oxygen systems, two control runs with each of the organic molecules in pure water and saline solution were carried out first in order to determine reference data for comparison. Simulation GP1 consisted of the polyamide membrane interacting with a solution consisting of 0.55 molal NaCl solution (seawater) and eight randomly distributed glucose molecules. Similarly, simulation PP1 had twelve phenol molecules randomly distributed in seawater solution above the PA membrane. For the final runs (GP2/PP2), the components of the system remained unchanged from GP1/PP1 but rather than being randomly dispersed, the foulant molecules were placed in close contact with the polyamide interface. This choice was made in order to observe how the presence of the foulant molecules at the polyamide-water boundary might influence the rate of exchange of water molecules between the two phases.
| Run | Membrane present | [NaCl]/molal | Number of foulant molecules | Location of foulant | Duration of production run/ns |
|---|---|---|---|---|---|
| GC1 | No | 0.00 | 4 | In solution | 4 |
| GC2 | No | 0.55 | 8 | In solution | 4 |
| PC1 | No | 0.00 | 4 | In solution | 5 |
| PC2 | No | 0.55 | 12 | In solution | 5 |
| GP1 | Yes | 0.55 | 8 | In solution | 8 |
| GP2 | Yes | 0.55 | 8 | At interface | 6 |
| PP1 | Yes | 0.55 | 12 | In solution | 8 |
| PP2 | Yes | 0.55 | 12 | At interface | 6 |
Results and discussion
Oxygen
The rate of diffusion of oxygen diatomics, ions and water molecules in solution is given in Table 3. As previously reported,13 the diffusion coefficients of the water and salt ions compare well with experimental data and show the correct qualitative behaviour. In the control simulations, the diffusion rates of the oxygen molecules are approximately the same as the water molecules. This makes sense as the interaction between the neutral diatomic and the water is relatively weak, and the diffusion of the oxygen molecules is simply driven by the rearrangements of the surrounding cavity of water molecules. The presence of the gas molecules has no observable effect on the diffusion rates of either the water or the salt ions at the concentrations explored. The radial distribution functions of the oxygen molecules with the water and salt ions are shown in Fig. 3. The ordering of the water molecules and chloride ion around the oxygen molecule is very weak, as might be expected. The water forms a cavity around the largely hydrophobic diatomic, leading to a peak at ∼3.3 Å for the first shell, but with little structuring beyond this. The radial distribution function for chloride is similar to that of water except the first peak lies at greater distance. This indicates that the chloride ion largely maintains its first solvation shell when approaching oxygen. As the most strongly solvated species, sodium has quite a different radial distribution function as it prefers to avoid being in proximity to the cavity surrounding the oxygen molecule. The results are not sensitive to the concentration of oxygen at the levels considered, with the only difference being the smooth curves for the higher concentration as a consequence of the improved statistical sampling.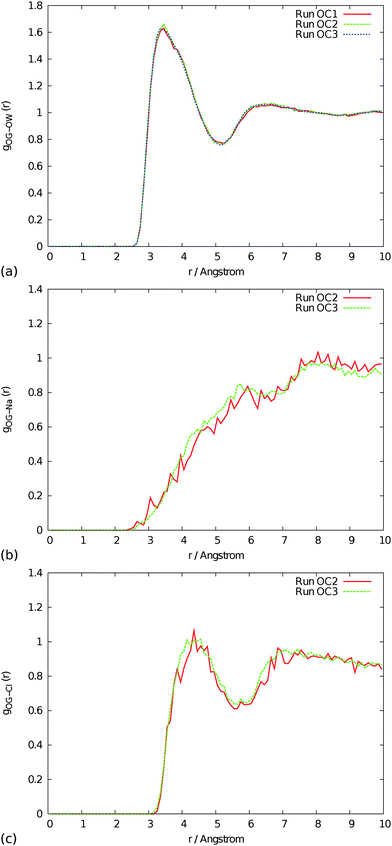 | ||
| Fig. 3 Radial distribution functions of oxygen gas with (a) water, (b) Na+ and (c) Cl− taken from control runs. See Table 1 for the conditions corresponding to each run label. | ||
| Simulation run | Diffusion coefficient/10−9 m2 s−1 | |||||
|---|---|---|---|---|---|---|
| In solution | In membrane | |||||
| Water | O2 | Na+ | Cl − | Water | O2 | |
| OC1 | 2.70 ± 0.01 | 2.70 ± 0.18 | — | — | — | — |
| OC2 | 2.55 ± 0.05 | 2.67 ± 0.77 | 1.21 ± 0.07 | 1.72 ± 0.06 | — | — |
| OC3 | 2.58 ± 0.01 | 2.56 ± 0.15 | 1.24 ± 0.04 | 1.71 ± 0.04 | — | — |
| MC1 | 2.49 ± 0.05 | — | 1.21 ± 0.09 | 1.58 ± 0.05 | — | — |
| OP1 | 2.69 ± 0.08 | 1.69 ± 0.45 | — | — | 0.23 ± 0.02 | — |
| OP2 | 2.55 ± 0.13 | 1.56 ± 0.30 | 1.23 ± 0.06 | 1.63 ± 0.04 | 0.20 ± 0.01 | — |
| OP3 | 2.60 ± 0.10 | 1.36 ± 0.09 | 1.25 ± 0.05 | 1.67 ± 0.09 | 0.19 ± 0.02 | — |
| OP4 | 2.76 ± 0.06 | — | — | — | 0.23 ± 0.02 | 0.10 ± 0.01 |
| OP5 | 2.54 ± 0.10 | — | 1.25 ± 0.02 | 1.70 ± 0.04 | 0.22 ± 0.01 | 0.06 ± 0.01 |
When the oxygen molecules are placed above the membrane interface and allowed to diffuse freely, there seems to be a general preference for the O2 diatomics to diffuse towards the membrane and bind to the surface. This favourable interaction between the membrane and molecular oxygen accounts for the lower diffusion coefficients observed for this species in simulations OP1, OP2 and OP3 when compared against the control runs. While the oxygen molecules prefer the surface of the membrane to the bulk solution, they do not appear to be bound tightly and diffuse across the membrane somewhat. In the simulation with the highest concentration of oxygen diatomics, a single O2 molecule does actually diffuse some way into the membrane layer having started initially in solution.
For runs OP4 and OP5, where the oxygen molecules are placed in the membrane, the gas molecules were randomly distributed within the organic layer. As one would expect, the rate of diffusion of the oxygen molecules within the membrane layer is significantly reduced. In fact the diffusion coefficient of the molecular oxygen is lower than that of the water within this region. In contrast with the experimental results, no reduction is seen in the rate of the water diffusion within the membrane when oxygen is present. Table 4 shows the coordination number of the oxygen molecule with the various polymer functional groups and water when in the polyamide layer, as well as the coordination to water in solution for reference. The oxygen molecules prefer to occupy regions in proximity to the aromatic rings, due to the fact that the phenyl rings are the least polar part of the membrane.
In order to probe the strength of the interaction between the oxygen molecules and the membrane layer, umbrella sampling methods were used to determine the free energy profile associated with oxygen crossing the membrane-aqueous interface. A set of 50 umbrellas, spaced at 0.5 Å intervals were placed across the membrane interface approximately spanning the distance between a point 14 Å within the membrane up to one 10 Å above the membrane-solution interface. The centre of mass of the oxygen diatomic was restrained to lie in a plane perpendicular the z-axis by a harmonic potential with a force constant of 8.4 kJ mol−1, but was allowed to move freely within that plane.
Five sets of simulation runs were conducted with the initial x- and y-coordinates of the oxygen molecule different each time, in order to examine the variability of the membrane-solution interface. All five simulations were performed for a system with a salt concentration of 0.55 molal and a gas concentration of 0.07 molal. All of these simulations had a duration of 550 ps; other simulation details are as described above in the methods section.
Fig. 4 shows the free energy profiles for the five sets of simulations. As for previous profiles obtained for the diffusion of Na+ and Cl− ions across the membrane interface,13 there is quite a strong degree of variation between the profiles (although the uncertainty of each profile was small ∼±0.3 kJ mol−1). However, in all five profiles the minimum in the free energy of the profile is at a point either within the membrane or at the membrane surface. The average binding energy of the gas molecules to the membrane interface is calculated as 6.2 ± 2.2 kJ mol−1. Given that there are several possible lower energy pathways for oxygen to diffuse part way into the membrane, this confirms that the observation of a molecule crossing the interface during an unbiased simulation was not a statistical rarity caused by the initial configuration. For two of the pathways (runs 1 and 3), there is a relatively low energy barrier of 20–30 kJ mol−1 for the molecular oxygen to permeate deep into the membrane, while for the other regions of the membrane the free energy continues to disfavour diffusion of oxygen beyond the interface. This again highlights the non-uniformity of the membrane properties with regards to its interaction with small hydrophobic molecules.
 | ||
| Fig. 4 Free energy profiles for an O2 molecule to cross the interface of the polyamide membrane, determined using umbrella sampling. Negative positions are within the membrane layer, while positive values correspond to the molecule being in solution. | ||
Organic foulants
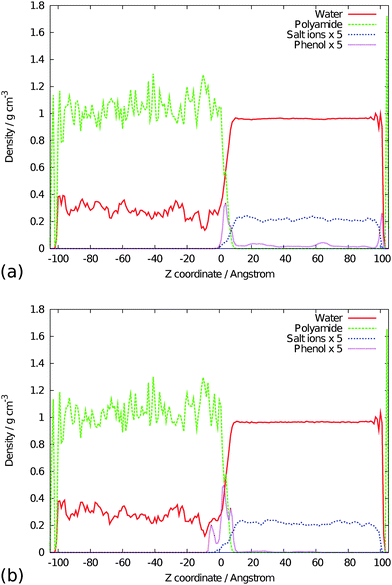
The diffusion coefficients of water, glucose, phenol, Na+ and Cl− are given in Table 5. While the diffusion rate of glucose is reduced in the presence of salt ions, as is usual, the diffusion coefficient of phenol shows only a small change in seawater. The most likely explanation of this difference is that the hydrophobic nature of phenol makes it more insensitive to saline solution. Over the course of the simulations both foulant molecules are observed to bind to the membrane but in different manners. The glucose molecule will bind to the membrane surface, diffuse away from the membrane surface and then rebind multiple times at different locations, whereas the phenol molecules have a greater propensity to remain bound to the membrane. The diffusion rates of both the glucose and phenol molecules in these simulations are reduced when compared to the control solution simulations due to the interaction of the foulant molecule with the membrane interface. The positions of the glucose molecules over the entire simulation time can be determined by calculating the density profile of the systems. The density profiles for the glucose runs are shown in Fig. 5 and those of the phenol runs in Fig. 6; the profiles of the water, the polyamide, salt ions and foulant molecules have all been calculated. In simulations GP1 and PP1 where the foulant molecules where initially randomly distributed throughout the solution there is a build up of glucose/phenol molecules on the surface of the polyamide membrane over the course of the simulation. In GP2/PP2 where the glucose is initially positioned close to the polyamide interface the distribution of this species remains in this vicinity. While the density profiles of the two foulants show similarities, there are also differences. In PP1 there is also a build up of phenol on the coarse-grained support layer (right hand side of Fig. 6(a)) at its interface with the solution (due to the hydrophobic nature of phenol and the support). Such behaviour is not seen in the case of glucose, which is much more hydrophilic. There are also some differences in the density profiles of GP2 and PP2 (Fig. 5(b) and 6(b)): the glucose molecules are mostly found on the surface of the polyamide while in the case of phenol there is a significant density of phenol molecules present below the surface, indicating that some of the molecules have diffused a short way into the membrane. | ||
| Fig. 5 Density profiles of (a) simulation run GP1 and (b) simulation run GP2, showing the build up of glucose molecules on the surface of the polyamide membrane. | ||
 | ||
| Fig. 6 Density profiles of (a) simulation run PP1 and (b) simulation run PP2, showing the build up of phenol molecules on the surface of the polyamide membrane. | ||
| System | Diffusion coefficient/109 m2 s−1 | ||||
|---|---|---|---|---|---|
| In solution | In membrane | ||||
| Water | Foulant | Na+ | Cl − | Water | |
| GC1 | 2.70 ± 0.02 | 0.90 ± 0.11 | — | — | — |
| GC2 | 2.51 ± 0.03 | 0.72 ± 0.06 | 1.24 ± 0.05 | 1.52 ± 0.05 | — |
| PC1 | 2.71 ± 0.02 | 1.22 ± 0.10 | — | — | — |
| PP1 | 2.54 ± 0.05 | 1.18 ± 0.10 | 1.21 ± 0.06 | 1.66 ± 0.08 | — |
| GP1 | 2.57 ± 0.15 | 0.54 ± 0.13 | 1.29 ± 0.12 | 1.72 ± 0.18 | 0.25 ± 0.02 |
| GP2 | 2.57 ± 0.09 | 0.17 ± 0.04 | 1.29 ± 0.12 | 1.71 ± 0.11 | 0.21 ± 0.01 |
| PP1 | 2.55 ± 0.09 | 1.03 ± 0.17 | 1.26 ± 0.11 | 1.68 ± 0.11 | 0.22 ± 0.01 |
| PP2 | 2.57 ± 0.01 | 0.16 ± 0.05 | 1.24 ± 0.08 | 1.69 ± 0.03 | 0.21 ± 0.01 |
When in contact with membrane the glucose molecules form multiple hydrogen bonds with the polymer. The number of hydrogen bonds between the glucose/phenol molecules and water molecules, the polyamide and other glucose/phenol molecules is given in Table 6. A hydrogen bond is defined as one where the donor and acceptor atoms are within 3.5 Å of each other and the donor-hydrogen-acceptor angle is in the range 120–180°. Fig. 7 is a snapshot taken from simulation GP1 with a glucose molecule binding to the membrane. The glucose molecules both accept and donate hydrogens with the polyamide membrane, but on average the donation/acceptance ratio seems to be approximately 1.33![[thin space (1/6-em)]](https://www.rsc.org/images/entities/char_2009.gif) :1. Relatively few glucose-glucose hydrogen bonds are formed even in GP2, where all eight glucose molecules are at, or near to, the interface. The results show that there are relatively few hydrogen bonds formed between phenol molecules and the polyamide, suggesting that the binding of phenol molecules to the polyamide surface is not primarily due to hydrogen-bonding.
:1. Relatively few glucose-glucose hydrogen bonds are formed even in GP2, where all eight glucose molecules are at, or near to, the interface. The results show that there are relatively few hydrogen bonds formed between phenol molecules and the polyamide, suggesting that the binding of phenol molecules to the polyamide surface is not primarily due to hydrogen-bonding.
 | ||
| Fig. 7 Snapshot taken from simulation GP2 showing the glucose molecule (yellow) binding to the membrane surface (where carbon, oxygen, nitrogen and hydrogen are dark grey, red, blue and white, respectively). | ||
| Number of hydrogen bonds per foulant molecule | |||||
|---|---|---|---|---|---|
| Foulant as donor | Foulant as acceptor | Foulant-foulant | |||
| Water | Polyamide | Water | Polyamide | ||
| GC1 | 2.54 ± 1.23 | — | 4.51 ± 1.70 | — | — |
| GC2 | 2.55 ± 0.40 | — | 4.29 ± 0.57 | — | 0.01 ± 0.03 |
| PC1 | 0.74 ± 0.23 | — | 0.97 ± 0.35 | — | 0.00 ± 0.00 |
| PC2 | 0.76 ± 0.12 | — | 1.02 ± 0.20 | — | 0.00 ± 0.00 |
| GP2 | 2.33 ± 0.41 | 0.22 ± 0.16 | 4.24 ± 0.58 | 0.15 ± 0.13 | 0.02 ± 0.05 |
| GP3 | 2.23 ± 0.39 | 0.35 ± 0.18 | 3.76 ± 0.46 | 0.26 ± 0.16 | 0.03 ± 0.06 |
| PP1 | 0.74 ± 0.13 | 0.04 ± 0.06 | 0.91 ± 0.19 | 0.03 ± 0.05 | 0.00 ± 0.01 |
| PP2 | 0.64 ± 0.12 | 0.10 ± 0.06 | 0.72 ± 0.18 | 0.07 ± 0.04 | 0.00 ± 0.01 |
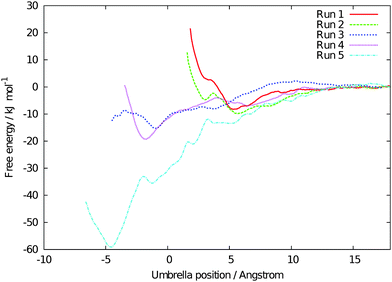
As for the O2 species, the binding strength of the glucose and phenol molecules to the interface was calculated using umbrella sampling methods. The procedure adopted is generally the same as described for the case of molecular oxygen. One change was that the distance the umbrellas spanned was shifted in a positive direction (i.e. towards the solution region) due to the fact that the extended size of the system could lead to a longer tail of the free energy profile towards the solution side than seen for the oxygen diatomic before reaching a constant value. Therefore, the umbrellas were placed so that they spanned a distance of approximately 20 Å, from a point ≈5 Å below the membrane interface up to one ≈15 Å into the solution. As with the oxygen molecules, five sets of umbrella sampling simulations were carried out with the x- and y-coordinates of the foulant molecule differing each time. All simulations were conducted in saline solutions that equate to seawater and with a single glucose or phenol molecule present. It should be noted that the more complex nature of the organic molecules will lead to a greater degree of uncertainty in the free energy profiles than for oxygen due to the larger number of unconstrained degrees of freedom to be sampled.
The five free energy profiles obtained for glucose and phenol are shown in Fig. 8 and 9, respectively. In the case of glucose the nature of all the profiles is similar, something that is not seen for either of the other foulants or for salt ions diffusing across the interface.13 Each profile shows a free energy minimum at a distance of ≈3–5 Å from the membrane interface with a sharp increase in the free energy at distances below this, where the large glucose molecule begins to be forced into the bulk membrane, and with a more gradual increase up to a plateau value as the foulant moves into bulk solution. The average binding energy of the glucose molecule to the membrane is 11.8 ± 3.7 kJ mol−1, making it more strongly bound to the membrane interface than molecular oxygen.
 | ||
| Fig. 8 Free energy profiles for a glucose molecule to diffuse to the interface of a FT30 polyamide membrane. Here zero approximately represents the mean position of the interface with positive values corresponding to the foulant moving increasingly into the saline solution. | ||
 | ||
| Fig. 9 Free energy profiles for a phenol molecule to diffuse to the interface of a FT30 polyamide membrane. Here zero approximately represents the mean position of the interface with positive values corresponding to the foulant moving increasingly into the saline solution. | ||
The profiles for phenol are more varied, although in all cases the interaction of the phenol and the polyamide is favourable. Two of the runs show a profile similar to that of the glucose systems with a minimum at ≈5 Å above the membrane interface and a sharp increase in the free energy at distances shorter than this. Runs three and four have somewhat deeper minima at a point below the membrane interface, and the final run has a very deep minimum indeed and the phenol molecule has diffused approximately 5 Å into the membrane (Fig. 10 shows a snapshot from this run). The difference in profile is due to the fact that the phenol molecules are observed binding in two different manners. Sometimes the phenol molecule will bind to the membrane in a manner similar to that of the glucose molecules with the molecule simply binding to the membrane surface. However, if there is a pore of sufficient size nearby then the phenol molecule, due to its planar geometry, can diffuse into the membrane a certain distance. Because of the wide range of values obtained it does not make sense to calculate an average binding energy for phenol. It appears that if the molecule binds to the surface of the membrane the binding energy is similar to that of glucose, whereas if the molecule manages to diffuse some way into the membrane then it can bind to the polyamide more strongly.
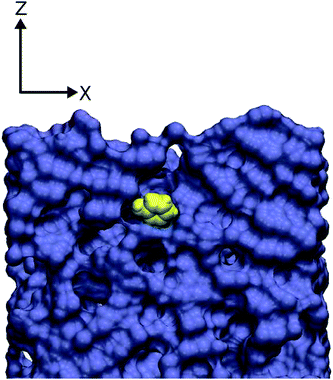 | ||
| Fig. 10 Snapshot showing a phenol molecule (in yellow) that has diffused into the polyamide membrane (shown using a purple van der Waals surface). | ||
For comparison the binding energies of two glucose molecules and two phenol molecules to each other in salt solution (0.55 molal) were also calculated using umbrella sampling methods. The free energy profiles of the two pairs of molecules interacting were calculated from a distance of 3 Å out to a distance of 16 Å. The other simulation details were the same as for the umbrella sampling of the polyamide systems. The free energy profiles for both the glucose-glucose and phenol-phenol interaction are shown in Fig. 11. Neither of the interactions is particularly strong apart from at very short distances. In the case of glucose, as the two molecules approach each other there is a small free energy barrier at ∼8.0 Å followed by a local free energy minima at ∼6.5 Å; at distances shorter than this the free energy increases sharply. The phenol-phenol interaction has a small, <1 kJ mol−1, free energy minimum at approximately 5.0 Å. Below this distance the free energy rapidly increases, as one would expect. From these results it is clear that the interaction of the glucose and phenol molecules with the polyamide membrane is much stronger than the self-interaction of two foulant molecules. Despite the fact that both foulants have this in common, the evidence suggests that the driving force for the binding of the two organic molecules to the membrane differs. The binding of glucose molecules to the membrane surface arises from the hydrogen bonding between the foulant and the polyamide functional groups. While there is some hydrogen bonding between phenol molecules and the membrane, the primary driving force of phenol fouling arises from the fact that the aromatic ring prefers the less polar environment of the polyamide membrane to that of the bulk solution.
 | ||
| Fig. 11 Free energy profile of the interactions of two glucose molecules and two phenol molecules in 0.55 molal NaCl solution, calculated using umbrella sampling methods. | ||
It is known that humic substances foul membranes by binding to the surface of the membrane, thereby reducing the flow rate of water through the membrane by blocking pores. While there is no pressure gradient in the present simulations, as there would be during reverse osmosis operation, water molecules do flow from bulk solution into the membrane layer and vice versa. The average rate of exchange of water molecules across the polyamide interface was calculated for a number of different simulation conditions by comparing configurations 500 ps apart. Table 7 gives the results of these calculations. For those systems where multiple phenol or glucose molecules are present there is a marked reduction in the rate of exchange. It therefore seems reasonable to conclude that the organic molecules do make it more difficult for water molecules to cross the membrane interface. The rate of exchange of water was also calculated for the simulations where oxygen molecules were present. For these simulations no change in the rate of exchange is observed, reflecting the weaker binding to the membrane and the fact the oxygen is not strongly localised in a single plane. Consequently, water can diffuse around any oxygen that is present.
Conclusions
The interaction of a polyamide reverse osmosis membrane with three different foulant molecules, glucose, phenol and oxygen gas, has been investigated using molecular dynamics simulations in conjunction with umbrella sampling methods. The three foulants were chosen because of their very different natures and, in the case of glucose and phenol, the fact that they represent two of the basic building blocks of the wide range of organic foulants that fall under the heading of natural organic matter. All three of the foulant species were observed to diffuse towards and bind to the membrane interface in unbiased molecular dynamics simulations. However, the use of umbrella sampling allowed the binding strength of the three foulants to be determined. The results showed that the organic foulants bound more strongly to the membrane than oxygen gas.The simulations indicate that the build up of oxygen gas at the surface in inside polyamide membranes is likely, in accordance with experimental results. The driving force for the build up of the oxygen gas within the polymer membrane may be due to a favourable hydrophobic interaction between the oxygen gas and the polyamide membrane. Alternatively, it may equally well be due to the cost of forming a cavity in the water around the gas molecule, thereby favouring their diffusion to the membrane surface. Despite such a build up, no change in the rate of diffusion of water within the polyamide membrane was observed when gas molecules were placed inside the membrane. The reason for this might be due to the low concentration of oxygen in the systems. However, the concentration of gas in the simulations while low in absolute terms is high compared with the concentration in real RO membrane systems. A more likely explanation is that no bubble of oxygen was formed within the membrane.
For the two organic molecules investigated, phenol and glucose, both have been shown to bind to the membrane relatively strongly. However, the behaviour of the two organic foulants and the driving force of their attraction to the polyamide membrane differed. Glucose molecules diffused onto the surface of the membrane and formed hydrogen bonds with the polymer functional groups. Phenol molecules would not only bind to the surface of the membrane but in some cases would diffuse through the membrane pores. Moreover the primary reason for the favourable polyamide-phenol interaction seems to be due to the hydrophobicity of the phenol molecules. The presence of both of the organic foulants on the membrane surface has been shown to reduce the rate of exchange of water molecules across the membrane interface.
Over the course of the umbrella sampling simulations changes in the surface membrane were observed and it is possible that structural rearrangements of the membrane may be correlated with foulant molecules binding to/being released from the membrane surface. However, the present simulations do not provide enough data to discriminate between intrinsic membrane fluctuations and those changes induced by the presence of the foulant for any conclusion to be draw. An investigation of such behaviour at the atomistic level would be highly challenging, and is likely to be more successfully achieved using a course-grained model.
Acknowledgements
This research was supported by the Commonwealth Scientific and Research Organisation (CSIRO) under the “Water For A Healthy Country” Flagship. Additionally the authors would like to thank the cluster members, especially Stephen Grey and Sandra Kentish, for their comments and discussion. JDG would like to thank the Australian Research Council (ARC) for a Professorial fellowship. Both iVEC and the National Computational Infrastructure (NCI) are acknowledged for the provision of computational resources.References
- C. Fritzmann, J. Loewenberg, T. Wintgens and T. Melin, Desalination, 2007, 216, 1–76 CrossRef CAS.
- A. D. Khawaji, I. K. Kutubkhanah and J.-M. Wie, Desalination, 2008, 221, 47–69 CrossRef CAS.
- C. Charcosset, Desalination, 2009, 245, 214–231 CrossRef CAS.
- I. E. Saliby, Y. Okour, H. K. Shon, J. Kandasamy and I. S. Kim, Desalination, 2009, 247, 1–14 CrossRef.
- S. K. Hong and M. Elimelech, J. Membr. Sci., 1997, 132, 159–181 CrossRef CAS.
- J. H. Kweon and D. F. Lawler, Water Sci. Technol., 2005, 51, 101–106 CAS.
- P. Le-Clech, Y. Marselina, Y. Ye, R. A. Stuetz and V. Chen, J. Membr. Sci., 2007, 290, 36–45 CrossRef CAS.
- K. Northcott, S. E. Kentish, J. Best and G. Stevens, Desalination, 2009, 236, 194–201 CrossRef CAS.
- D. Li and H. Wang, J. Mater. Chem., 2010, 20, 4551–4566 RSC.
- P. S. Singh, S. V. Joshi, J. J. Trivedi, C. V. Devmurari, A. P. Rao and P. K. Ghosh, J. Membr. Sci., 2006, 278, 19–25 CrossRef CAS.
- B. Mi, O. Coronell, B. J. Marinas, F. Watanabe, D. G. Cahill and I. Petrov, J. Membr. Sci., 2006, 282, 71–81 CrossRef CAS.
- B. Mi, D. G. Cahill and B. J. Marinas, J. Membr. Sci., 2007, 291, 77–85 CrossRef CAS.
- Z. E. Hughes and J. D. Gale, J. Mater. Chem., 2010, 20, 7788–7799 RSC.
- A. Seidel and M. Elimelech, J. Membr. Sci., 2002, 203, 245–255 CrossRef CAS.
- C. Park, H. Kim, S. Hong and S.-I. Choi, J. Membr. Sci., 2006, 284, 248–254 CrossRef CAS.
- Y. Yu, S. Lee and S. Hong, J. Membr. Sci., 2010, 351, 205–213 CrossRef CAS.
- M. Rzeehowicz and R. M. Pashley, J. Membr. Sci., 2007, 295, 102–107 CrossRef.
- W. L. Jorgensen and J. Tirado-Rives, J. Am. Chem. Soc., 1988, 110, 1657–1666 CrossRef CAS.
- W. L. Jorgensen, D. S. Maxwell and J. Tirado-Rives, J. Am. Chem. Soc., 1996, 118, 11225–11236 CrossRef CAS.
- W. Damm, A. Frontera, J. TiradoRives and W. L. Jorgensen, J. Comput. Chem., 1997, 18, 1955–1970 CrossRef CAS.
- W. Damm and W. E. V. Gunsteren, J. Comput. Chem., 2000, 21, 774–787 CrossRef CAS.
- H. W. Horn, W. C. Swope, J. W. Pitera, J. D. Madura, T. J. Dick, G. L. Hura and T. Head-Gordon, J. Chem. Phys., 2004, 120, 9665–9678 CrossRef CAS.
- I. S. Joung and T. E. Cheatham, J. Phys. Chem. B, 2008, 112, 9020–9041 CrossRef CAS.
- W. Smith and T. R. Forester, J. Mol. Graphics, 1996, 14, 136–141 CrossRef CAS.
- M. Bonomi, D. Branduardi, G. Bussi, C. Camilloni, D. Provasi, P. Raiteri, D. Donadio, F. Marinelli, F. Pietrucci, R. A. Broglia and M. Parrinello, Comput. Phys. Commun., 2009, 180, 1961–1972 CrossRef CAS.
- U. Essmann, L. Perera, M. L. Berkowitz, T. Darden, H. Lee and L. G. Pedersen, J. Chem. Phys., 1995, 103, 8577–8593 CrossRef CAS.
- S. Nose, J. Chem. Phys., 1984, 81, 511–519 CrossRef CAS.
- W. G. Hoover, Phys. Rev. A: At., Mol., Opt. Phys., 1985, 31, 1695–1697 CrossRef.
- M. J. Kotelyanskii, N. J. Wagner and M. E. Paulaitis, J. Membr. Sci., 1998, 139, 1–16 CrossRef CAS.
| This journal is © The Royal Society of Chemistry 2012 |