High performance dye-sensitized solar cells with record open circuit voltage using tin oxide nanoflowers developed by electrospinning
Received
18th September 2011
, Accepted 12th October 2011
First published on 9th November 2011
Abstract
Flower shaped nanostructures of an architypical transparent conducting oxide, SnO2, have been synthesized by an electrospinning technique for the first time by precisely controlling the precursor concentration in a polymeric solution. The flowers were made up of nanofibrils of diameter ∼70–100 nm, which in turn consisted of linear arrays of single crystalline nanoparticles of size 20–30 nm. Mott–Schottkey analysis shows that flowers have an order of magnitude higher electron density compared with the fibers despite their chemical similarity. Dye-sensitized solar cells fabricated using the flowers showed a record open circuit voltage of ∼700 mV and have one of the highest photoconversion efficiencies so far achieved with SnO2 and the iodide/triiodide electrolyte. The photoaction spectra and impedance spectroscopic measurements show that the flowers are characterized by a higher electron lifetime, owing to their enhanced crystallinity, compared to the conventional fibrous structure.
Broader context
If larger amounts of metal precursors can be enclosed in a nanostructured polymeric architecture, then unconventional morphologies such as flowers of the corresponding inorganic solid could result upon annealing. This hypothesis has been proved by producing flowers of tin oxide, an architypical transparent conducting oxide for energy and environmental applications, from electrospun polyvinyl acetate nanofibers of increased tin concentration. The flowers are comprised of several rare combinations such as ‘high crystallinity and high specific surface area’, and ‘enhanced electron density, diffusivity, and mobility for materials of similar chemical identity’. The flowers, when employed as charge separation and transport medium in dye-sensitized solar cells, resulted in a record open circuit voltage of ∼700 mV and have the highest photoconversion efficiency so far achieved with dye-sensitized tin oxide and the iodide/triiodide electrolyte. The novel properties of this material combined with high electrical conductivity and optical transparency could be of wide interest in sensors, batteries, supercapacitors, solar cells, and other optoelectronic devices requiring a large surface area and high electron mobility. Moreover, the electrospinning technique used for producing the flowers is cost effective as well as feasible for large scale production of advanced materials and membranes for energy and environmental applications.
|
1. Introduction
Dye-sensitized solar cells (DSCs) represent a low-cost renewable energy device due to several advantages, including simple fabrication technique and high energy photovoltaic conversion efficiency (η).1–5 The photovoltage in DSCs is proportional to the difference in Fermi levels of a dye-anchored wide band gap semiconductor, the photoanode, and a hole conductor, usually a redox electrolyte. The efficiency of DSCs depends on various parameters which include morphology and compactness of photoanode, chemical nature and purity of dye, electrolyte composition, counter electrode, and other related parameters.6–12 The dye-loading and hence the number of photogenerated electrons in DSCs, charge transport, and a number of other efficiency determining factors depend on the photoanode and therefore, immense research is directed at optimizing suitable materials and morphology for this application.6,9,13–18
Among the various photoanodes tested, mesoporous TiO2 is the most successful material so far in DSCs for the charge separation and transport due to a number of reasons, such as (i) ease in getting mesoporous particles, (ii) band alignment with various organic and inorganic dyes, and (iii) stability. However, low electron mobility (μn) through mesoporous TiO2 (∼0.1 cm2 V−1 s−1) is a crucial issue and imposes severe limitations in enhancing the η of DSCs closer to the theoretical limits.19 One of the main hurdles due to the inferior μn is the electron recombination with the electrolyte if the photoanode layer thickness is larger than the diffusion length (L). L is the electron transit length above which they are lost via recombination. Tin oxide (SnO2) nanostructures, on the other hand, are a well-known transparent conducting oxide for nanoelectronics due to high μn (10–125 cm2 V−1 s−1) and a wider band gap (∼3.6 eV).20–23 However, its conduction band minimum occurs at an energy lower than that of TiO224 and therefore, DSCs with a SnO2 electrode usually give low open circuit voltages (VOC ≤ 600 mV).25 Recently, VOC up to ∼600 mV has been achieved by preparing the SnO2 core–shell electrodes and/or making composite electrode with other wide band gap semiconductors.16,26,27 To increase the η of SnO2 DSCs, several approaches have been considered: (i) modifying the electrode surface28 (ii) modifying electrolyte composition28,29 (iii) combining with other metal oxide nanoparticles27 and (iv) by using a core–shell configuration of suitable energy band matched metal oxides.27,30,31
Electrospinning provides a simple and versatile technique for producing continuous fibers of nanostructured advanced materials as well as membranes for many engineering applications to be enabled, e.g. mechanical reinforcement, water filtration, textile, tissue engineering, energy and environment, and drug release.32–38 Usually electrospinning produces ultrafine polymeric fibers with diameters ranging from nanometers to sub-micrometers and possess high surface area to volume or mass ratios. If the polymeric solution contains precursors for formation of an inorganic solid, then appropriate annealing produces its continuous nanofibers in three steps, viz. (i) nucleation, (ii) growth, and (iii) directional mass transport. In this paper, we report a flower-like morphology of SnO2 by electrospinning for the first time by controlling the Sn precursor concentration. The flowers thus obtained were characterised by several rare combinations such as ‘high crystallinity and high specific surface area’, and ‘enhanced electron density, diffusivity, and mobility for materials of similar chemical identity’. The DSCs fabricated by the flowers gave the highest VOC (∼700 mV) and one of the highest photoconversion efficiency (η ∼ 3.0%) so far achieved using SnO2.
2. Experimental details
Anhydrous tin(II) chloride (SnCl2), dimethylformamide (DMF), ethanol and polyvinyl acetate (PVAc) were the starting materials. Two sets of syntheses were done by simply changing the precursor concentration. In a typical synthesis, 0.4 g of SnCl2 was dissolved in a mixture of 12.5 mL of DMF and 4 g of ethanol and was stirred for ∼2 h. To the above solution, 1.45 g of PVAc was added and the stirring was continued for ∼4 h until the solution became clear. The above procedure produced 2.5 mM of SnCl2 solution (Sample S1). Similarly 5.5 mM solution of SnCl2 was produced (Sample S2). The clear solutions thus obtained were electrospun using a 27 G1/2 needle under an applied voltage of 25 kV with a solution injection rate of ∼1 mL h−1. The solid fibers were collected at distance of 10 cm below the spinneret. The composite fibers were then peeled off from the collector and calcined at 500 °C for ∼3 h to allow crystallization of the SnO2 phase and removal of the polymer.
2.2 Characterization
The electrospun SnO2 nanostructures were characterized by BET surface area measurements (NOVA 4200E surface area and pore size analyzer, Quantachrome, USA), powder X-ray diffraction (XRD, Bruker-AXS D8 ADVANCE powder X-ray diffractometer), field emission scanning electron microscopy (FE-SEM, Quanta 200 FEG System, FEI Company, USA, operated at 10 kV), energy dispersive X-ray spectroscopy (EDS, JEOL JSM-6701F microscope operated at 30 kV), and high resolution transmission electron microscopy (HR-TEM, JEOL 3010 operated at 300 kV). X-ray photoelectron spectra (XPS) of the SnO2 flowers and fibers were obtained using a VG Scientific ESCA MK II spectrometer using monochromatic Mg Kα radiation (1253.6 eV). The survey spectra were recorded in the range 0–1099 eV with constant pass energy of 50 eV; the high resolution spectra were recorded with a smaller constant pass energy of 20 eV. Charge referencing was carried out against adventitious carbon C, assuming its binding energy at 284.6 eV. Analysis of the XPS spectra was done using XPS Peak-fit software. A Shirley-type background was subtracted from the recorded spectra and curve fitting was carried out with a Gaussian–Lorentzian (ratio 60![[thin space (1/6-em)]](https://www.rsc.org/images/entities/char_2009.gif) :
:![[thin space (1/6-em)]](https://www.rsc.org/images/entities/char_2009.gif) 40) curve. The derived binding energies (BE) have accuracy better than ±0.1 eV.
40) curve. The derived binding energies (BE) have accuracy better than ±0.1 eV.
2.3 Electrochemical impedance spectra and Mott–Schottky analysis
Samples for EIS were prepared by sintering SnO2 flowers and fibers separately onto fluorine doped tin oxide (FTO) coated glass plates and sealed using a 50 μm spacer. Acetonitrile containing 0.1 M lithium iodide, 0.03 M iodine, 0.5 M 4-tert-butylpyridine and 0.6 M 1-propyl-2,3-dimethylimidazolium iodide was used as the electrolyte. A platinum coated glass plate was used as the counter electrode. The Mott–Schottkey plots were generated from electrochemical impedance spectroscopy (EIS) measurements in the dark for bias voltages from 0.4 to 0.7 V and fitting the observed EIS spectra to a simple RC circuit.39
Cyclic voltammetry measurements were carried out on a CHI 760 electrochemical workstation with three-electrode cell in a solution of Bu4PF6 (0.10 M) in acetonitrile at a scanning rate of 100 mV s−1. A glassy carbon disk was used as working electrode and a silver wire as reference electrode. Ferrocene was used for potential calibration.
2.5 Fabrication of solar cells and evaluation of photovoltaic properties
The two polymeric solutions were electrospun separately onto FTO glass substrates (1.5 cm × 1 cm; 25 Ω/□, Asahi Glass Co. Ltd., Japan). Thickness of the electrode was controlled by placing the FTO substrates under the spinneret for different durations of time. The samples were wrapped in aluminium foil and hot-pressed (Stahls' Hotronix 6 × 6 press, USA) at ∼200 °C with a pressure of 0.4 MPa for 15 min to improve the adhesion of the fibers and the flowers to the FTO substrate. The hot-pressed films were then annealed at 500 °C for 3 h to completely remove PVAc and allow nucleation and growth of SnO2. The DSCs were prepared by soaking a 0.28 cm2SnO2 electrode in a dye solution containing a 1![[thin space (1/6-em)]](https://www.rsc.org/images/entities/char_2009.gif) :
:![[thin space (1/6-em)]](https://www.rsc.org/images/entities/char_2009.gif) 1 volume mixture of acetonitrile and tert-butanol and a ruthenium-based dye [RuL2(NCS)2·2H2O; L = 2, 2′-bipyridyl-4,4′-dicarboxylic acid (0.5 mM), N3 Solaronix)] for 24 h at room temperature. The dye-sensitized samples were then washed in ethanol to remove unanchored dye and dried in air. The dye-anchored electrodes were sealed using a 50 μm spacer. Acetonitrile containing 0.1 M lithium iodide, 0.03 M iodine, 0.5 M 4-tert-butylpyridine and 0.6 M 1-propyl-2,3-dimethyl imidazolium iodide was used as the electrolyte. A Pt sputtered FTO glass was used as the counter electrode. Photocurrent measurements were carried out by a XES-151 S solar simulator (San Ei, Japan) under AM1.5G conditions. The level of standard irradiance (100 mW cm−2) was set with a calibrated c-Si reference solar cell. Data acquisition was facilitated by an Autolab PGSTAT30 (Eco Chemie B.V., The Netherlands) integrated with a potentiostat. IPCE measurements were done using the standard kit from Oriel Instruments (model QE-PV-SI, Silicon detector, Newport Corporation, US). The AC responses of the cells were studied by electrochemical impedance spectroscopy using the Autolab PGSTAT30.
1 volume mixture of acetonitrile and tert-butanol and a ruthenium-based dye [RuL2(NCS)2·2H2O; L = 2, 2′-bipyridyl-4,4′-dicarboxylic acid (0.5 mM), N3 Solaronix)] for 24 h at room temperature. The dye-sensitized samples were then washed in ethanol to remove unanchored dye and dried in air. The dye-anchored electrodes were sealed using a 50 μm spacer. Acetonitrile containing 0.1 M lithium iodide, 0.03 M iodine, 0.5 M 4-tert-butylpyridine and 0.6 M 1-propyl-2,3-dimethyl imidazolium iodide was used as the electrolyte. A Pt sputtered FTO glass was used as the counter electrode. Photocurrent measurements were carried out by a XES-151 S solar simulator (San Ei, Japan) under AM1.5G conditions. The level of standard irradiance (100 mW cm−2) was set with a calibrated c-Si reference solar cell. Data acquisition was facilitated by an Autolab PGSTAT30 (Eco Chemie B.V., The Netherlands) integrated with a potentiostat. IPCE measurements were done using the standard kit from Oriel Instruments (model QE-PV-SI, Silicon detector, Newport Corporation, US). The AC responses of the cells were studied by electrochemical impedance spectroscopy using the Autolab PGSTAT30.
3. Results and discussion
3.1 Proposed growth model of nanoflowers
Inorganic fibers from the electrospun polymeric fibers form in three steps; viz. nucleation, growth of the inorganic phase and directional mass transport within the polymeric template.33 As the nucleation and growth of the particles takes place in a supercooled liquid, i.e., in polymer, the evolution of ensemble of nanoparticles can be expressed in terms of the Gibbs–Thompson equation:| |  | (1) |
In the above expression, C(r) and  are the solubility of the particle with radius r and of the bulk material, respectively; γ is the surface tension; Vm is the molar volume of the solid. The supersaturation achieved by heating the fibers results in nucleation of the SnO2 nanocrystals thereby consuming a large fraction of the precursors. The nanocrystals then grow in the diffusion controlled regime with the leftover precursor concentration. Flux of the precursor (Jdiff) reaching a growing particle is given by the Fick's law:
| |  | (2) |
Here, D is the diffusion coefficient of the precursors; x is the distance from the centre of the particles and [M] is the precursor concentration. At high processing temperatures, x → r; and eqn (2) rewrites into:
| |  | (3) |
Eqn (3) qualitatively predicts that [
M] influences (i)
activation of the surface of the growing
nanoparticle, (ii) the effective growth rate,

, and (iii) diameter of the final inorganic nanofibers. Li and Xia experimentally demonstrated that final diameter of the inorganic fibers can be reduced by decreasing the precursor concentration in the electrospun polymeric fibers.
40 In the event of enhancement in
activation energy with precursor concentration, an optimal threshold concentration of precursors is required for the formation of continuous fibers. On the other hand, if the concentration of the precursors exceeds beyond the optimal concentration for fibrous morphology, a larger number of nuclei are formed upon
annealing. Subsequent growth results in a non-equilibrium state such that all the crystallites cannot be accommodated within the given fibrous volume. The fibrous structure therefore undergoes disruption in the presence of the
polymer and leads to non-equilibrium morphologies upon further
annealing as shown schematically in
Fig. 1.
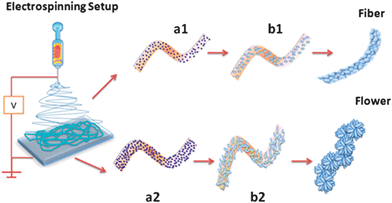 |
| | Fig. 1 Schematics showing the evolution of flower morphology in electrospun inorganic nanostructures when there is a difference in precursor concentration. (a1) Polymeric fibers with lower precursor concentration. (b1) Growth of SnO2 grains contained within the fiber boundary resulting in fiber morphology. (a2) Polymeric fibers with higher precursor concentration. (b2) Highly populated growth of SnO2 grains outstrips the fiber boundary and loses one dimensionality giving rise to flower morphology. | |
3.2 Morphological characterization of fibers and flowers
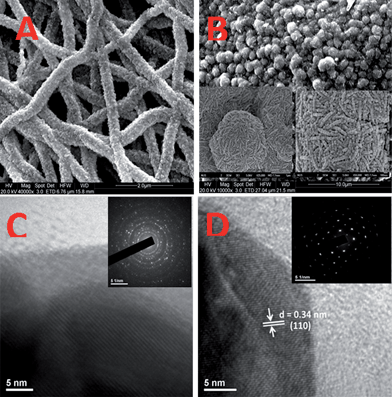
The samples S1 and S2 produced mats composed of fibers of similar diameter (∼700 nm) upon electrospinning. The mats were annealed at 500 °C for ∼3 h to allow crystallization of the SnO2 phase and removal of the polymer. Fig. 2 shows the differences in the morphology of the SnO2 developed from the two mats. The morphologies are clearly different, confirming the growth model described in Section 3.1. Sample S1, with a lower precursor concentration, gave conventional electrospun fibrous morphology (diameter ∼400 nm), whereas the one with higher precursor concentration, i.e., sample S2, yielded flower-shaped particles (size ∼400 nm). Although fibers and flowers were obtained by annealing the as-spun polymeric fiber at a similar temperature, i.e., 500 °C, the degree of crystallinity, judged from the discreteness of the diffraction spots and the extended periodicity in the lattice image, was notably different in both the cases. The flowers showed single crystalline diffraction pattern and lattice images (Fig. 2). On the other hand, diffraction pattern of the fibers consisted of rings – typical of polycrystalline materials having random orientation of crystallites. A closer examination showed that the flower structure is made up of fibrils of diameter ∼80–100 nm, which in turn are made up of particles of size ∼20–30 nm. Owing to the high porosity of the flowers due to polymer permeation during growth, they gave higher BET surface area (40 m2 g−1) compared with that of the fibers (19 m2 g−1).
 |
| | Fig. 2
SEM images (A & B) and HRTEM images (C & D) of fibers and flowers, respectively. Insets: (B) magnified SEM images of the flower morphology; (C) selected area electron diffraction (SAED) pattern showing polycrystalline rings; and (D) SAED pattern of flowers showing single crystalline spotty patterns. | |
3.3 Structural characterization of the flowers and fibers
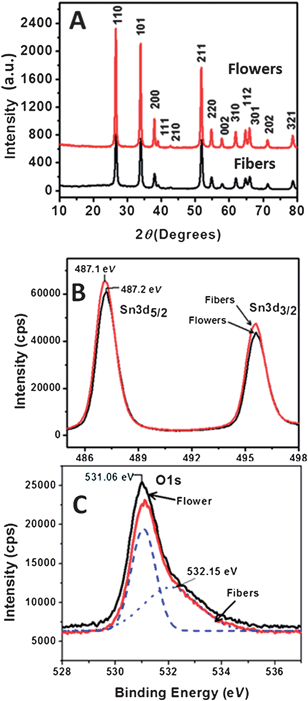
Fig. 3(A) shows the X-ray diffraction (XRD) patterns of the fibers and flowers. Positions of all the diffraction peaks were similar for both morphologies; however, it was noted that relative intensity of the (211) plane of the flower was slightly lower than the other. All the peaks in the XRD patterns were indexed for the cassiterite phase (space groupP42/mnm) of SnO2 (JCPDS file 41-1445). The lattice parameters calculated from the XRD patterns were a = 4.7380 Å and c = 3.1865 Å. No impurity or secondary phase could be detected in the XRD pattern of both morphologies. The energy dispersive X-ray (EDX) spectra of the SnO2 flower also confirmed the absence of impurities. Fig. 3 (B) and (C) combine the core-level XPS spectra of both morphologies. The Sn-3d level binding energies (BE) of both morphologies were 487.2 eV and 496 eV, which are assigned to Sn-3d5/2 and Sn-3d3/2 core levels of Sn4+, respectively. The O-1s level BE of oxygen were 531.0 eV and 532 eV, which are assigned to the oxygen (O2−) anion in Sn–O bonds and surface oxygen, respectively. The BEs of Sn4+ ions are in close agreement with the values reported for the cassiterite phase of SnO2.41 All these characteristics lead to the conclusion that the flowers are chemically similar to the fibers.
3.4 Mott–Schottkey analysis and evaluation of electron density
To understand the difference in electrical properties of the two morphologies, Mott–Schottkey (MS) plots were developed from the EIS measurements in the dark.39,42Fig. 4 shows the MS plots determined from EIS plots for the two morphologies sintered onto fluorine doped SnO2 substrates in the presence of acetonitrile containing 0.1 M lithium iodide, 0.03 M iodine, 0.5 M 4-tert-butylpyridine and 0.6 M 1-propyl-2,3-dimethylimidazolium iodide electrolyte. Sigmoidal plots were observed with an overall shape consistent with the n-type semiconductors with similar flat band potentials,43i.e., the potential corresponding to the situation in which there is no charge accumulation in the semiconductor such that there is no band bending, which could be obtained from the x-intercept of the linear portion. The electron density (nD) obtained from the slope of the 1/C2vs. V curve of the flowers (1.054 × 1021 cm−3) was an order of magnitude higher for than that of the fibers (0.868 × 1020 cm−3). The enhanced crystallinity achieved by manipulating the precursor concentration is thought to be the reason for enhanced nD of the flower structure.
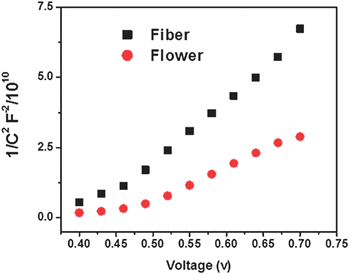 |
| | Fig. 4 Mott–Schottky plot of flowers and fibers. | |
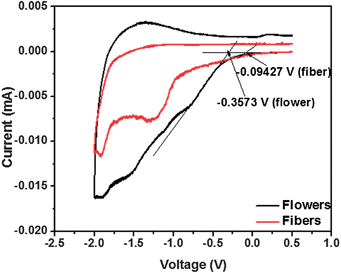
High nD of the flower structure was also confirmed with the cyclic voltammetry measurements, which is displayed in the area of the cyclic voltammograms (CV).44Fig. 5 shows the CV of the two morphologies, which clearly show that flowers have superior electrochemical properties than the other. The specific capacitance calculated from the area CV curves of the flowers was more than twice that of the fibers, which is expected to arise from the enhanced crystallinity of the flowers.
3.5 Performance of the flowers and fibers in DSCs
Fig. 6 shows the current density (JSC) vs. voltage (V) plots as a function of cell thickness fabricated using both fibers and flowers. For a cell of 15 μm thickness, flower-based DSC showed a record VOC ∼ 700 mV, JSC ∼ 7.30 mA cm−2, fill factor (FF) ∼ 59.6% and η of ∼3.0%. For a cell of similar thickness, the fiber based DSC gave VOC ∼ 600 mV, JSC of ∼3.0 mA cm−2, FF ∼ 38.3 and η ∼ 0.71%, i.e., the flower based device show ∼140% increased JSC, ∼16% increased VOC and ∼55% increased FF than the fiber based device.
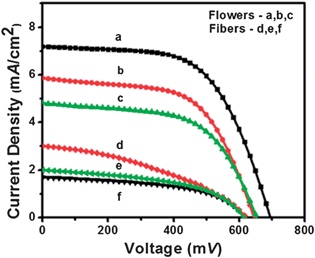 |
| | Fig. 6 Current–voltage characteristics of the solar cells made using fibers and flowers. Thicknesses of the samples are a: 15 μm, b: 12 μ; and c: 10 μm for flower and d: 15 μm, e: 11 μm and f: 9 μm for fibers, respectively. | |
The difference in electrical property of the two types of cells was determined from the shunt (RSH) and series (RS) resistances from the inverse of slops at JSC and VOC of the I–V curves. The RSH is an estimation of internal currents in the cell and is a measure of back electron transfer and other charge recombination processes in DSCs whereas RS denotes the resistance for charge collection.18,45 A high RSH (>1000 Ω) and low RS (<0.01 Ω) are therefore preferred for high fill factor and efficiency of the solar cells. The best performing flower-based cell gave RSH ∼ 1600 and RS ∼ 0.001 Ω, which indicates that the flower-based cells were of high quality with lower charge recombination. On the other hand, the cells made using the fibers showed inferior performances. The RSH and RS of the fiber-based devices were ∼600 and 143 Ω, respectively, thereby accounting for its inferior performance.
3.5.1 Origin of high JSC in the flower based device.
The photoelectric conversion efficiency of DSCs is generally expressed aswhere α is the strength of absorption, Φin is the injection efficiency, and ηC is the charge collection efficiency. As there is no difference in the flat band potential of flowers and fibers, Φin is assumed to be similar. The two types of DSCs were fabricated using similar dyes so their absorption cross-section does not differ. However, dye-loading calculated from desorption test for flowers and fibers were 7.8 and 5.6 mmoles, respectively, i.e., the dye-loading of the device based on the flower structure is only 1.4 times higher than that based on the fibers. If we assume that one photon absorbed by the dye injects one electron to SnO2, then the dye-loading measurements gives the number of electrons received by flowers and fibers to be 7.8 × 10¹⁶ and 5.7 × 10¹⁶ per cycle, respectively. Despite this small variation in the received electrons, the JSC of the devices using the flowers were found to be higher by a factor of ∼2.5 than that of the devices using the fibers, which means that the observed enhanced JSC results from the enhanced charge collection efficiency, ηc, of the flower based device.
The difference in collection efficiencies of the two types of DSCs were studied from the photocurrent action spectra of the devices fabricated using the two types of cells. Fig. 7 shows the action spectra of the two types of devices. The spectra display significant enhancement in the incident photon to current conversion efficiency (IPCE) of the devices based on flowers. The highest IPCE for the devices based on the fibers and flowers were ∼12% and 42%, respectively. The improvement can be attributed to the enhanced electron density and charge transport efficiency as well as a slightly higher amount of the dye-loaded onto the flower based device. However, it is reported that an increase in the dye-loading of 1.4 times results only in an increase in IPCE of ∼3.5%.46,47 In the present case IPCE of the flower based devices increased by ∼30% compared to that of the fibers thereby indicating the enhanced charge transport kinetics in the flower structure. To check the consistency of the results between the photo action spectra and I–V measurements, the JSC of the devices were calculated from their IPCE spectra using the relation.
| |  | (5) |
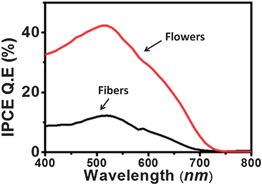 |
| | Fig. 7 Photoaction spectra (IPCE) of the DSCs using flowers and fibers. | |
The integrated IPCE over the entire wavelength (λ) was used to calculate the JSC. The calculated JSC of the flower and fiber based devices were 7.57 and 2.97 mA cm−2, respectively. These values closely match with their measured JSC from the I–V measurements, i.e., 7.3 and 3 mA cm−2, respectively.
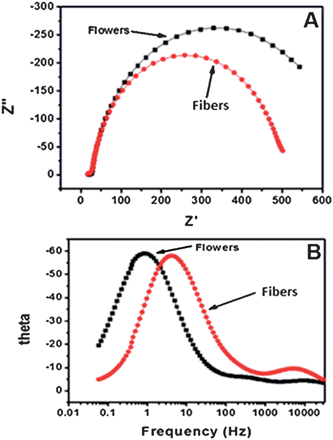
To determine the electron lifetime, which resulted in enhanced ηc, the EIS spectra of the DSCs were recorded in the dark under forward bias of 0.61 V (Fig. 8). The Nyquist plots (Fig. 8(A)) show that radius of the right semi-circle of the flower based device is larger compared to that made using the fibers. The larger semi-circle indicates an increase in the charge transfer resistance and therefore, an increased electron lifetime. The lifetime τn can be calculated from the Bode plots (Fig. 8(B)) using the equation τn = 1/2πfc, where fc is the peak frequency, which for the flowers and fibers were 0.84 and 4.22 Hz at 0.61 V, respectively. These frequencies correspond to a τn of 0.189 s and 0.0377 s, respectively, i.e., the τn of the flowers is an order of magnitude longer than that of the fibers. The longer τn of the device fabricated using the flower-like morphology indicates more effective suppression of the back reaction between electrons in its conduction band and  ions in the electrolyte. The increased τn is thought to be the source of high JSC and η of the device fabricated using the flower-like morphology.
3.5.2 Origin of high VOC in the flower based device.
To the best of our knowledge, the VOC obtained using the flower-morphology (∼700 mV) is the highest so far achieved using SnO2. The origin of high VOC in flower based DSCs could be understood from the kinetic equation of DSCs under steady state condition, i.e., when the electron injection from the dye to SnO2 is equal to the electron transfer from the counter electrode to the electrolyte, given by| |  | (6) |
In the above equation Jin is the flux of the injected electrons, krec[ ] is the rate constant of iodide reduction and ncb is the conduction band electron density in the dark. Therefore, the large difference in the VOC would partially result from the difference in the iodide reduction, which occurs in two pathways. The first pathway is the reduction by the counter electrode, which is same for similar device geometry. The second is the recombination pathway, i.e., the electron in the SnO2 directly reduces the iodide ions, which account for the majority of the carrier loss. High internal resistance (RH ∼ 1600 Ω) for this back electron transfer from SnO2 to electrolyte measured for the flower based device, as well as high nD, accounts for the observed high VOC and FF. Remember that τn through the flowers was much higher than that through the fibers, which accounts for the faster charge collection before recombination and resulted in higher VOC.
Conclusions
In conclusion, tin oxide nanoflowers were developed by a scalable nanofabrication process, electrospinning, by manipulating the precursor concentration for the first time. The flowers thus synthesized have an order of magnitude higher electron density compared with the conventional fibers synthesized using a normal concentration of Sn precursor. The dye-sensitized solar cells fabricated using the flowers showed a record open circuit voltage and photoconversion efficiency. The electrospun tin oxide nanoflowers thus provide promising opportunities as a superior transparent conducting oxide for fabrication of nanoelectronic devices.
Acknowledgements
RJ and MMY acknowledge the UMP internal grant RDU 100337.
References
- T. W. Hamann and J. W. Ondersma, Energy Environ. Sci., 2011, 4, 370 RSC.
- Q. Wang, S. Ito, M. Grätzel, F. Fabregat-Santiago, I. Mora-Sero, J. Bisquert, T. Bessho and H. Imai, J. Phys. Chem. B, 2006, 110, 25210 CrossRef CAS.
- S. R. Gajjela, K. Ananthanarayanan, C. Yap, M. Grätzel and P. Balaya, Energy Environ. Sci., 2010, 3, 838 RSC.
- Z. Ning, Y. Fu and H. Tian, Energy Environ. Sci., 2010, 3, 1170 RSC.
- T. W. Hamann, R. A. Jensen, A. B. F. Martinson, H. Van Ryswyk and J. T. Hupp, Energy Environ. Sci., 2008, 1, 66 RSC.
- A. Hagfeldt, G. Boschloo, L. Sun, L. Kloo and H. Pettersson, Chem. Rev., 2010, 110, 6595–6663 CrossRef CAS.
- S. Ito, S. M. Zakeeruddin, R. Humphry-Baker, P. Liska, R. Charvet, P. Comte, M. K. Nazeeruddin, P. Péchy, M. Takata, H. Miura, S. Uchida and M. Grätzel, Adv. Mater., 2006, 18, 1202 CrossRef CAS.
- G. Boschoo and A. Hagfeldt, Acc. Chem. Res., 2009, 42, 1819–1826 CrossRef CAS.
- R. Jose, V. Thavasi and S. Ramakrishna, J. Am. Ceram. Soc., 2009, 92, 289 CrossRef.
- G. K. Mor, O. K. Varghese, M. Paulose, K. Shankar and C. A. Grimes, Sol. Energy Mater. Sol. Cells, 2006, 90, 2011–2075 CrossRef CAS.
- J. Bisquert, F. Fabregat-Santiago, I. Mora-Seró, G. Garcia-Belmonte, E. M. Barea and E. Palomares, Inorg. Chim. Acta, 2008, 361, 684 CrossRef CAS.
- L. Grinis, S. Kotlyar, S. Rühle, J. Grinblat and A. Zaban, Adv. Funct. Mater., 2010, 20, 282 CrossRef CAS.
- M. Adachi, Y. Murata, I. Okada and S. Yoshikawa, J. Electrochem. Soc., 2003, 150, G488 CrossRef CAS.
- J. B. Baxter and E. S. Aydil, Appl. Phys. Lett., 2005, 86, 053114 CrossRef.
- B. A. Gregg, J. Phys. Chem. B, 2003, 107, 4688 CrossRef CAS.
- S. Gubbala, V. Chakrapani, V. Kumar and M. K. Sunkara, Adv. Funct. Mater., 2008, 18, 2411 CrossRef CAS.
- M. Law, L. E. Greene, J. C. Johnson, R. Saykally and P. Yang, Nat. Mater., 2005, 4, 455 CrossRef CAS.
- F. Fabregat-Santiago, J. Bisquert, E. Palomares, L. Otero, D. Kuang, S. M. Zakeeruddin and M. Grätzel, J. Phys. Chem. C, 2007, 111, 6550 CrossRef CAS.
- J. Bisquert, F. Fabregat-Santiago, I. Mora- Seró, G. Garcia-Belmonte and S. Giménez, J. Phys. Chem. C, 2009, 113, 17278 CrossRef CAS.
- H. Q. Chiang, J. F. Wager, R. L. Hoffman, J. Jeong and D. A. Keszler, Appl. Phys. Lett., 2005, 86, 013503 CrossRef.
- D. S. Ginley and C. Bright, MRS Bull., 2000, 25, 15–21 CAS.
- T. Minami, Semicond. Sci. Technol., 2005, 20, S35 CrossRef CAS.
- M. S. Arnold, P. Avouris, Z. W. Pan and Z. L. Wang, J. Phys. Chem. B, 2003, 107, 659–663 CrossRef CAS.
- M. Grätzel, Nature, 2001, 414, 338 CrossRef CAS.
- S. Chappel and A. Zaban, Sol. Energy Mater. Sol. Cells, 2002, 71, 141 CrossRef CAS.
- S. Gubbala, H. B. Russell, H. Shah, B. Deb, J. Jasinski, H. Rypkema and M. K. Sunkara, Energy Environ. Sci., 2009, 2, 1302 RSC.
- C. Nasr, P. V. Kamat and S. Hotchandani, J. Phys. Chem. B, 1998, 102, 10047 CrossRef CAS.
- N. Nang Dinh, M. C. Bernard, A. Hugot-Le Goff, T. Stergiopoulos and P. Falaras, C. R. Chim., 2006, 9, 676 CrossRef CAS.
- G. Vilaça, B. Jousseaume, C. Mahieux, C. Belin, H. Cachet, M. C. Bernard, V. Vivier and T. Toupance, Adv. Mater., 2006, 18, 1073 CrossRef CAS.
- G. R. A. Kumara, A. Konno and K. Tennakone, Chem. Lett., 2001, 180 CrossRef CAS.
- J. Bandara and K. Tennakone, J. Colloid Interface Sci., 2001, 236, 375 CrossRef CAS.
- T. Krishnamoorthy, V. Thavasi, G. M. Subodh and S. Ramakrishna, Energy Environ. Sci., 2011, 4, 2807 RSC.
- S. Ramakrishna, R. Jose, P. S. Archana, A. S. Nair, R. Balamurugan, J. Venugopal and W. E. Teo, J. Mater. Sci., 2010, 45, 6283–6312 CrossRef CAS.
- A. Greiner and J. H. Wendorff, Angew. Chem., Int. Ed., 2007, 46, 5670 CrossRef CAS.
- D. Li and Y. Xia, Adv. Mater., 2004, 16, 1151 CrossRef CAS.
- W. Sigmund, J. Yuh, H. Park, V. Maneeratana, G. Pyrgiotakis, A. Daga, J. Taylor and J. C. Nino, J. Am. Ceram. Soc., 2006, 89, 395 CrossRef CAS.
- D. H. Reneker and A. L. Yarin, Polymer, 2008, 49, 2387–2425 CrossRef CAS.
- V. Thavasi, G. Singh and S. Ramakrishna, Energy Environ. Sci., 2008, 1, 205–221 RSC.
- F. Fabregat-Santiago, G. Garcia-Belmonte, J. Bisquert, P. Bogdanoff and A. Zaban, J. Electrochem. Soc., 2003, 150, E293–E298 CrossRef CAS.
- D. Li and Y. Xia, Nano Lett., 2003, 3, 555 CrossRef CAS.
- K. Ayan, Y. Jianyong, D. Mitra, A. S. Michael, K. Jyothi and M. Meyyappan, Nanotechnology, 2009, 20, 065704 CrossRef.
- M. Turrión, J. Bisquert and P. Salvador, J. Phys. Chem. B, 2003, 107, 9397 CrossRef CAS.
- G. Wang, W. Lu, J. Li, J. Choi, Y. Jeong, S. Y. Choi, J. B. Park, M. K. Ryu and K. Lee, Small, 2006, 2, 1436–1439 CrossRef CAS.
- V. G. Kytin, J. Bisquert, I. Abayev and A. Zaban, Phys. Rev. B, 2004, 70.
- F. Fabregat-Santiago, J. Bisquert, G. Garcia-Belmonte, G. Boschloo and A. Hagfeldt, Sol. Energy Mater. Sol. Cells, 2005, 87, 117 CrossRef CAS.
- T. Ma, M. Akiyama, E. Abe and I. Imai, Nano Lett., 2005, 5, 2543–2547 CrossRef CAS.
- T. Ma, K. Inoue, K. Yao, H. Noma, T. Shuji, E. Abe, J. Yu, X. Wang and B. Zhang, J. Electroanal. Chem., 2002, 537, 31 CrossRef CAS.
|
| This journal is © The Royal Society of Chemistry 2012 |
Click here to see how this site uses Cookies. View our privacy policy here. ![[thin space (1/6-em)]](https://www.rsc.org/images/entities/char_2009.gif) :
:![[thin space (1/6-em)]](https://www.rsc.org/images/entities/char_2009.gif) 40) curve. The derived binding energies (BE) have accuracy better than ±0.1 eV.
40) curve. The derived binding energies (BE) have accuracy better than ±0.1 eV.
![[thin space (1/6-em)]](https://www.rsc.org/images/entities/char_2009.gif) :
:![[thin space (1/6-em)]](https://www.rsc.org/images/entities/char_2009.gif) 1 volume mixture of acetonitrile and tert-butanol and a ruthenium-based dye [RuL2(NCS)2·2H2O; L = 2, 2′-bipyridyl-4,4′-dicarboxylic acid (0.5 mM), N3 Solaronix)] for 24 h at room temperature. The dye-sensitized samples were then washed in ethanol to remove unanchored dye and dried in air. The dye-anchored electrodes were sealed using a 50 μm spacer. Acetonitrile containing 0.1 M lithium iodide, 0.03 M iodine, 0.5 M 4-tert-butylpyridine and 0.6 M 1-propyl-2,3-dimethyl imidazolium iodide was used as the electrolyte. A Pt sputtered FTO glass was used as the counter electrode. Photocurrent measurements were carried out by a XES-151 S solar simulator (San Ei, Japan) under AM1.5G conditions. The level of standard irradiance (100 mW cm−2) was set with a calibrated c-Si reference solar cell. Data acquisition was facilitated by an Autolab PGSTAT30 (Eco Chemie B.V., The Netherlands) integrated with a potentiostat. IPCE measurements were done using the standard kit from Oriel Instruments (model QE-PV-SI, Silicon detector, Newport Corporation, US). The AC responses of the cells were studied by electrochemical impedance spectroscopy using the Autolab PGSTAT30.
1 volume mixture of acetonitrile and tert-butanol and a ruthenium-based dye [RuL2(NCS)2·2H2O; L = 2, 2′-bipyridyl-4,4′-dicarboxylic acid (0.5 mM), N3 Solaronix)] for 24 h at room temperature. The dye-sensitized samples were then washed in ethanol to remove unanchored dye and dried in air. The dye-anchored electrodes were sealed using a 50 μm spacer. Acetonitrile containing 0.1 M lithium iodide, 0.03 M iodine, 0.5 M 4-tert-butylpyridine and 0.6 M 1-propyl-2,3-dimethyl imidazolium iodide was used as the electrolyte. A Pt sputtered FTO glass was used as the counter electrode. Photocurrent measurements were carried out by a XES-151 S solar simulator (San Ei, Japan) under AM1.5G conditions. The level of standard irradiance (100 mW cm−2) was set with a calibrated c-Si reference solar cell. Data acquisition was facilitated by an Autolab PGSTAT30 (Eco Chemie B.V., The Netherlands) integrated with a potentiostat. IPCE measurements were done using the standard kit from Oriel Instruments (model QE-PV-SI, Silicon detector, Newport Corporation, US). The AC responses of the cells were studied by electrochemical impedance spectroscopy using the Autolab PGSTAT30.

 are the solubility of the particle with radius r and of the bulk material, respectively; γ is the surface tension; Vm is the molar volume of the solid. The supersaturation achieved by heating the fibers results in nucleation of the SnO2 nanocrystals thereby consuming a large fraction of the precursors. The nanocrystals then grow in the diffusion controlled regime with the leftover precursor concentration. Flux of the precursor (Jdiff) reaching a growing particle is given by the Fick's law:

 , and (iii) diameter of the final inorganic nanofibers. Li and Xia experimentally demonstrated that final diameter of the inorganic fibers can be reduced by decreasing the precursor concentration in the electrospun polymeric fibers.40 In the event of enhancement in activation energy with precursor concentration, an optimal threshold concentration of precursors is required for the formation of continuous fibers. On the other hand, if the concentration of the precursors exceeds beyond the optimal concentration for fibrous morphology, a larger number of nuclei are formed upon annealing. Subsequent growth results in a non-equilibrium state such that all the crystallites cannot be accommodated within the given fibrous volume. The fibrous structure therefore undergoes disruption in the presence of the polymer and leads to non-equilibrium morphologies upon further annealing as shown schematically in Fig. 1.





 ions in the electrolyte. The increased τn is thought to be the source of high JSC and η of the device fabricated using the flower-like morphology.

 ] is the rate constant of iodide reduction and ncb is the conduction band electron density in the dark. Therefore, the large difference in the VOC would partially result from the difference in the iodide reduction, which occurs in two pathways. The first pathway is the reduction by the counter electrode, which is same for similar device geometry. The second is the recombination pathway, i.e., the electron in the SnO2 directly reduces the iodide ions, which account for the majority of the carrier loss. High internal resistance (RH ∼ 1600 Ω) for this back electron transfer from SnO2 to electrolyte measured for the flower based device, as well as high nD, accounts for the observed high VOC and FF. Remember that τn through the flowers was much higher than that through the fibers, which accounts for the faster charge collection before recombination and resulted in higher VOC.