Insight into the catalytic mechanism of glycerol hydrogenolysis using basal spacing of hydrotalcite as a tool†
Binbin
Zhao
ab,
Chengcheng
Li
ab and
Chunli
Xu
*ab
aKey Laboratory of Applied Surface and Colloid Chemistry, Shaanxi Normal University, Ministry of Education, Xi'an 710062, PR China
bSchool of Chemistry and Chemical Engineering, Shaanxi Normal University, Chang'an South Road 199, Xi'an 710062, PR China. E-mail: xuchunli@snnu.edu.cn; Fax: +86-29-85307774; Tel: +86-29-81530779
First published on 2nd May 2012
Abstract
Information on the catalytic mechanism is crucial for understanding heterogeneous catalysis of glycerol hydrogenolysis. In this work, we proposed a simple and effective method to study the catalytic mechanism of glycerol hydrogenolysis with Cu/Mg–Al mixed-oxide as catalyst. This method is based on the memory effect of the hydrotalcite-derived Mg–Al mixed-oxide and the tunable property of hydrotalcite interlayer distance. The experimental results showed that the basal spacing of hydrotalcite could work as an effective tool to reflect the relationship between desorption of products and reaction conditions. With this tool, the effect of H2 pressure on glycerol hydrogenolysis was elucidated. It was found that H2 pressure affected desorption and yield of products.
1. Introduction
Increasing energy costs and environmental concerns have emphasized the need to produce renewable fuels and chemicals. It is generally accepted that the primary source of renewable organic fuels, chemicals, and materials will be from plant derived biomass.1 To date, major advances have been made in the transesterification of vegetable oil-based fatty acids to biodiesel, which is already at an advanced stage of commercialization. The utilization of the relatively large amount of glycerol side products (10 wt%) formed in biodiesel manufacturing is a major factor in the overall cost effectiveness of the process. Therefore, use of this glycerol as a renewable feedstock to produce value added chemicals is crucial to biorefinery economics.2–6 Among the different possible transformations of glycerol, the selective conversion to 1,2-propanediol, which is usually produced from petroleum derivatives, presents a special interest (Scheme 1).7–18 | ||
| Scheme 1 Hydrogenolysis of glycerol. | ||
Hydrogenolysis of glycerol to 1,2-propanediol has been reported previously using several supported transition metal catalysts such as Ru,7–9 Pt,8–12 Cu,13–15 Ni,16 and some bimetallic catalysts consisting of Pt–Ru, Au–Ru17 and Ru–Re.18 In this heterogeneous catalysis as to glycerol hydrogenolysis, the usual reported data are conversions obtained at different process conditions and with different catalysts. Little information is available on the catalytic mechanism of glycerol hydrogenolysis.19,20 However, information on the catalytic mechanism is crucial for understanding a reaction system of heterogeneous catalysis.
In recent years, hydrotalcite-like compounds (hereafter indicated as HT) have many applications, including as catalyst supports for glycerol hydrogenolysis.14,15,21–28 HT are layered double hydroxides belonging to the class of anionic clays found in Nature, in which cationic layers and anionic interlayers show a basal spacing of 7.8 Å (Scheme 2). The interactions between the metal hydroxide layers are much weaker than the intralayer bonding, leading to swelling of the unit cell c-parameter (perpendicular to the layers, basal spacing) with adsorption of energetically favorable species. HT interlayers thus serve as excellent hosts for a broad range of organic and inorganic charge-balancing anions and a variety of neutral chemical species, forming the structure of guest-intercalated HT (hereafter indicated as HT-guest). The basal spacing of HT-guest changes with the size of guest species. The formation of HT can be identified easily by X-ray diffraction studies. The (003) reflection can be used to calculate the basal spacing, d, between the layers.24–26 Thermal decomposition of HT leads to the formation of mixed oxides. These mixed oxides show a memory effect, a property by which they can recover the original lamellar structure if they come into contact with water.27,28
 | ||
| Scheme 2 Structure of hydrotalcite. | ||
Water, as solvent and by-product, is one component of the reaction system for aqueous glycerol hydrogenolysis (Scheme 1).9,10 In the reaction system, the mixed-metal oxides, which are originated from HT, could in situ reconstruct into the structure of HT. Furthermore, the basal spacing of the reconstructed HT may be enhanced by the intercalation of guest species such as reactants, reactive intermediates, or products. The basal spacing of reconstructed HT could supply effective information about the catalytic mechanism of glycerol hydrogenolysis. In this work, metal Cu was loaded on the hydrotalcite-derived Mg–Al mixed oxides to prepare Cu/Mg–Al mixed-oxide catalysts, and the Cu/Mg–Al mixed-oxide catalysts were used in glycerol hydrogenolysis. We determined the structural change of the catalysts to study the catalytic mechanism based on the basal spacing of HT. Using the basal spacing of the reconstructed hydrotalcite as an effective tool, the effect of H2 pressure on glycerol hydrogenolysis was elucidated.
2. Experimental section
2.1 Preparation of catalysts
![[thin space (1/6-em)]](https://www.rsc.org/images/entities/char_2009.gif) :
:![[thin space (1/6-em)]](https://www.rsc.org/images/entities/char_2009.gif) M3+atomic ratio of 3
M3+atomic ratio of 3![[thin space (1/6-em)]](https://www.rsc.org/images/entities/char_2009.gif) :
:![[thin space (1/6-em)]](https://www.rsc.org/images/entities/char_2009.gif) 1 were prepared using a standard aqueous co-precipitation method, as described in our previous report.29 The M2+ used was Mg2+, or the mixture of Cu2+ and Mg2+; and the M3+ used was Al3+. An aqueous solution (300 mL) of the metal nitrates in a desired M2+
1 were prepared using a standard aqueous co-precipitation method, as described in our previous report.29 The M2+ used was Mg2+, or the mixture of Cu2+ and Mg2+; and the M3+ used was Al3+. An aqueous solution (300 mL) of the metal nitrates in a desired M2+![[thin space (1/6-em)]](https://www.rsc.org/images/entities/char_2009.gif) :
:![[thin space (1/6-em)]](https://www.rsc.org/images/entities/char_2009.gif) M3+ molar ratio with a total concentration of 1.5 M was mixed slowly with continuous stirring with an alkaline solution of Na2CO3–NaOH. The molar amount of Na2CO3 was twice that of M3+. The pH of the mixture was kept constant, typically at values between 9 and 10, by adjusting the flow rate of the alkaline solution. The temperature was maintained at 60 °C. Following this addition, which resulted in the formation of a heavy slurry, the mixture was aged at 60 °C for 18 h with stirring, to facilitate the selective growth of the precipitated HT phase. The slurry was then cooled to 25 °C, filtered, and washed with water until the pH value of the filtrate was near 7. The precipitate was dried at 90 °C for 16 h. The resulting material was CO32−-intercalated HT (hereafter indicated as HT-CO32−). Following this method, the prepared HT-CO32− were Cu/Mg–Al HT-CO32− and Mg–Al HT-CO32−.
M3+ molar ratio with a total concentration of 1.5 M was mixed slowly with continuous stirring with an alkaline solution of Na2CO3–NaOH. The molar amount of Na2CO3 was twice that of M3+. The pH of the mixture was kept constant, typically at values between 9 and 10, by adjusting the flow rate of the alkaline solution. The temperature was maintained at 60 °C. Following this addition, which resulted in the formation of a heavy slurry, the mixture was aged at 60 °C for 18 h with stirring, to facilitate the selective growth of the precipitated HT phase. The slurry was then cooled to 25 °C, filtered, and washed with water until the pH value of the filtrate was near 7. The precipitate was dried at 90 °C for 16 h. The resulting material was CO32−-intercalated HT (hereafter indicated as HT-CO32−). Following this method, the prepared HT-CO32− were Cu/Mg–Al HT-CO32− and Mg–Al HT-CO32−.
The Cu/Mg–Al HT-CO32− samples, which contained Cu2+ and were prepared by co-precipitation, were calcined at 500 °C for 3 h in static air, to form the corresponding mixed oxides containing Cu2+. After reduction in hydrogen, the supported Cu catalysts, which were prepared by a co-precipitation method, were obtained.
The calcined sample of Mg–Al HT-CO32− (Mg(Al)O) was used for impregnation of copper nitrate by a wet impregnation method using an excess amount of water. The solution of copper nitrate (0.54 g in 20 mL of deionized water) was added slowly, under stirring, to the calcined sample of Mg–Al HT-CO32− (2.0 g). The mixture was then dried at 90 °C for 12 h and calcined at 500 °C for 3 h. After reduction in hydrogen, the supported Cu catalysts were obtained.
All the supported Cu catalysts used in this study were reduced prior to the reaction in a tube furnace by passing a stream of hydrogen over the catalyst (mixed oxides) bed at 300 °C for 3 h. The reduced Cu catalysts were labeled Cu/Mg(Al)O.
2.2 Catalyst characterization
The surface area and pore character of the catalysts were determined using a Micromeritics ASAP 2020 instrument. The sample was degassed at 250 °C for 4 hours in N2 prior to surface area measurement. The nitrogen adsorption and desorption isotherms were measured at −196 °C. Specific surface areas of the catalysts were determined by nitrogen adsorption data in the relative pressure range from 0.06 to 0.30 using the BET (Brunauer–Emmett–Teller) equation. Total pore volumes were estimated from the amount of nitrogen adsorbed at a relative pressure of 0.995. Pore volume and pore-size distribution curves were obtained from the analysis of the desorption branches of the nitrogen isotherms using the BJH (Barrett–Joyner–Halenda) method.CO2 temperature programmed desorption (TPD) experiments were performed using a Micromeritics ASAP 2020 instrument loaded with 100 mg of sample. The sample was pre-treated under He (20 mL min−1) ramping at 15 °C min−1 up to 600 °C where it was held for 30 min, and then cooled to 40 °C prior to the adsorption of CO2. After the adsorption of CO2 (25 mL min−1) for 60 min, the catalyst was flushed with He (20 mL min−1) for 60 min at 40 °C to remove the physisorbed gas from the surface of the catalyst, and the desorption profile was recorded employing a heating ramp of 10 °C min−1 between 40 to 600 °C where it was held for 30 min.
X-ray diffraction patterns were recorded on a D/Max-3C X-ray powder diffractometer (Rigaku Co., Japan), using a Cu-Kα source fitted with an Inel CPS 120 hemispherical detector.
2.3 Catalytic hydrogenolysis of glycerol
The reaction of glycerol hydrogenolysis was carried out in a 75 mL stainless steel autoclave (Parr Instrument Co., USA) equipped with a temperature controller. The standard activity test was conducted under the following conditions: 210 °C reaction temperature, 9 MPa hydrogen pressure, 24 h reaction time, 80% (volume ratio of glycerol/(glycerol + water)) glycerol aqueous solution (15 mL), and 0.54 g of catalysts (catalyst/glycerol weight ratio, 3.6 wt%). The stirring speed was set constant at 600 rpm throughout the reaction. Reaction temperature and reacting atmosphere were changed to investigate the dependence of conversion and selectivity on the operating conditions. In addition, the concentration of glycerol aqueous solution was changed to investigate the effect of water content.After reaction, the product sample was transferred to a 100 mL volumetric flask. The samples were prepared for analysis by adding a known amount of internal standard (n-butanol) into the volumetric flask. Ethanol was used as solvent to dilute the product sample. These samples were analyzed using a gas chromatograph (Shimadzu 2014) equipped with a flame ionization detector and a Rtx-Wax capillary column (30 m × 0.32 mm × 0.5 μm).
3. Results and discussion
3.1 BET surface area and pore size
As shown in Table 1, Cu/Mg(Al)O had high surface area (128–140 m2 g−1), which was not affected by the metal ratio of Cu![[thin space (1/6-em)]](https://www.rsc.org/images/entities/char_2009.gif) :
:![[thin space (1/6-em)]](https://www.rsc.org/images/entities/char_2009.gif) Mg
Mg![[thin space (1/6-em)]](https://www.rsc.org/images/entities/char_2009.gif) :
:![[thin space (1/6-em)]](https://www.rsc.org/images/entities/char_2009.gif) Al. Fig. 1 shows nitrogen physisorption isotherms and BJH pore size distribution for Cu/Mg(Al)O. The isotherm of Cu/Mg(Al)O has the characteristic Type IV shape. The Type IV isotherm and pore size distribution suggested that Cu/Mg(Al)O was a mesoporous material. The hysteresis loop was in the shape of Type A, suggesting that Cu/Mg(Al)O contained the open-ended cylindrical pores.
Al. Fig. 1 shows nitrogen physisorption isotherms and BJH pore size distribution for Cu/Mg(Al)O. The isotherm of Cu/Mg(Al)O has the characteristic Type IV shape. The Type IV isotherm and pore size distribution suggested that Cu/Mg(Al)O was a mesoporous material. The hysteresis loop was in the shape of Type A, suggesting that Cu/Mg(Al)O contained the open-ended cylindrical pores.
 | ||
| Fig. 1 Nitrogen physisorption isotherms (□, adsorption; ○, desorption) and BJH pore size distribution for Cu/Mg(Al)O catalyst. | ||
3.2 The basic strengths and basicity of the catalysts
It was already reported that the activity of Cu catalysts was affected by their basic strength and basicity.8 For this reason, the basic strengths and basicity of prepared catalysts were determined by a CO2 TPD method. Fig. 2 shows the rate of CO2 desorption, normalized to the sample loading, as a function of temperature for Cu/Mg(Al)O catalysts. The desorption profiles for the Cu/Mg(Al)O catalyst showed two apparent desorption peaks with the maximum at 100 °C and 250 °C, respectively. On this basis, Cu/Mg(Al)O had the basic site of weak and medium strength.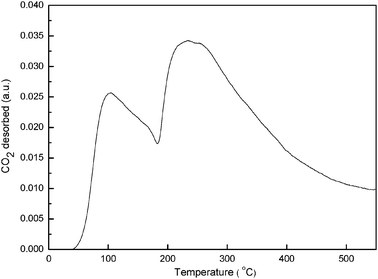 | ||
| Fig. 2 CO2-TPD pattern of Cu/Mg(Al)O catalyst. | ||
3.3 Effect of reaction variables
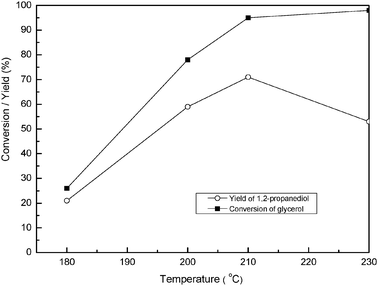
Five reaction variables were tested. The details about the effect of reaction time and catalyst amount are given in the ESI† (Fig. S1 and S2). The data about other reaction variables are given below. | ||
| Fig. 5 The conversion/yield change versus glycerol concentration in the presence of Cu/MgAl(O) catalyst. (A) H2 pressure 9 MPa and reaction temperature 210 °C; (B) H2 pressure 4 MPa and reaction temperature 200 °C. Reaction conditions: 3 wt% of catalyst, reaction time 24 h, glycerol aqueous solution (15 mL). | ||
3.4 Reusability of catalyst
We attempted to reuse the Cu/Mg(Al)O catalyst by the method as follows. The used Cu/Mg(Al)O catalyst was separated from the reaction solution by centrifugation. It was taken as the catalyst for the repeated reactions without any further treatment. The repeated reactions were carried out under the same reaction conditions as those of the previous reaction. The catalyst was investigated for eight successive uses and the results are shown in Fig. 6. The Cu/Mg(Al)O catalyst can be repeatedly used 8 times with no apparent loss of activity (glycerol conversion, >95%). The yield of 1,2-propanediol was also unchanged when the catalyst was used less than 5 times. However, the yield decreased slightly after the catalyst was used more than 6 times. | ||
| Fig. 6 Reusability of catalysts. Reaction conditions: 6 wt% of Cu/Mg(Al)O catalyst, 100% glycerol (15 mL), reaction time 24 h, reaction temperature 210 °C, hydrogen pressure 9 MPa. | ||
3.5 Catalytic mechanism
 | ||
| Fig. 7 XRD patterns of (a) Cu–Mg–Al HT-CO32−, (b) Cu–Mg–Al HT-CO32− after calcination, (c) Cu/Mg(Al)O catalyst before reaction, (d) Cu/Mg(Al)O catalyst after reaction. Reaction conditions: 6 wt% of catalyst, 80% glycerol aqueous solution (15 mL), reaction temperature 200 °C, hydrogen pressure 4 MPa. | ||
Cu/Mg(Al)O catalysts, containing different ratios of Cu![[thin space (1/6-em)]](https://www.rsc.org/images/entities/char_2009.gif) :
:![[thin space (1/6-em)]](https://www.rsc.org/images/entities/char_2009.gif) Mg
Mg![[thin space (1/6-em)]](https://www.rsc.org/images/entities/char_2009.gif) :
:![[thin space (1/6-em)]](https://www.rsc.org/images/entities/char_2009.gif) Al and prepared by a co-precipitation method or an impregnation method, were tested. The XRD patterns of the various Cu/Mg(Al)O catalysts after reaction are shown in Fig. S3 (ESI†). All the used catalysts displayed, in addition to Cu, the structure of HT-guest. This means that the formation of HT-guest was not affected by the preparation methods (i.e., co-precipitation method or impregnation method) and ratio of Cu
Al and prepared by a co-precipitation method or an impregnation method, were tested. The XRD patterns of the various Cu/Mg(Al)O catalysts after reaction are shown in Fig. S3 (ESI†). All the used catalysts displayed, in addition to Cu, the structure of HT-guest. This means that the formation of HT-guest was not affected by the preparation methods (i.e., co-precipitation method or impregnation method) and ratio of Cu![[thin space (1/6-em)]](https://www.rsc.org/images/entities/char_2009.gif) :
:![[thin space (1/6-em)]](https://www.rsc.org/images/entities/char_2009.gif) Mg
Mg![[thin space (1/6-em)]](https://www.rsc.org/images/entities/char_2009.gif) :
:![[thin space (1/6-em)]](https://www.rsc.org/images/entities/char_2009.gif) Al.
Al.
Fig. 8 shows the XRD patterns of Cu/Mg(Al)O catalysts after reaction of neat glycerol under conditions of H2 pressure 9 MPa and reaction temperature 210 °C. The XRD patterns of Cu/Mg(Al)O after the first run, 3rd run and 8th run display, in addition to Cu, the diffraction peaks characteristic of HT-guest.
 | ||
| Fig. 8 XRD patterns of Cu/Mg(Al)O catalyst after (a) the first run, (b) the third run, and (c) the eighth run. Reaction conditions: 6 wt% of Cu/Mg(Al)O catalyst, neat glycerol (15 mL), reaction time 24 h, reaction temperature 210 °C, hydrogen pressure 9 MPa. | ||
Fig. 9 shows the XRD patterns of Cu/Mg(Al)O catalysts after reaction over different reaction temperatures. In the reaction temperature range of 180–230 °C, all the used catalysts showed the structure of HT-guest. This indicated that the formation of HT-guest was not related to reaction temperature.
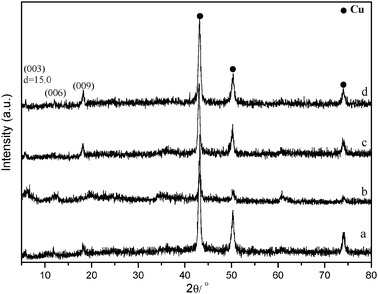 | ||
| Fig. 9 XRD patterns of Cu/Mg(Al)O catalysts after reaction run under different reaction temperatures: (a) 180 °C, (b) 200 °C, (c) 210 °C, (d) 230 °C. Reaction conditions: 6 wt% of Cu/Mg(Al)O catalyst, 80% glycerol aqueous solution, reaction time 24 h, hydrogen pressure 4 MPa. | ||
Fig. 10 displays the XRD patterns of Cu/Mg(Al)O catalysts after reaction over different hydrogen pressures. Below 4 MPa, the used catalyst showed the structure of HT-guest; while above 7 MPa, the used catalyst showed the structure of HT-OH−. This indicated that the formation of HT-guest was affected by hydrogen pressure.
 | ||
| Fig. 10 XRD patterns of Cu/Mg(Al)O catalysts after reaction run under different hydrogen pressures: (a) 2 MPa, (b) 4 MPa, (c) 7 MPa, (d) 9 MPa, (e) 11 MPa. Reaction conditions: 6 wt% of Cu/Mg(Al)O catalyst, 80% glycerol aqueous solution, reaction time 24 h, reaction temperature 210 °C. | ||
Fig. 11 shows the effect of glycerol concentration on structure of Cu/Mg(Al)O catalysts. Below the concentration of 60% glycerol aqueous solution, the used catalyst displayed diffraction peaks of reconstructed HT which were similar to those of HT-OH− (Fig. 11 a–c). Above 80% concentration of glycerol aqueous solution, the used catalyst displayed apparent diffraction peaks at 6.2° and 18.3° and a weak diffraction peak at 11.4° (Fig. 11d and e). The reflections at 6.2° and 18.3° were characteristic of HT-guest, while that at 11.4° was associated with HT-OH−. This indicates that the used catalyst contained HT-guest as the major phase and HT-OH− as the minor phase. On this basis, it is assumed that the structure of used catalyst was affected by reactant concentrations.
 | ||
| Fig. 12 XRD patterns of Cu/Mg(Al)O catalysts after reaction of 1,2-propanediol hydrogenolysis which was run under different conditions: (a)–(c) H2 pressure 9 MPa, reaction temperature 210 °C, and different concentrations of 1,2-propanediol aqueous solution (a, 80%; b, 67%; c, 50%); (d) H2 pressure 2 MPa, reaction temperature 210 °C, and 1,2-propanediol aqueous solution (50%); (e)–(i) H2 pressure 4 MPa, reaction temperature 200 °C and different concentrations of 1,2-propanediol aqueous solution (e, 80%; f, 67%; g, 50%; h, 20%; i, 5%); (j and k) reaction temperature 180 °C, 1,2-propanediol aqueous solution (5%), and different H2 pressure (j, 4 MPa; k, 0.1 MPa). Reaction conditions: 6 wt% of Cu/Mg(Al)O catalysts, reaction time 24 h. | ||
For the reaction of 1,2-propanediol, the reaction solution was just aqueous solution of 1,2-propanediol. No reaction products were identified at the end of either reaction, indicating that 1,2-propanediol did not react under the reaction conditions. Since the bulk solution was 1,2-propanediol aqueous solution throughout the whole reaction process, it is very possible that 1,2-propanediol is intercalated into the interlayer galleries of HT-guest. Furthermore, the formation of HT-guest was related to the reaction conditions. The higher the 1,2-propanediol concentration and the lower the H2 pressure, the more the possibility of 1,2-propanediol being intercalated into the interlayer galleries of HT-guest.
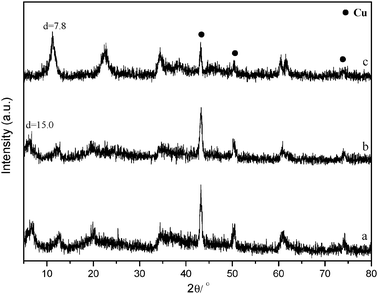 | ||
| Fig. 13 XRD patterns of Cu/Mg(Al)O catalysts after reaction run under different H2 pressures: (a) 0.1 MPa, (b) 1 MPa, (c) 4 MPa. Reaction conditions: 6 wt% of Cu/Mg(Al)O catalysts, reaction time 24 h, reaction temperature 200 °C, and 80% 1,3-propanediol aqueous solution. | ||
The reaction mechanism of 1,3-propanediol hydrogenolysis was similar to that of glycerol hydrogenolysis.30 The product analysis showed that part of 1,3-propanediol was converted to n-propanol and H2O (Scheme 3). Under 0.1 MPa, the conversion of 1,3-propanediol was 66% and the yield of n-propanol was 11%; under 4 MPa, the conversion of 1,3-propanediol was 76% and the yield of n-propanol was 59% (Fig. 14). Therefore, in contrast to the effect of hydrogen pressure on conversion, hydrogen pressure has a stronger effect on the yield of n-propanol.
 | ||
| Scheme 3 Hydrogenolysis of 1,3-propanediol. | ||
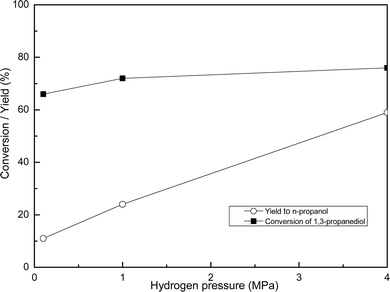 | ||
| Fig. 14 Effect of hydrogen pressure on 1,3-propanediol hydrogenolysis. Reaction conditions: 6 wt% of Cu/Mg(Al)O catalysts, reaction time 24 h, reaction temperature 200 °C, and 80% 1,3-propanediol aqueous solution. | ||
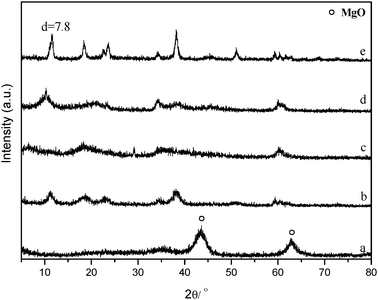 | ||
| Fig. 15 XRD patterns of (a) Mg(Al)O, (b) Mg(Al)O catalysts after reaction of 80% 1,2-propanediol aqueous solution, (c)–(e) Mg(Al)O catalysts after hydrogenolysis reaction of glycerol with different concentrations (c, 80%; d, 60%; e, 10%). Reaction conditions: 6 wt% of Mg(Al)O materials, reaction time 24 h, H2 pressure 4 MPa, reaction temperature 200 °C. | ||
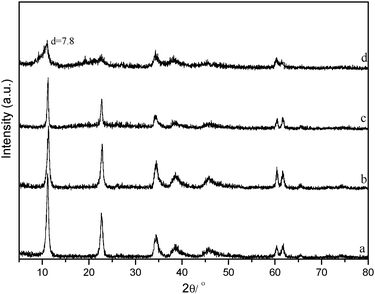 | ||
| Fig. 16 XRD patterns of (a) Mg–Al HT-CO32−, (b–d) Mg–Al HT-CO32− catalyst after hydrogenolysis reaction (b, 80% glycerol aqueous solution; c, 80% 1,2-propanediol aqueous solution; d, neat glycerol). Reaction conditions: 6 wt% of Mg–Al HT-CO32− catalysts, reaction time 24 h, H2 pressure 4 MPa, reaction temperature 200 °C. | ||
 | ||
| Fig. 17 XRD patterns of (a) Mg–Al HT-OH−, (b–d) Mg–Al HT-OH− catalyst after hydrogenolysis reaction (b, 80% glycerol aqueous solution; c, 80% 1,2-propanediol aqueous solution; d, neat glycerol). Reaction conditions: 6 wt% of Mg–Al HT-OH− catalyst, reaction time 24 h, H2 pressure 4 MPa, reaction temperature 200 °C. | ||
 | ||
| Scheme 4 The structure of pure supports (i.e. Mg(Al)O, HT-CO32−, HT–OH−) after reaction. | ||
The intercalation possibility of glycerol (reactant) and 1,2-propanediol (product) is discussed below. Fig. 11 indicates that the formation of HT-guest was under the condition of glycerol concentration >80%. Therefore glycerol seems to be the guest species. However, Fig. 5 shows that the conversion of glycerol changed with its concentration and the glycerol concentration was not constant. Table 2 shows the concentration of glycerol and 1,2-propanediol pre-reaction and post-reaction. The glycerol concentration after reaction did not increase apparently when its initial concentration increased. When the initial concentration of glycerol was 40%, the concentration after reaction was 24% (Table 2, entry 2). When the initial concentration of glycerol was increased from 40% to 100%, the concentration of glycerol after reaction increased from 24% to 29% (Table 2, entry 5). However, the 1,2-propanediol concentration post-reaction increased apparently when the initial concentration of glycerol increased. When the initial concentration of glycerol was 40%, the 1,2-propanediol concentration post-reaction was 11%. When the initial concentration of glycerol was increased to 100%, concentration of 1,2-propanediol post-reaction increased to 51%. This implied that, compared with glycerol, 1,2-propanediol had more possibility of being the guest species. Besides, the results in Section 3.5.2 had proved that 1,2-propanediol could be intercalated into the interlayer space of HT.
| Entry | Glycerol | 1,2-Propanediol | Ethylene glycolb | The structure of used catalyst | |||
|---|---|---|---|---|---|---|---|
| Pre- | Post- | Pre- | Post- | Pre- | Post- | ||
| a Derived from the data of Fig. 5 and Fig. 11. b By-product. | |||||||
| 1 | 20% | 14% | 0 | 4% | 0 | 0.93% | HT-OH− |
| 2 | 40% | 24% | 0 | 11% | 0 | 1.5% | HT-OH− |
| 3 | 60% | 27% | 0 | 22% | 0 | 1.8% | HT-OH− |
| 4 | 80% | 27% | 0 | 36% | 0 | 1.9% | HT-guest |
| 5 | 100% | 29% | 0 | 50% | 0 | 1.6% | HT-guest |
Table 3 also shows the concentration of glycerol and 1,2-propanediol pre-reaction and post-reaction. In Table 3, the initial concentration of glycerol was set constant at 80% and the H2 pressure was a variable. The concentration of glycerol post-reaction decreased with the increase in H2 pressure, and went down to the lowest value (<1.4%) when the H2 pressure was above 7 MPa. However, the concentration of 1,2-propanediol post-reaction increased with the increase in H2 pressure, and went up to the maximum value (62%) when the H2 pressure was above 7 MPa. When the H2 pressure was above 7 MPa, the crystalline phase of HT-OH− was formed (Table 3, entries 3–5). This revealed that the crystalline phase of HT-OH− was formed when 1,2-propanediol reached its maximum concentration (62%) and glycerol went down to its lowest concentration (<1.4%). Why was the HT-OH− formed when 1,2-propanediol reached its maximum concentration? This could be ascribed to the effect of H2 pressure. The concentration of H2 dissolved in the bulk solution may increase with H2 pressure, which accordingly increased the amount of H2 chemisorbed on the active sites of Cu and decreased the amount of the chemisorbed 1,2-propanediol. This implied that the chemisorption of 1,2-propanediol on Cu was affected by H2 pressure. The discussion in the previous section suggested that the formation of HT-guest was ascribed to the chemisorption of 1,2-propanediol on Cu. Therefore, the effect of H2 pressure on the formation of HT-guest may result from its effect on chemisorption of 1,2-propanediol on Cu. This proposal was corroborated by the results in Section 3.5.2, where, for the same concentration of 1,2-propanediol, HT-guest was more easily formed at low H2 pressure.
| Entry | H2 pressure (MPa) | Glycerol | 1,2-Propanediol | Ethylene glycolb | The structure of used catalyst | |||
|---|---|---|---|---|---|---|---|---|
| Pre- | Post- | Pre- | Post- | Pre- | Post- | |||
| a Derived from the data of Fig. 4 and Fig. 10. b By-product. | ||||||||
| 1 | 2 | 80% | 12% | 0 | 36.51% | 0 | 2.3% | HT-guest |
| 2 | 4 | 80% | 3.9% | 0 | 55.45% | 0 | 2.9% | HT-guest |
| 3 | 7 | 80% | 0.73% | 0 | 59.93% | 0 | 3.3% | HT-OH− |
| 4 | 9 | 80% | 1.4% | 0 | 60.72% | 0 | 3.7% | HT-OH− |
| 5 | 11 | 80% | 0.72% | 0 | 60.22% | 0 | 3.3% | HT-OH− |
The other possible guest species were by-products. The by-product in the liquid phase, which was detected in this system, was ethylene glycol. As shown in Table 3, the concentration of ethylene glycol was low and similar whether HT-guest was formed or not. This implied that there was very low possibility for ethylene glycol to be a guest species.
The proposed mechanism of glycerol hydrogenolysis on reconstructed HT is depicted in Scheme 5. The Mg(Al)O shows a memory effect, recovering the original lamellar structure when immersed in the reactive system of glycerol hydrogenolysis. We suspect that guest species (i.e., 1,2-propanediol) were intercalated into the interlayer galleries, thus expanding the layers. The intercalation of glycerol or 1,2-propanediol was due to a driving force, i.e. the interaction between copper and glycerol or 1,2-propanediol. The size of glycerol or 1,2-propanediol was calculated, employing the quantum chemical method of Gaussian 09.31 The result showed that the size of glycerol or 1,2-propanediol was in the range of 4.7–6.3 Å (Table S1, ESI†). This implied that glycerol or 1,2-propanediol occupied a certain space. Accordingly, this explained why the intercalation of 1,2-propanediol would increase the basal spacing of HT. The formation of HT-guest was affected by the reaction conditions. In the case of glycerol hydrogenolysis with low H2 pressure and high concentration of 1,2-propanediol, the used catalyst showed the structure of HT-guest with enhanced basal spacing (basal spacing, d = 15.0 Å), as seen from the results shown in Fig. 10a and b and Fig. 11d and e; however, under the reverse reaction conditions, it showed the structure of HT-OH− (basal spacing, d = 7.8 Å), as seen from the results shown in Fig. 10c–e and Fig. 11a–c.
 | ||
| Scheme 5 Mechanism of glycerol hydrogenolysis on reconstructed HT. | ||
The basal spacing of HT could work as an effective tool to explore the effect of pressure on glycerol hydrogenolysis. The formation of HT-guest means that the product 1,2-propanediol is strongly adsorbed on the active site of Cu. This chemisorbed 1,2-propanediol may crack into the gas phase product,9 which decreased the yield of 1,2-propanediol. One proof is the experimental results shown in Fig. 4, where the conversion of glycerol was slightly affected by the hydrogen pressure, the yield of 1,2-propanediol, however, increased apparently with hydrogen pressure, and reached >82% when hydrogen pressure was above 7 MPa. Under the condition of hydrogen pressure below 4 MPa, the structure analysis using XRD showed that the catalyst had the structure of HT-guest (Fig. 10a and b); while above 7 MPa, the catalyst had the structure of HT-OH− (Fig. 10c–e). Therefore, the lower yield of 1,2-propanediol below 4 MPa of hydrogen pressure may be due to the strong chemisorption of 1,2-propanediol on catalysts; while the higher yield of 1,2-propanediol above 4 MPa was ascribed to the easy desorption of 1,2-propanediol from catalysts.
The proposal above was also fit to explain the hydrogenolysis of 1,3-propanediol. The formation of HT-guest showed little influence on the reaction conversion of 1,3-propanediol. However, the yield with respect to n-propanol was affected by it (Fig. 14). When the used catalyst showed the structure of HT-guest (Fig. 13a), the yield of n-propanol was only 11% (Fig. 14); however, when it had the structure of HT-OH− (Fig. 13c), the yield of n-propanol was increased to 59% (Fig. 14).
4. Conclusions
HT has the property of memory effect and tunable basal spacing. The formation of HT-guest was affected by the reaction conditions. In the case of glycerol hydrogenolysis at low H2 pressure and high concentration of 1,2-propanediol, the used catalyst showed the structure of HT-guest with enhanced basal spacing (basal spacing, d = 15.0 Å); however, under the reverse reaction conditions, it showed the structure of HT-OH− (basal spacing, d = 7.8 Å). It was found that the basal spacing of HT could work as an effective tool, reflecting whether or not the guest species (i.e., 1,2-propanediol) was strongly adsorbed on the active sites of Cu. With this tool, the effect of H2 pressure on glycerol hydrogenolysis was elucidated. H2 pressure affected the adsorption of 1,2-propanediol on catalysts. The higher the H2 pressure, the easier the desorption of 1,2-propanediol from catalysts. The lower yield of 1,2-propanediol below 4 MPa of hydrogen pressure was due to the strong chemisorption of 1,2-propanediol on catalysts; while the higher yield of 1,2-propanediol above 4 MPa was ascribed to the easy desorption of 1,2-propanediol from catalysts. In addition, this method may be used to study the catalytic mechanism in other reactions with HT as a catalyst or a catalyst support.Acknowledgements
This work was supported by the project funded by Natural Science Basic Research Plan in Shaanxi Province of China (Program No. 2010JM2003) and by the Fundamental Research Funds for the Central Universities (Program No. GK200902006).References
- E. J. Steen, Y. Kang, G. Bokinsky, Z. Hu, A. Schirmer, A. McClure, S. B. Cardayre and J. D. Keasling, Nature, 2010, 463, 559 CrossRef CAS.
- M. Pagliaro, R. Ciriminna, H. Kimura, M. Rossi and C. D. Pina, Angew. Chem., Int. Ed., 2007, 46, 4434 CrossRef CAS.
- C. H. Zhou, J. N. Beltramini, Y. X. Fan and G. Q. Lu, Chem. Soc. Rev., 2008, 37, 527 RSC.
- Y. Nakagawa, Y. Shinmi, S. Koso and K. Tomishige, J. Catal., 2010, 272, 191 CrossRef CAS.
- M. Ayoub and A. Z. Abdullah, Renewable Sustainable Energy Rev., 2012, 16, 2671 CrossRef CAS.
- M. A. Medeiros, C. M. M. Leite and R. M. Lago, Chem. Eng. J., 2012, 180, 364 CrossRef CAS.
- M. Balaraju, V. Rekha, P. S. S. Prasad, B. L. A. P. Devi, R. B. N. Prasad and N. Lingaiah, Appl. Catal., A, 2009, 354, 82 CrossRef CAS.
- E. P. Maris and R. J. Davis, J. Catal., 2007, 249, 328 CrossRef CAS.
- D. Roy, B. Subramaniam and R. V. Chaudhari, Catal. Today, 2010, 156, 31 CrossRef CAS.
- A. Wawrzetz, B. Peng, A. Hrabar, A. Jentys, A. A. Lemonidou and J. A. Lercher, J. Catal., 2010, 269, 411 CrossRef CAS.
- E. D' Hondt, S. V. d. Vyver, B. F. Sels and P. A. Jacobs, Chem. Commun., 2008, 6011 RSC.
- I. Gandarias, P. L. Arias, J. Requies, M. B. Güemez and J. L. G. Fierro, Appl. Catal., B, 2010, 97, 48 CrossRef.
- Z. Huang, F. Cui, H. Kang, J. Chen, X. Zhang and C. Xia, Chem. Mater., 2008, 20, 5090 CrossRef CAS.
- L. C. Meher, R. Gopinath, S. N. Naik and A. K. Dalai, Ind. Eng. Chem. Res., 2009, 48, 1840 CrossRef CAS.
- Z. Yuan, L. Wang, J. Wang, S. Xia, P. Chen, Z. Hou and X. Zheng, Appl. Catal., B, 2011, 101, 431 CrossRef CAS.
- A. Perosa and P. Tundo, Ind. Eng. Chem. Res., 2005, 44, 8535 CrossRef CAS.
- E. P. Maris, W. C. Ketchie, M. Murayama and R. J. Davis, J. Catal., 2007, 251, 281 CrossRef CAS.
- L. Ma and D. He, Top. Catal., 2009, 52, 834 CrossRef CAS.
- D. Coll, F. Delbecq, Y. Aray and P. Sautet, Phys. Chem. Chem. Phys., 2011, 13, 1448 RSC.
- F. Auneau, C. Michel, F. Delbecq, C. Pinel and P. Sautet, Chem.–Eur. J., 2011, 17, 14288 CrossRef CAS.
- T. W. Kim, M. Sahimi and T. T. Tsotsis, Ind. Eng. Chem. Res., 2009, 48, 5794 CrossRef CAS.
- Y. Zhao, S. Zhang, B. Li, H. Yan, S. He, L. Tian, W. Shi, J. Ma, M. Wei, D. G. Evans and X. Duan, Chem.–Eur. J., 2011, 17, 13175 CrossRef CAS.
- I. Gualandi, E. Scavetta, S. Zappoli and D. Tonelli, Biosens. Bioelectron., 2011, 26, 3200 CrossRef CAS.
- G. Centi and S. Perathoner, Microporous Mesoporous Mater., 2008, 107, 3 CrossRef CAS.
- S. K. Jana, Y. Kubota and T. Tatsumi, J. Catal., 2008, 255, 40 CrossRef CAS.
- J. Liang, R. Ma, N. Iyi, Y. Ebina, K. Takada and T. Sasaki, Chem. Mater., 2010, 22, 371 CrossRef CAS.
- D. P. Debecker, E. M. Gaigneaux and G. Busca, Chem.–Eur. J., 2009, 15, 3920 CrossRef CAS.
- S. Abelló, F. Medina, D. Tichit, J. Pérez-Ramírez, J. C. Groen, J. E. Sueiras, P. Salagre and Y. Cesteros, Chem.–Eur. J., 2005, 11, 728 CrossRef.
- C. Xu, J. Sun, B. Zhao and Q. Liu, Appl. Catal., B, 2010, 99, 111 CrossRef CAS.
- K. Wang, M. C. Hawley and T. D. Furney, Ind. Eng. Chem. Res., 1995, 34, 3766 CrossRef CAS.
- S. Hayase, D. A. Hrovat and W. T. Borden, J. Am. Chem. Soc., 2004, 126, 10028 CrossRef CAS.
Footnote |
| † Electronic supplementary information (ESI) available. See DOI: 10.1039/c2cy20144e |
| This journal is © The Royal Society of Chemistry 2012 |

