An in situ spatially resolved method to probe gas phase reactions through a fixed bed catalyst†
Jamal
Touitou
,
Kevin
Morgan
,
Robbie
Burch
,
Christopher
Hardacre
and
Alexandre
Goguet
*
Centre for the Theory and Application of Catalysis (CenTACat), School of Chemistry and Chemical Engineering, Queen's University, Belfast, BT9 5AG, UK. E-mail: a.goguet@qub.ac.uk; Fax: +44 28 9097 4687; Tel: +44 28 9097 4882
First published on 25th May 2012
Abstract
A new method to spatially probe heterogeneous catalysed reactions within a packed bed of catalyst has been developed. The spatial resolution is achieved using a stationary perforated capillary coupled to a mass spectrometer while the catalyst bed is moved. The oxidation of CO promoted by H2 over a Pd catalyst has been used to demonstrate the technique.
Introduction
A detailed understanding of the reaction kinetics is required for the development and optimization of heterogeneous catalysts and catalytic reactors. It is conventional to determine the kinetics from an analysis of the inlet and outlet gases. However, these methods do not allow an examination of the kinetics as a function of the gas composition as it changes within a catalyst bed, i.e. with the build-up of the products. To overcome these problems, computational models of reactions in the catalyst bed have been developed.1 However, most of these models are only applicable to a limited number of reactions and only for very specific conditions (pressure and temperature). Some techniques have been used to provide a more detailed insight into the kinetics and surface reaction processes. For example, by using small pulses of gas coupled with fast detection methods, the Temporal Analysis of Products (TAP) methodology has enabled a wide range of reaction mechanisms to be investigated and the presence of short lived reaction intermediates to be established.2,3 Whilst this technique is powerful and provides valuable data on real catalysts, the use of vacuum conditions limits the direct application of the kinetics to catalysts operating under normal reaction conditions.Recently, the spatially resolved capillary-inlet mass spectrometer (Spaci-MS) has been developed by Partridge, Goguet and co-workers.4 The Spaci-MS provides profiles of gas concentration and temperature within structured catalysts by moving gas sampling capillaries and thermocouples within monoliths. This provides both radial and axial profiles of the catalytic reactions occurring throughout the monolith reactor. A similar approach has been reported by Horn et al. using a single axially movable capillary connected to a quadrupole mass spectrometer (QMS).5,6 Therein, the technique was used to examine drilled foam catalysts and spherical pellets. Both techniques have demonstrated the importance of obtaining reaction profiles within a catalytic reactor. For example, using a Pt–Rh on alumina monolith catalyst, Sá et al.4 showed that kinetic oscillations were observed during the CO oxidation reaction between 30 and 90% CO conversion.4 Importantly, analogous data obtained in a plug-flow reactor using the same catalyst in a crushed form did not display any oscillations. This difference highlights the impact of intra-bed measurements to study heterogeneous catalysts. Although, monolith reactors are used widely for automotive applications, most catalyst development is performed using fixed bed, powdered catalysts. This paper reports on the development of a new method to measure gas composition profiles within a packed bed of powdered catalyst under true reaction conditions. While previous attempts have been made at such a technique, these appear to be invasive and on a much larger scale.7,8
Experimental setup
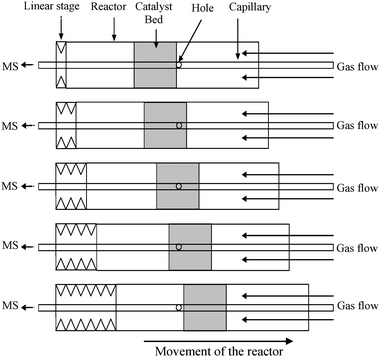
The technique is based on the use of a capillary (O.D. 150 μm, 25 cm length) coupled with a mass spectrometer wherein holes are drilled in the side of the capillary to allow gas sampling.Fig. 1 shows the principle of the sampling system. The catalyst bed is moved relative to the sampling holes in the capillary which critically is placed perpendicular to the direction of travel of the catalyst bed. The capillary is kept stationary and the reactor is moved via a linear stage using bellows. This differs from previous reported techniques3,4 in that it is the reactor which moves rather than the capillary. This procedure allows simple coupling of the technique with additional spatially resolved spectroscopic analysis such as XAS and Raman. This setup also reduces the strain on the capillary as the capillary remains stationary with respect to the catalyst which enables smooth movement of the bed in both directions. The present arrangement also differs from the Spaci-MS technique in that the capillary is not open ended and hence any issues of blocking the sampling port are minimised.
 | ||
| Fig. 1 Principle of the sampling system. | ||
The capillary has been drilled by laser ablation achieving 20 μm diameter holes. The capillary is directly connected via a differentially pumped two chamber vacuum system to a QMS. The differential pumping allows atmospheric gas sampling to be compatible with the QMS forming a molecular beam. The heating of the reactor is achieved via a hot air blower which also enables easy access to the reactor for additional spectroscopic analysis. The size of the capillary used was a balance between having sufficient strength to enable movement against the catalyst bed and to be drilled whilst being small enough to reduce any disturbance of the gas flow and catalyst bed. The latter is very important in order to prevent channelling of the gas and, therefore, significant bypass of the catalyst and direct sampling of the unreacted gases only. Spaci-MS tests on capillaries of 110 cm length have proven the measured conductance to be <10 μL min−1,4 which is much less than the calculated 230 μL min−1. In the fixed bed system the calculated conductance is ∼1 mL min−1 (see SI). Therefore, any disturbance of the gas flow for this system is likely to be minimal (i.e. a maximum of ∼1% of the total flow). Fig. 2 and 3 show a photograph and a schematic drawing respectively of the actual apparatus used as well as a close up of the holes drilled in the side of the capillary. Further details of the setup are provided in the SI.
 | ||
| Fig. 2 Reactor loaded with catalyst and capillary inserted. | ||
 | ||
| Fig. 3 The sampling holes of the capillary (a) schematic representation of the capillary and (b) picture obtained by optical microscopy. | ||
Validation of the technique
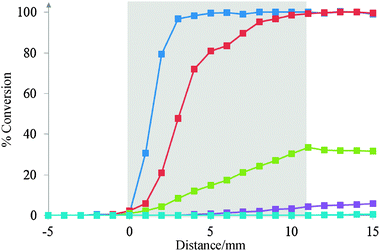
The technique was validated using CO oxidation over a 1 wt% Pd–Al2O3 catalyst in the absence and the presence of hydrogen. For all the activity tests, the size of the catalyst particles (250–450 μm) was selected to be larger than the diameter of the capillary (OD: 150 μm) to limit the effect of the capillary on the catalyst bed.Fig. 4 shows a typical gas concentration profile in the absence of hydrogen as a function of sampling position. These profiles are interpreted in the same manner as the established Spaci-MS technique,4i.e. the results obtained are an instantaneous sample and a true representation of the gas concentrations at that particular point within the catalyst bed. As expected, CO and O2 are gradually consumed and CO2 is formed along the length of the bed. Importantly, the CO is completely consumed by the end of the catalyst bed and end of pipe gas concentration profiles remain relatively stable. This demonstrates that there is no significant bypass of the catalyst due to the presence of the capillary. It should be noted that the conversion just inside and outside the end of the bed were the same showing that the effect of the capillary and axial effects were also negligible. Fig. 5 shows the effect of temperature on CO2 formation. The conversion when the sampling was collected after the catalyst bed increases with temperature and, at 250 and 300 °C, 100% conversion to CO2 is observed. Once again the signal is stable downstream of the catalyst bed confirming the limited influence of the capillary on the gas flow and the catalyst bed. Whilst at 250 and 300 °C no more information can be gathered from the end of pipe measurement, using the intra-bed analysis it is clear that the reaction profile moves closer to the inlet of the reactor. Complete conversion of the CO occurs within 9 mm of the start of the catalyst bed at 250 °C and 7 mm at 300 °C.
 | ||
Fig. 4 Gas profile of the CO oxidation in the catalyst bed at 250 °C; CO ( ), O2 ( ), O2 ( ) and CO2 ( ) and CO2 ( ). The catalyst bed is represented by the shaded area. ). The catalyst bed is represented by the shaded area. | ||
 | ||
Fig. 5 CO conversion in the catalyst bed at different temperatures; 150 °C ( ), 200 °C ( ), 200 °C ( ), 225 °C ( ), 225 °C ( ), 250 °C ( ), 250 °C ( ) and 300 °C ( ) and 300 °C ( ). The catalyst bed is represented by the shaded area. ). The catalyst bed is represented by the shaded area. | ||
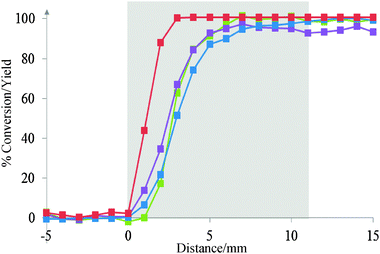
CO oxidation is known to be promoted by the presence of hydrogen. For example, Baddour et al. have shown that over Pd based catalysts the presence of hydrogen decreased the apparent activation energy from 30 kcal mol−1 without hydrogen to below 8 kcal mol−1 at about 100 °C and to below 0.4 kcal mol−1 at room temperature in the presence of hydrogen.9 Similar increases in activity were also obtained using the Pd–Al2O3 catalyst studied in the present case. Fig. 6 shows the evolution of the conversion and yield as a function of position in the catalyst bed at 250 °C in the presence of hydrogen. It is clear that no useful information on the reaction sequence can be obtained from the end of pipe measurements. In contrast, the reaction profiles through the catalyst bed clearly show that there is an offset between the H2 light off position and that found for CO. Significantly, all the hydrogen is consumed within the first 2 mm of the catalyst bed. In comparison, at this bed position <20% of the CO has been consumed. Full conversion of CO is observed at 7 mm in the presence of H2 whereas this does not happen until 9 mm in the absence of H2 (See Fig. 5 and 6 and Table 1). Spatially resolved temperature profiles of the catalyst bed are available in the SI (Fig. S5). It should be noted that the H2O concentration is higher than the baseline level at this point; however, it cannot be quantified to the high background signal.
 | ||
Fig. 6 Conversion of the gas in the catalyst bed at 250 °C with H2; CO ( ), H2 ( ), H2 ( ), O2 ( ), O2 ( ), CO2 yield ( ), CO2 yield ( ) at 250 °C. The catalyst bed is represented by the shaded area. ) at 250 °C. The catalyst bed is represented by the shaded area. | ||
| Without H2 | With H2 | |||
|---|---|---|---|---|
| T °C | Max conversion (%) | Position at max conversion (mm) | Max conversion | Position at max conversion |
| 150 | 1 | 11 | 9 | 11 |
| 200 | 8 | 11 | 23 | 11 |
| 225 | 31 | 11 | 95 | 11 |
| 250 | 100 | 9 | 100 | 7 |
| 300 | 100 | 7 | 100 | 5 |
The spatially resolved data for the hydrogen effect on the CO oxidation clearly demonstrates the importance of monitoring the reaction in situ. It provides insight into how the hydrogen may be controlling the CO oxidation reaction. For example, due to the high conversion of H2 prior to significant CO conversion the presence of surface hydrogen cannot be influencing the CO oxidation activity. Therefore, it is likely that either an intermediate is formed which promotes the CO oxidation, for example the production of peroxide species,10 or that the effect is thermal with the H2 combustion increasing the catalyst bed temperature thus leading to higher CO oxidation. The exact mechanism is beyond the scope of the current paper.
Conclusions
A new in situ method has been developed to analyse the gas composition within a packed bed of catalyst for gas phase heterogeneously catalysed reactions. The gas sampling system has been designed such that its influence on the hydrodynamics of the catalyst bed is minimised and so that the catalyst activity as a function of position along the bed can be monitored. This spatial resolution has been demonstrated using CO oxidation in the presence and absence of H2 over a Pd–Al2O3 catalyst. The results demonstrate the capacity of this manual instrument to provide additional important information regarding the mechanism of the reaction compared with conventional end of pipe measurements. Such spatial information has not been previously demonstrated using powdered catalysts. These sets of experiments have proved the concept of spatially resolved concentration profiles using such instrumentation and future work will focus on optimisation of the system and the incorporation of other spectroscopic techniques.Acknowledgements
EPSRC is acknowledged for funding this work as part of the CASTech project (Grant Number EP/G012156/1)Notes and references
- J. N. Kapur, Mathematical Modelling, 1998, New Age International Ltd., New Delhi, India Search PubMed.
- J. T. Gleaves, G. S. Yablonskii, X. Zheng, R. Fushimi and P. L. Mills, J. Mol. Catal. A: Chem., 2010, 315, 108 CrossRef CAS.
- E. V. Kondratenko and J. Pérez-Ramírez, Catal. Today, 2007, 121, 197 CrossRef CAS.
- J. Sá, D. L. Abreu Fernandes, F. Aiouache, A. Goguet, C. Hardacre, D. Lundie, W. Naeem, W. P. Partridge and C. Stere, Analyst, 2010, 135, 2260 RSC.
- R. Horn, O. Korup, M. Geske, U. Zavyalova, I. Oprea and R. Schlögl, Rev. Sci. Instrum., 2010, 81, 6 CrossRef.
- O. Korup, S. Mavlyankariev, M. Geske, C. F. Goldsmith and R. Horn, Chem. Eng. Process., 2011, 50, 998 CrossRef CAS.
- A. Baiker and D. Epple, Appl. Catal., 1986, 22, 55 CrossRef CAS.
- S. Liu, W. Li, Y. Wang and H. Xu, Fuel Process. Technol., 2008, 89, 1345 CrossRef CAS.
- R. L. Goldsmith, M. Modell and R. F. Baddour, J. Phys. Chem., 1971, 75, 2065 CrossRef CAS.
- L. Piccolo, H. Daly, A. Valcarcel and F. C. Meunier, Appl. Catal., B, 2009, 86, 190 CrossRef CAS.
Footnote |
| † Electronic supplementary information (ESI) available: Full experimental details of the design of the apparatus, details of the catalyst preparation and testing methods used. See DOI: 10.1039/c2cy20141k |
| This journal is © The Royal Society of Chemistry 2012 |
