Selective hydrogenation of acetophenone over nickel supported on titania
K. Joseph Antony
Raj
a,
M. G.
Prakash
ab,
R.
Mahalakshmy
b,
T.
Elangovan
a and
B.
Viswanathan
*a
aNational Centre for Catalysis Research, Indian Institute of Technology-Madras, Chennai 600036, India. E-mail: bvnathan@iitm.ac.in
bPG & Research Department of Chemistry, Thiagarajar College, Madurai 625 009, India
First published on 3rd April 2012
Abstract
The catalytic activity of Ni impregnated on various phases of titania, viz. rutile, anatase and high surface area, has been investigated for the hydrogenation of acetophenone. The TPR profile of Ni/rutile suggests a strong metal–support interaction. The observed catalytic activity order is Ni/rutile > Ni/anatase > Ni/TiO2. The greater activity of Ni/rutile is attributed to higher concentration of Ni on the surface and SMSI. The catalyst samples showed sintering of Ni when calcined at 900 °C, which resulted in a drop in their catalytic activity. The catalyst stability studies showed that activity is lost only marginally in rutile and anatase. The electronic interaction between Ni and rutile promotes the formation of electron enriched Ni–H species which interact with the carbonyl group of acetophenone. The hydrogenation proceeds with atom economy to form phenylethanol irrespective of the reaction conditions suggesting that these catalysts are of significant importance in green chemistry. The results obtained in this investigation clearly establish that Ni/rutile, a non-porous support, is better for this class of reaction.
1. Introduction
Catalytic hydrogenation is attractive and burgeoning as this process does not generate acid effluents, and has little impact on the environment. Ni/TiO2 catalysts find wide applications in the hydrogenation of organic intermediates which are largely used in diverse industries. For example, phenylethanol, a reduction product of acetophenone, is widely used in fragrance and pharmaceutical industries1,2 and as a raw material for styrene monomers. The hydrogenation of acetophenone (ACP) is usually carried out in the liquid phase, at low hydrogen pressure, using transition metals supported on zeolites or oxides as catalysts.3–8Lin et al.9 examined the vapor-phase ACP hydrogenation reaction over Pt/SiO2, Pt/Al2O3 and Pt/TiO2 catalysts. A selectivity of above 95% to phenylethanol (PE) was obtained over the Pt/TiO2 compared to 70–80% over Pt/SiO2 and Pt/Al2O3. Liu et al.10 have employed mesoporous Pt/Al2O3 and achieved a conversion of 89% with a selectivity of 98% to PE. Pt/SiO211 can catalyze the hydrogenation of carbonyl and phenyl groups of the ACP molecule at a similar rate to form PE and cyclohexylmethylketone, respectively, in comparable amounts. Employing the Pd/γ-Al2O312 catalyst, the carbonyl function of ACP can be hydrogenated to form PE, which can be consecutively hydrogenated to ethylbenzene. Anderson et al.13 examined the hydrogenation of ACP over Pd supported on activated carbon and carbon nanofibres. The products are a mixture of both the ring and keto group saturated products.
Casagrande et al.14 studied the liquid phase hydrogenation of ACP on a series of silica supported Ru/Cr catalysts and showed that the selectivity towards reduction of the carbonyl function increases with increasing amounts of Cr ions. Chromium ions have been used as promoters in RANEY® nickel based catalysts for the selective ACP reduction.15–17 Homogeneous hydrogenation of ACP has been studied using Ni0 complexes with a chelating bisphosphine, and a selectivity of 98% has been reported.18 Park et al.19 have reported a yolk–shell type Ni/SiO2 nanocatalyst and showed a high TOF for the reduction of ACP. Alonso et al.20–22 have recently employed nickel nanoparticles for hydrogen transfer to carbonyl compounds to form the corresponding alcohols by using isopropanol as a hydrogen donor. However, the amount of catalysts used is high (10–20 mol%), and the catalysts are not sufficiently stabilized in solution.
Titania catalysts are effective in photo-oxidation, reduction, and decomposition reactions, and impart selectivity enhancement when used as a support to group 8–10 metals. Strong Metal–Support Interaction (SMSI) catalysts generally have oxide supports containing a reducible metal ion such as Ti4+. They also serve as a promoter in CO hydrogenation reaction through SMSI. Bartholomew et al.23 observed raft-like structures for Ni/TiO2 which are reminiscent of strong interactions of the metal and support. The authors show an enhanced conversion of CO to methane with increasing Ni dispersion and metal–support interaction. Chen et al.24 investigated hydrogenation of chloronitrobenzene over Ni/TiO2 and the effect of calcination and reduction temperatures on Ni/TiO2 catalysts.
In this paper, we report our findings on the selective hydrogenation of acetophenone into phenylethanol employing Ni impregnated into various phases of titania, viz. rutile, anatase and high surface area, and have demonstrated that the reaction proceeds with atom economy. The choice of the catalysts is dictated by the excellent reducing property of Ni and the great influence exerted by titania supports on catalytic activity through SMSI.25 As the calcination and reduction temperatures can influence the interaction between Ni and TiO2, their effect on the properties of the catalysts was systematically investigated. In addition, the catalyst stability and the catalyst deactivation were investigated. This work, to the best of our knowledge, was not attempted by any research group.
2. Experimental
Chemicals
Rutile TiO2 (Aldrich), anatase TiO2 (Aldrich), Ni(NO3)2·6H2O (Qualigens), acetophenone (Qualigens), methanol (Qualigens) and high surface area TiO226 were used without further purification. Water used as solvent in the study is doubly distilled.Preparation of catalysts
The various forms of titania (anatase, rutile and high surface area) support were impregnated with nickel by an incipient wetness impregnation method using Ni(NO3)2·6H2O. In a typical synthesis, 2 g of anatase was mixed with 30 g of distilled water. To this mixture was added 1.48 g of Ni(NO3)2·6H2O, and heated to 70–80 °C with stirring for 5–6 h. The slurry was filtered and dried at 110 °C for 12 h. The dried sample was calcined at 500 °C in flowing air for 2 h (Ni/anatase-500). Following the same procedure, a nickel impregnated rutile support (Ni/rutile-500) and a high surface area titania support (Ni/TiO2-500) were prepared. The numbers in the abbreviations denote the temperature of calcination. The catalyst samples were also calcined at 900 °C. The nickel content of all the catalysts is 15 wt%. By employing the above procedure, catalyst samples containing 2.5, 5.0, 7.5, 10.0 and 12.5 wt% of Ni were prepared. All the catalyst samples were reduced under hydrogen flow at 450 °C in a tubular reactor with a heating rate of 10 °C min−1. The reduced samples were used in the acetophenone hydrogenation study. A suffix of 450R is appended to the abbreviation to denote the reduced samples.Characterization
Wide-angle XRD patterns of the calcined samples were obtained using a Rigaku Miniflex II, using CuKα radiation. The average crystallite size was calculated using the Scherrer equation. The nickel content of the catalysts was analyzed on a Rigaku XRF spectrometer. The nitrogen adsorption and desorption isotherms were measured at −196 °C using a Micromeritics ASAP 2020 surface area and porosity analyzer after the samples were degassed in vacuum at 300 °C for 3 h. BET surface area was calculated from the BET plot. Pore volume was measured at the single point of P/Po = 0.99. Hydrogen temperature programmed reduction (H2-TPR) was carried out in a quartz reactor using a Micromeritics autochem II chemisorption analyzer.Catalytic studies
Liquid phase acetophenone hydrogenation was performed at 140 °C and 40 kg cm−2 of hydrogen pressure in a 100 ml Parr autoclave. Before the reaction, the autoclave was purged with nitrogen and thereafter pressurized with hydrogen. The autoclave was charged with 0.2 g of Ni supported titania catalyst, 2 g of acetophenone and 40 ml of methanol. The reaction was performed for 1 h while stirring the reaction mixture at 600 rpm. After each reaction, the autoclave was cooled to 30 °C. The reaction products were separated by filtration and analyzed on a PerkinElmer Clarus-500 GC equipped with a ZB-1 capillary column and a FID. The reaction products were identified by GC-MS.3. Results and discussion
X-ray diffraction
The XRD patterns of nickel impregnated on various phases of titania and calcined at 500 °C for 2 h are shown in Fig. 1. The Ni/TiO2-500 sample showed reflections at 2θ of 25.3°, 38.3° and 48.1° which are characteristic of the anatase phase of titania. In addition, there is a reflection appearing as a shoulder at 37.3° which is characteristic of NiO. This reflection becomes prominent in the case of Ni/anatase-500 and Ni/rutile-500, with an additional reflection at 43.3°. The other reflections for Ni/anatase-500 at 25.3°, 37°, 37.8°, 38.6° and 48.2° are due to the anatase phase of titania. The reflections observed for Ni/rutile-500 at 27.5°, 36.2°, 39.4°, 41.3° and 44.1° are characteristic of the rutile phase of titania. The characteristic reflections due to nickel titanate at 2θ of 24.5°, 33.4° and 49.7° were not observed in the samples, which shows that nickel titanate is not formed when calcined at 500 °C.![XRD patterns of nickel impregnated on various phases of titania and calcined at 500 °C for 2 h. (a) Ni/TiO2; (b) Ni/anatase; (c) Ni/rutile [A – anatase; R – rutile; # – nickel oxide].](/image/article/2012/CY/c2cy20134h/c2cy20134h-f1.gif) | ||
| Fig. 1 XRD patterns of nickel impregnated on various phases of titania and calcined at 500 °C for 2 h. (a) Ni/TiO2; (b) Ni/anatase; (c) Ni/rutile [A – anatase; R – rutile; # – nickel oxide]. | ||
Fig. 2 displays the XRD patterns of nickel impregnated on various phases of titania and calcined at 500 °C for 2 h and thereafter reduced at 450 °C under flowing hydrogen for 4 h. The XRD patterns of all the samples showed a broad reflection at 2θ of 44.5°, which is characteristic of the fcc-phase of Ni. The hcp phase of Ni was not formed for these samples because its characteristic reflection was not observed at 2θ of 41.7°. The Ni/anatase-500 and Ni/rutile-500 samples exhibit reflections at 2θ of 37.3° and 43.3° for the calcined samples (Fig. 1), which are characteristic of the fcc-phase of NiO species (JCPDS #89-5881). These reflections are not seen in the reduced samples, which shows the complete reduction of NiO. It may be noted that the fcc structure of Ni is more stable than hcp, and the hcp phase of Ni nanoparticles is not formed due to its metastability. The hcp structure changed into the fcc structure upon application of heat, which confirms the metastability of the hcp structure at room temperature.27 The crystallite sizes for the reduced samples were calculated using the Scherrer equation (Table 1). An evaluation of crystallite sizes of Ni shows nearly the same crystallite sizes for Ni/TiO2-500 (15.4 nm) and Ni/rutile-500 (16.4 nm), while the size was greater for Ni/anatase-500 (23.3 nm). It is anticipated that anatase and rutile would show similar crystallite sizes for Ni; however, the smaller crystallite size of Ni on rutile than that on anatase may be due to the overlapping of 2θ reflections at 44.5° for Ni and 44.2° for rutile.
![XRD patterns of nickel impregnated on various phases of titania and calcined at 500 °C for 2 h and reduced at 450 °C for 4 h. (a) Ni/TiO2; (b) Ni/anatase; (c) Ni/rutile [A – anatase; R – rutile; * – nickel].](/image/article/2012/CY/c2cy20134h/c2cy20134h-f2.gif) | ||
| Fig. 2 XRD patterns of nickel impregnated on various phases of titania and calcined at 500 °C for 2 h and reduced at 450 °C for 4 h. (a) Ni/TiO2; (b) Ni/anatase; (c) Ni/rutile [A – anatase; R – rutile; * – nickel]. | ||
| Sample | BET surface area/m2 g−1 | Pore volume/cm3 g−1 | Crystallite size, Ni/nm | Crystallite size, TiO2/nm | %Conversion of ACP |
|---|---|---|---|---|---|
| Ni/TiO2-500 | 44 | 0.13 | — | 10 | — |
| Ni/TiO2-500-450R | 32 | 0.11 | 15.4 | 22.5 | 45.7 |
| Ni/TiO2-900 | 21 | 0.09 | — | 56 | — |
| Ni/TiO2-900-450R | 26 | 0.10 | 32.9 | 34.7 | 19.2 |
| Ni/anatase-500 | 10 | 0.07 | — | 47.5 | — |
| Ni/anatase-500-450R | 13 | 0.08 | 23.3 | 46 | 89 |
| Ni/anatase-900 | 11 | 0.07 | — | 39.3 | — |
| Ni/anatase-900-450R | 14 | 0.08 | 17.4 | 46.7 | 67 |
| Ni/rutile-500 | 10 | 0.06 | — | 49.3 | — |
| Ni/rutile-500-450R | 16 | 0.08 | 16.4 | 36.7 | 96.4 |
| Ni/rutile-900 | 11 | 0.07 | — | 50.2 | — |
| Ni/rutile-900-450R | 15 | 0.08 | 16.6 | 36.4 | 79 |
The evaluation of XRD patterns of the reduced samples which are calcined at 500 °C showed a decrease in crystallinity of 28% and 61% for anatase and rutile, respectively, while an enhancement in crystallinity (45%) was observed for high surface area titania (TiO2). The XRD patterns suggest that all the Ni atoms on the surface of the three samples are in their elemental state, as discerned from the disappearance of NiO reflections and emergence of Ni0 reflection. The samples which are only calcined at 500 °C did not show any change in crystallinity. However, the reduction of the samples resulted in a twofold decrease in crystallinity for Ni/rutile than for Ni/anatase. This demonstrates more interaction of Ni with rutile than with anatase.
The XRD patterns of samples calcined at 900 °C for 2 h are shown in Fig. 3. Interestingly, calcination of the samples at 900 °C resulted in the formation of nickel titanate for all the samples. All the three samples showed reflections at 2θ of 24.3°, 33.3°, 35.8°, 41° and 49.7°, which are characteristic of the rhombohedral lattice of nickel titanate (JCPDS #89-3743). It was anticipated that Ni/TiO2-900 samples would react more with the NiO to form nickel titanate by virtue of their porous nature, an assessment of intensities of the peaks showed that Ni/rutile-900 exhibited more interaction with NiO to form nickel titanate than Ni/anatase-900 and Ni/TiO2-900. The calcination of Ni/TiO2 at 900 °C converted the anatase phase into rutile. Therefore, the lesser interaction between the NiO and TiO2 is due to utilization of energy for rutilation, besides formation of nickel titanate. It may be noted that Ni/TiO2 required too high an energy (64.9 kJ mol−1 at 25 °C) for the formation of nickel titanate. In the case of nickel supported on anatase, the crystalline anatase is not converted into a rutile phase, which is an energy intensive process of converting one crystalline phase into another. Although rutile and NiO have different crystal structures of hcp and fcc, respectively, the greater interaction of rutile with NiO could be due to a similar packing factor of 0.74 and a coordination number of 12. The Ni supported on anatase required lesser energy (−24 kJ mol−1 at 25 °C) for the formation of nickel titanate while rutile required moderately higher energy (−17.99 kJ mol−1 at 25 °C) than anatase. The nickel titanate formed on the rutile required lower energy (15.86 kJ mol−1 at 25 °C) for its reduction to nickel than that on anatase (21.89 kJ mol−1 at 25 °C). These data show that interaction with NiO is more favored on the anatase surface than on rutile. Similarly the reduction of nickel titanate to Ni in the presence of hydrogen required lesser energy on rutile than on anatase. Some of the nickel titanate reflections at 2θ of 35.9° and 41.1° are found to overlap with the rutile peaks at 2θ of 36.1° and 41.5°, respectively. Probably, this could have allowed the facile transfer of electrons from rutile to NiO and thereby relatively easier reduction to Ni than on anatase.
![XRD patterns of nickel impregnated on various phases of titania and calcined at 900 °C for 2 h. (a) Ni/TiO2; (b) Ni/anatase; (c) Ni/rutile [A – anatase; R – rutile; @ – nickel titanate].](/image/article/2012/CY/c2cy20134h/c2cy20134h-f3.gif) | ||
| Fig. 3 XRD patterns of nickel impregnated on various phases of titania and calcined at 900 °C for 2 h. (a) Ni/TiO2; (b) Ni/anatase; (c) Ni/rutile [A – anatase; R – rutile; @ – nickel titanate]. | ||
Fig. 4 shows the XRD patterns of reduced samples calcined at 900 °C for 2 h. About 15% of the anatase phase in Ni/anatase-900 is converted into rutile after reduction. A broad reflection at 2θ of 44.5°, typical of the fcc-phase of Ni, was observed for all the samples. The reflections characteristic of nickel titanate (Fig. 3) are not seen in Ni/anatase and Ni/rutile suggesting the comprehensive reduction of nickel titanate into Ni. The crystallite sizes for the reduced samples are 32.9 nm, 17.4 nm and 16.6 nm, respectively, for Ni/TiO2-900, Ni/anatase-900 and Ni/rutile-900. The crystallite sizes for Ni supported on anatase and on rutile are similar. On the other hand, Ni/TiO2 possesses twice the crystallite size for Ni than Ni/anatase and Ni/rutile, which shows more sintering.
![XRD patterns of nickel impregnated on various phases of titania and calcined at 900 °C for 2 h and reduced at 450 °C for 8 h. (a) Ni/TiO2; (b) Ni/anatase; (c) Ni/rutile [A – anatase; R – rutile; * – nickel].](/image/article/2012/CY/c2cy20134h/c2cy20134h-f4.gif) | ||
| Fig. 4 XRD patterns of nickel impregnated on various phases of titania and calcined at 900 °C for 2 h and reduced at 450 °C for 8 h. (a) Ni/TiO2; (b) Ni/anatase; (c) Ni/rutile [A – anatase; R – rutile; * – nickel]. | ||
Temperature programmed reduction
The temperature programmed reduction profiles of Ni/TiO2, Ni/anatase and Ni/rutile calcined at 500 °C and 900 °C are shown in Fig. 5 and 6, respectively. It was found that Ni/TiO2-500 could be reduced at lower temperature than Ni/anatase-500 and Ni/rutile-500. Ni/rutile displayed a broader TPR profile than Ni/TiO2 and Ni/anatase. The Ni modified anatase and rutile showed three-stage reduction with a peak reduction at 380 and 351 °C, respectively. A lower peak reduction temperature exhibited by rutile suggests a greater reducible activity of rutile than anatase. The observation of multiple stages of reduction for the Ni present in anatase and rutile is essentially attributed to the strong metal–support interaction between NiO and anatase and rutile titania. The TPR profiles of nickel supported on various phases of titania showed that Ni/TiO2 could be fully reduced at 382 °C while Ni/anatase and Ni/rutile are fully reduced at 437 °C and 464 °C, respectively. The variation in the reduction temperature of nickel on different phases of titania could be due to the different intensity of interaction between the metal and the support. | ||
| Fig. 5 TPR profiles of Ni impregnated on various phases of titania calcined at 500 °C for 2 h. (a) Ni/TiO2; (b) Ni/anatase and (c) Ni/rutile. | ||
 | ||
| Fig. 6 TPR profiles of Ni impregnated on various phases of titania calcined at 900 °C for 2 h. (a) Ni/TiO2; (b) Ni/anatase and (c) Ni/rutile. | ||
The TPR profiles of the samples calcined at 900 °C (Fig. 6) showed a single reduction peak at 670 °C, 657 °C and 677 °C, respectively, for Ni/TiO2-900, Ni/anatase-900 and Ni/rutile-900. An evaluation of the reduction temperatures of the samples calcined at 500 and 900 °C showed a higher reduction temperature for the higher calcination temperature. This is attributed to the formation of nickel titanate as revealed by XRD patterns (Fig. 3). While the samples calcined at 500 °C did not show any nickel titanate formation (Fig. 1). An evaluation of the TPR profiles revealed that Ni/anatase-900 could be reduced at lower temperature than Ni/TiO2-900 and Ni/rutile-900. The observed trend of Ni/anatase-900 < Ni/TiO2-900 < Ni/rutile-900 seems to follow the intensity of interaction between Ni and the support. It may be worth mentioning here that the TPR profiles of the samples calcined at 900 °C are narrower than those of the samples calcined at 500 °C, possibly suggesting a more homogenous characteristic of the composition.
BET surface area, pore volume and crystallite size
The BET surface area and pore volume of the nickel supported on TiO2, anatase and rutile calcined at 500 °C and 900 °C and thereafter reduced at 450 °C under flowing hydrogen are shown in Table 1. The BET surface areas of the unmodified TiO2, anatase and rutile supports were, respectively, 275, 12 and 11 m2 g−1. An inspection of the table reveals the following: in the case of Ni/TiO2-500, the surface area was found to decrease with the calcination temperature and on reducing the sample. The decrease in the surface area could be due to aggregation of particles leading to lowering of porosity of the samples. On the other hand, there was an increase in the surface area when Ni/TiO2-900 was reduced. Interestingly, both Ni/anatase-500 and Ni/rutile-500 were found to show a moderate increase in surface area when the calcination temperature was increased to 900 °C. Both Ni/anatase and Ni/rutile exhibited an increase in the surface area on reduction similar to Ni/TiO2-900. The pore volume of Ni/TiO2 samples was found to be greater than those of Ni/anatase and Ni/rutile under given conditions. There was a decrease in pore volume with calcination temperature for Ni/TiO2 while it remains more or less the same for Ni/anatase and Ni/rutile. Excepting Ni/TiO2-500, other samples showed a marginal increase in pore volume on reduction. The Ni crystallite size was measured for the reduced samples. The order found for samples calcined at 500 °C was Ni/anatase > Ni/rutile > Ni/TiO2 while the order observed at 900 °C was Ni/TiO2 > Ni/anatase > Ni/rutile. The Ni crystallite size was found to increase for Ni/TiO2, decrease for Ni/anatase and moderately increase for Ni/rutile with increase in calcination temperature. The crystallite size of TiO2 particles of Ni/TiO2-500 increased with temperature and on reduction, while it decreased for Ni/TiO2-900 when the sample was reduced. The crystallite size of TiO2 follows the order: Ni/rutile-500 > Ni/anatase-500 > Ni/TiO2-500 and Ni/TiO2-900 > Ni/rutile-900 > Ni/anatase-900. The change in crystallite size does not seem to follow a regular pattern in the case of reduced samples.Effect of temperature
The effect of temperature on the conversion of ACP has been examined on Ni impregnated on various phases of titania and calcined at 500 °C at a hydrogen pressure of 40 kg cm−2 and the results are shown in Fig. 7. Interestingly, the conversion of ACP proceeded with atom economy to the exclusive formation of phenylethanol (PE). An increase in conversion of ACP with increasing temperature was observed. At 120 °C, the conversion was lower for all the samples and the highest conversion (18.9%) was exhibited by Ni/rutile-500. At 130 °C, again Ni/rutile-500 exhibited a maximum activity of 45.3%. A maximum conversion of 96.7% obtained on Ni/rutile-500 at 140 °C has prompted us to perform further investigation at 140 °C. The observed trend for ACP conversion at the temperatures studied is: Ni/rutile > Ni/anatase > Ni/TiO2. The enhanced synergistic effect between rutile and Ni has a stronger influence on the catalytic activity of Ni/rutile than on the other samples. The Ni/TiO2 catalyst sample was found to possess lower activity than Ni/anatase and Ni/rutile. This could be due to the formation of Ti2O3 moieties in a facile manner in Ni/TiO2, which may physically block the active nickel sites thereby altering the adsorptive properties of the Ni sites. In addition, the electronic properties of the Ni atoms near the Ti2O3 species may get influenced leading to a lower conversion of ACP. Although the crystallite size of Ni supported on TiO2 is smaller (15.4 nm) than those on rutile (16.4 nm) and anatase (23.3 nm), Ni/anatase-500 and Ni/rutile-500 showed higher conversion than Ni/TiO2-500. This could be due to higher concentration of nickel on the surface of anatase and rutile than on TiO2 suggesting that they serve as an effective support for the preparation of reduction catalysts. | ||
| Fig. 7 Effect of temperature on the conversion of acetophenone on Ni supported on various phases of titania (H2 pressure = 40 kg cm−2; rpm = 600). ■, Ni/rutile; ●, Ni/anatase; ▲, Ni/TiO2. | ||
Effect of hydrogen pressure
In the liquid phase hydrogenation, hydrogen pressure is a significantly important parameter, as hydrogen serves as one of the reactants. The effect of hydrogen pressure on the conversion of ACP on Ni supported on various phases of titania is shown in Fig. 8. The conversion was found to increase with H2 pressure. It may be noted that at H2 pressures of 10 and 20 kg cm−2, the conversion was found to be lower than at higher hydrogen pressures for all the samples. The highest conversion was exhibited by Ni/rutile (6.5%) followed by Ni/anatase (5.4%) and Ni/TiO2 (2.5%) at 20 kg cm−2. At 30 kg cm−2, Ni/rutile exhibited a maximum activity of about 15%, trailed by Ni/anatase and Ni/TiO2, and at 40 kg cm−2, a maximum conversion of 96.4% was observed for Ni/rutile. The observed order for the conversion of ACP, irrespective of H2 pressure, is Ni/rutile > Ni/anatase > Ni/TiO2. The selectivity to PE is 100% on all the catalysts. A significant enhancement in conversion of ACP with hydrogen pressure illustrates the preferential adsorption of hydrogen on the surface of the catalyst over ACP. Thus the rate of hydrogenation appears to depend only on the adsorption of hydrogen on the catalyst surface. The presence of ACP in the solvent phase seems to lend support to this point. | ||
| Fig. 8 Effect of pressure on the conversion of acetophenone on Ni supported on various phases of titania (temp. = 140 °C; rpm = 600). ■, Ni/rutile; ●, Ni/anatase; ▲, Ni/TiO2. | ||
Effect of Ni loading
Nickel was supported on TiO2, anatase and rutile by conventional impregnation using an aqueous solution of Ni(NO3)2·6H2O. The Ni content was varied from 2.5 through 15 wt%. Catalysts, after drying at 100 °C, were subjected to calcination at 500 °C in air and thereafter to reduction at 450 °C for 4 h in flowing hydrogen. The Ni content of the samples was analysed using an XRF spectrometer. Fig. 9 shows the effect of Ni loading on the conversion of ACP. The experimental conditions used are: 140 °C, 40 kg cm−2 hydrogen pressure and reaction duration of 1 h. The catalytic activity of the samples is found to increase with increasing Ni content, which is attributed to the presence of more nickel active sites on the surface of the catalyst. A maximum conversion of 96.7% was observed for 15% loading of Ni on rutile. The observed order for the conversion of ACP for various Ni loadings is: Ni/rutile > Ni/anatase > Ni/TiO2. The highest conversion was observed at 15% Ni loading and, therefore, all the experiments were carried out at 15% Ni loading. | ||
| Fig. 9 Effect of % of nickel on the conversion of acetophenone (temp. = 140 °C; H2 pressure = 40 kg cm−2; rpm = 600). ■, Ni/rutile; ●, Ni/anatase; ▲, Ni/TiO2. | ||
Effect of calcination temperature
One of the objectives of this investigation is to identify the optimum calcination temperature for the catalyst. The study also aims to understand the influence of calcination temperature on the characteristics of the catalyst. The samples calcined at <500 °C showed lower catalytic activity than the samples calcined at 500 °C and hence the former results are not considered. Similarly, the samples calcined at 700 °C showed an intermediate activity between those of samples calcined at temperatures of 500 and 900 °C and are excluded.A perusal of Table 1 reveals a catalytic activity order of Ni/rutile > Ni/anatase > Ni/TiO2 for hydrogenation of ACP both at 500 °C and 900 °C. There is a decrease in catalytic activity at 900 °C in comparison with that at 500 °C for all the supports. The drop in the activity was higher for Ni/TiO2 (58%) than for Ni/anatase (24.7%) and Ni/rutile (18%). The lower activity at 900 °C may be in general due to sintering of Ni and the accompanied decrease in active surface concentration of Ni, and the sintering appears to be more severe in the case of Ni/TiO2. Moreover, at 900 °C, there is an increase in crystallite size of Ni and TiO2, and BET surface area for Ni/TiO2, which suggests agglomeration leading to a decrease in surface Ni concentration. It is apparent from these data that Ni/rutile possesses a higher activity than other supports irrespective of the calcination temperature.
When comparing the activities of Ni/anatase-500 and Ni/rutile-500, the Ni/rutile sample showed higher conversion than Ni/anatase. Both the samples are non-porous in nature with comparable surface areas of 13–16 m2 g−1 while the crystallite size of Ni supported on rutile is lower than that on anatase. A lower Ni crystallite size in Ni/rutile possibly explains its higher activity when compared to Ni/anatase. The present study reveals that the calcination at 900 °C showed a lesser effect on rutile than on anatase. The high surface area titania exhibited a marked effect when the calcination temperature was increased to 900 °C which modified the crystallite size of nickel and consequently decreased the conversion of ACP. There are other characteristics of the support, such as the surface enthalpy, unsatisfied charge on the surface,27 hydrothermal stability (rutile > anatase > high surface area titania), redox property, metal–support interaction and the concentration of nickel on the surface of the catalyst, that could play a role in the observed catalytic activity. Interestingly, the higher surface enthalpy of rutile than that of anatase could have prevented the aggregation of Ni particles leading to greater concentration of Ni on the surface of Ni/rutile than on anatase leading to a greater activity of Ni/rutile.
Catalyst stability
The conversion of ACP with time was evaluated by performing the reaction at 140 °C and 40 kg cm−2 hydrogen pressure (Fig. 10) with a view to measure the stability of the catalysts. The reaction was performed for 14 h. At every hour, the reactor effluent was decanted and analysed on a GC, while the reactor containing the spent catalyst was charged with fresh reactants and the reaction was continued. It was observed that the conversion decreased with time on stream by 0.6%, 2.8% and 11%, respectively, for Ni/rutile-500, Ni/anatase-500 and Ni/TiO2-500 at the end of 14 h. This shows that the activity is only marginally lost on Ni/rutile and Ni/anatase when compared to Ni/TiO2. The higher activity of Ni/rutile could be due to the strong metal–support interaction between Ni and rutile, arising from high surface enthalpy and unsatisfied charges on rutile. The electron density on Ni is altered as a result of electron transfer between Ni and rutile. The interaction between Ni and Ti3+ may generate negative charge on Ni atoms which may enhance the activity of Ni/rutile for the hydrogenation of ACP.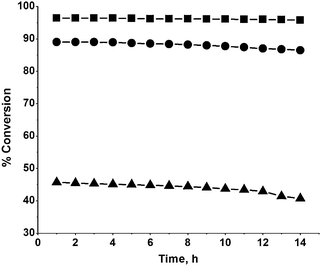 | ||
| Fig. 10 Effect of catalyst stability on the conversion of acetophenone (temp. = 140 °C; H2 pressure = 40 kg cm−2; rpm = 600). ■, Ni/rutile; ●, Ni/anatase; ▲, Ni/TiO2. | ||
Reaction mechanism and product selectivity
The ACP molecule possesses two reducible centers, viz. a carbonyl group and an aromatic ring, and in principle one could observe a mix of reduced products and the completely reduced product. The carbonyl group may get reduced to form the corresponding PE which can further be reduced to ethylbenzene. The reduction of ACP performed on Ni supported titania catalysts under different experimental conditions in this investigation clearly demonstrates the formation of PE in exclusivity. Irrespective of the nature of titania phase and the extent of Ni loading, the selectivity for PE is 100%. The hydrogenation of the aromatic ring requires about 12 times higher energy (150.1 kJ mol−1 at 25 °C) than the hydrogenation of the carbonyl group (−14.1 kJ mol−1 at 25 °C) in ACP. Also, the hydrogenation of the aromatic ring in ACP requires the adsorption of the benzene ring on the surface of the catalyst. It may be noted that on a polar support like TiO2, the adsorption of C![[double bond, length as m-dash]](https://www.rsc.org/images/entities/char_e001.gif) C or benzene is less likely compared to the adsorption of the carbonyl group.
C or benzene is less likely compared to the adsorption of the carbonyl group.
The activity of various phases of titania is found to be different, which shows that the strength of adsorption of the carbonyl group or the concentration of nickel hydride on the surface is different on the various phases of titania. As described earlier, hydrogen is adsorbed on the surface of the catalyst to form nickel hydrides. Unlike Ni/anatase and Ni/TiO2 samples, there is a significant electronic interaction between Ni and rutile which enhances the adsorption of H2 molecules. The increase in electron density of Ni could facilitate the formation of electron-enriched Ni–H species on the surface of the catalyst and consequently activating the H atoms by weakening of the Ni–H bond. This activated H species is anticipated to attack the carbonyl group of ACP leading to PE formation.
4. Conclusions
The catalytic activity of Ni impregnated on various phases of titania has been investigated for the hydrogenation of ACP. The catalyst samples calcined at low temperatures show the presence of bulk NiO species which are reduced to elemental Ni (fcc phase) on reduction, as discerned from the reflections in XRD. The calcination at 900 °C followed by reduction showed more sintering of Ni in Ni/TiO2 than in Ni/anatase and Ni/rutile. A lower peak reduction temperature in TPR for Ni/rutile suggests its greater reducible property. A higher complete reduction temperature for Ni/rutile points out a strong metal–support interaction. A Ni content of 15 wt%, hydrogen pressure of 40 kg cm−2 and reaction temperature of 140 °C were found to be optimum to achieve good conversion of ACP. The samples calcined at 500 °C showed higher activity than those calcined at 900 °C. The catalytic activity studies demonstrate that Ni/rutile exhibits more activity and the observed order is Ni/rutile > Ni/anatase > Ni/TiO2. This trend is essentially attributed to higher concentration of Ni on the surface of rutile and SMSI between rutile and Ni than that between Ni and anatase or TiO2. The electronic interaction between Ni and rutile enhances the adsorption of H2 molecules and formation of electron-enriched Ni–H species which interact with the carbonyl group of ACP. The catalyst stability studies showed that activity is lost only marginally in rutile and anatase. Interestingly, phenylethanol is the only product formed on all the samples irrespective of the reaction conditions. In other words, the hydrogenation of ACP on Ni-impregnated titania supports proceeds with atom economy, which makes the titania supported catalysts as catalysts of choice for a greener world. From this investigation, it is clear that non-porous rutile and anatase titania are better supports than porous high surface area titania, and more specifically rutile phase, for this class of reaction.Acknowledgements
The authors acknowledge the Department of Science and Technology, Government of India, for funding the National Centre for Catalysis Research (NCCR) at IIT-Madras.References
- K. Bauer and D. Garbe, Ullmann’s Encyclopedia, VCH, New York, 3rd edn, 1988, vol. A11, p. 141 Search PubMed.
- P. Rylander, Hydrogenation Methods, Academic Press Inc, London, 1985, p. 66 Search PubMed.
- M. A. Aramendia, V. Borau, C. Jimenez, J. M. Marinas, M. E. Sempere and P. Urbano, Appl. Catal., 1988, 43, 41–55 CrossRef CAS.
- P. S. Kumbhar, Appl. Catal., A, 1993, 96, 241–252 CrossRef CAS.
- I. Bergault, P. Fouilloux, C. Joly-Vuillemin and H. Delmas, J. Catal., 1998, 175, 328–337 CrossRef CAS.
- N. Lavaud, P. Magnoux, F. Alvarez, L. Melo, G. Giannetto and M. Guisnet, J. Mol. Catal. A: Chem., 1999, 142, 223–236 CrossRef CAS.
- M. V. Rajashekharam, I. Bergault, P. Foilloux, D. Schweich, H. Delmas and R. V. Chaudhari, Catal. Today, 1999, 48, 83–92 CrossRef CAS.
- I. Bergault, C. Joly-Vuillemin, P. Fouilloux and H. Delmas, Catal. Today, 1999, 48, 161–174 CrossRef CAS.
- S. D. Lin, D. K. Sanders and M. A. Vannice, Appl. Catal., A, 1994, 113, 59–73 CrossRef CAS.
- H. Liu, G. Lu, Y. Guo, Y. Wang and Y. Guo, Catal. Commun., 2009, 10, 1324–1329 CrossRef CAS.
- C. Chen, H. Chen and W. Cheng, Appl. Catal., A, 2003, 248, 117–128 CrossRef CAS.
- A. Drelinkiewicza, A. Waksmundzka, W. Makowski, J. W. Sobczak, A. Krol and A. Zieba, Catal. Lett., 2004, 94, 143–156 CrossRef CAS.
- J. A. Anderson, A. Athawale, F. E. Imrie, F. M. McKenna, A. McCue, D. Molyneux, K. Power, M. Shand and K. P. R. Wells, J. Catal., 2010, 270, 9–15 CrossRef CAS.
- M. Casagrande, L. Storaro, A. Talon, M. Lenarda, R. Frattini, E. R. Castellon and P. M. Torres, J. Mol. Catal. A: Chem., 2002, 188, 133–139 CrossRef CAS.
- S. Hamar-Thibault, J. Masson, P. Fouilloux and J. Court, Appl. Catal., A, 1993, 99, 131–145 CrossRef CAS.
- J. Masson, S. Vidal, P. Cividino, P. Fouilloux and J. Court, Appl. Catal., A, 1993, 99, 147–159 CrossRef CAS.
- R. V. Malyala, C. V. Rode, M. Arai, S. G. Hedge and R. V. Chaudhari, Appl. Catal., A, 2000, 193, 71–86 CrossRef CAS.
- A. F. Gaspar, P. P. Gonzalez, M. G. Crestani, M. M. Hernandez, D. M. Morales, B. A. Warsop, W. D. Jones and J. J. Garcia, J. Mol. Catal. A: Chem., 2009, 309, 1–11 CrossRef.
- J. C. Park, H. J. Lee, J. Y. Kim, K. H. Park and H. Song, J. Phys. Chem. C, 2010, 114, 6381–6388 CAS.
- F. Alonso, J. J. Calvino, I. Osante and M. Yus, Chem. Lett., 2005, 1262–1263 CrossRef CAS.
- F. Alonso, P. Riente and M. Yus, Tetrahedron Lett., 2008, 49, 1939–1942 CrossRef CAS.
- F. Alonso, P. Riente and M. Yus, Tetrahedron, 2008, 64, 1847–1852 CrossRef CAS.
- C. H. Bartholomew, R. B. Pannell, J. L. Butler and D. G. Mustard, Ind. Eng. Chem. Prod. Res. Dev., 1981, 20, 296–300 CrossRef CAS.
- J. Chen, N. Yao, R. Wang and J. Zhang, Chem. Eng. J., 2009, 148, 164–172 CrossRef CAS.
- R. Burch and A. R. Flambard, J. Catal., 1982, 78, 389–405 CrossRef CAS.
- K. J. A. Raj, A. V. Ramaswamy and B. Viswanathan, J. Phys. Chem. C, 2009, 113, 13750–13757 CAS.
- H. Zhang and J. F. Banfield, J. Mater. Chem., 1998, 8, 2073–2076 RSC.
| This journal is © The Royal Society of Chemistry 2012 |