Preparation of silica supported ceria–lanthana solid solutions useful for synthesis of 4-methylpent-1-ene and dehydroacetic acid†
Lakshmi
Katta
,
Putla
Sudarsanam
,
Baithy
Mallesham
and
Benjaram M.
Reddy
*
Inorganic and Physical Chemistry Division, Indian Institute of Chemical Technology, Uppal Road, Hyderabad-500607, India. E-mail: bmreddy@iict.res.in; mreddyb@yahoo.com; Fax: +91 40 2716 0921; Tel: +91 40 27191714
First published on 26th January 2012
Abstract
The intriguing research toward the exploitation of ceria-based materials for various applications has been growing significantly. In the present investigation, we describe the preparation, characterization and utilization of CeO2–La2O3 (CL) and CeO2–La2O3/SiO2 (CLS) solid solutions for the synthesis of two industrially useful chemicals namely 4-methylpent-1-ene and dehydroacetic acid. Coprecipitation and deposition coprecipitation from ultrahigh dilute solutions were used for the synthesis of CL and CLS catalysts, respectively. The physicochemical characterization has been achieved with the help of various techniques namely X-ray diffraction (XRD), BET surface area, transmission electron microscopy (TEM), UV-visible diffuse reflectance spectroscopy (UV-vis DRS), Raman spectroscopy (UV-RS and Vis-RS), X-ray photoelectron spectroscopy (XPS) and temperature programmed desorption (TPD) measurements. The structure–activity relationships helped to correlate different parameters that are necessary for obtaining desired products in good yields. The inclusion of silica support has an optimistic influence on the acid–base properties of the ceria–lanthana, in terms of both amount and strength of sites. The presence of silica not only manipulates the acid–base properties but also causes numerous benefits, for instance, it improves the dispersion, stabilizes the active component against sintering and enriches the oxygen vacancy concentration. The meticulous analysis of characterization and activity studies revealed the significant role of acid–base sites in directing the desired products. Interestingly, the CLS catalyst has shown better performance in the production of both 4-methylpent-1-ene and dehydroacetic acid compared to the unsupported CL sample due to well-balanced acid–base sites.
1. Introduction
Over the past decades, rare earth oxides have gained enormous attention in various fields because of their multifaceted nature. Plentiful studies on these oxides have revealed the supremacy of their characteristics in heterogeneous catalysis. Also, their promising use in materials science, biotechnology, environmental science and electronic industry is well-appreciated.1–6 Certainly, CeO2, a promising rare-earth oxide, has been rapidly emerging as a new appealing material owing to its unique structural, redox and acid–base properties.7–9 These eminent features make ceria effective in industrial catalysis (e.g., automotive catalytic converters) to decrease harmful pollutants from combustion exhausts. Besides, ceria-based materials are the key components in solid-oxide fuel cells, water-gas-shift reaction, catalytic combustion of volatile organic compounds, synthesis of cyclic carbonates, oxidative dehydrogenation of alkanes, selective oxidation of hydrocarbons, etc.10–13 Additionally, nanosized ceria serves as nanomedicine with neuroprotective and radio protective properties.14It is important to emphasize that the acid–base properties of metal oxides play a vital role in catalysis. There are several chemical processes that have been industrially exploited for various applications based on surface acid–base sites of the metal oxide catalysts.15–17 Despite its active role in several catalytic applications, diminutive venture has been undertaken on the acid–base features of ceria. Generally, the acidic- and/or basic-strength of the mixed oxides may vary depending on the charge and radius of the cations.18 The acidic-strength of Ce4+ (4.26 C Å−1) ions is expected to be more than that of Ce3+ (2.54 C Å−1) ions because of high charge-to-radius ratio of the former. Therefore, pure ceria is acidic in nature due to the existence of Ce4+ in a higher amount than Ce3+ ions. However, for a broad spectrum of practical utility, there is a need for development of catalysts with both acidic and basic properties. The substitution of dopants into the ceria lattice serves as a powerful tool in the design of versatile materials. Noticeably, the cations in the mixed oxides can work in a cooperative way, catalyzing different steps of a chemical process. Furthermore, the combination of different metals in an oxide matrix can produce materials with novel structural and/or electronic properties, which can lead to better catalytic activity and selectivity.19–21 For instance, CeO2–MgO exhibits a large number of weak basic sites responsible for alkylation reaction.22,23 Similarly, in the case of CeO2–CaO system, the surface acid–base property was found to increase at low ceria content.24 In an attempt to manipulate the redox and acid–base properties of ceria, La3+ doped ceria has been synthesized and investigated. The Ce–La (80![[thin space (1/6-em)]](https://www.rsc.org/images/entities/char_2009.gif) :
:![[thin space (1/6-em)]](https://www.rsc.org/images/entities/char_2009.gif) 20) sample is expected to show promising acidic and basic characteristics, due to significant variation in the charge and ionic radius of Ce4+ (0.097 nm) and La3+ (0.111 nm) ions.
20) sample is expected to show promising acidic and basic characteristics, due to significant variation in the charge and ionic radius of Ce4+ (0.097 nm) and La3+ (0.111 nm) ions.
It is well-known that structural/textural stability and acid–base properties of ceria-based oxides are greatly influenced by thermal treatments. Stabilization of nano-oxides on an inert support to form stable and active catalysts could represent a suitable way to overcome the drawbacks.25,26 Silica is extensively used as a support due to its high specific surface area and thermal durability. Therefore, silica supported active species in well-dispersed form provides a fruitful environment for various applications over a wide range of temperatures.27
Since the pioneering works of Pines and Pillai, the synthesis of 1-alkenes using metal oxides has been widely studied.28 For instance, 4-methylpent-1-ene, a starting material for polymers of superior technological properties, could be conveniently prepared through the dehydration of 4-methylpentan-2-ol. Competition between the formation of alk-1-ene and alk-2-ene usually occurs and further complexity can arise from the simultaneous dehydrogenation of the alcohol to ketones. Such a reaction has been examined over several metal oxide systems and it was found that fine tuning of the acid–base character of the catalyst is essential in order to obtain high selectivity towards the desired 1-alkene and avoid parasitic formation of olefins with internal double bond and/or dehydrogenation to ketone.29
As an additional application, we have also synthesized the dehydroacetic acid (DHA) which has enormous applications. For example, DHA and their sodium salts have been extensively used in cosmetics and pharmaceuticals because of their broad antimicrobial spectrum with better stability and non-volatility.30 They are prescribed to be practically nonirritating, nonphototoxic and nonsensitizing in plentiful clinical tests. Derivatives of DHA are also finding versatile utilization due to their promising chemical properties and biological activities. DHA is known to react with amines and results in the corresponding enamino derivatives for various pharmacological uses.31 As well, DHA reacts with aromatic aldehydes to afford styrene derivatives, which can be transformed into γ-pyrones under acidic conditions.32 Prakash et al. have reported the synthesis of dihydro-1,5-benzothia-zepines and dihydro-1,4-benzothiazines from DHA and these derivatives are of huge biological importance.33 1,2,6-Trimethyl-4-piperidone is an important intermediate in the synthesis of many drugs (opioid analgesics), which could be obtained starting from the DHA followed by catalytic hydrogenation and Swern oxidation.34
The present study was focused on the design of CeO2–La2O3 (CL) and CeO2–La2O3/SiO2 (CLS) catalysts for the production of 4-methylpent-1-ene and DHA. The described 4-methylpent-1-ene and DHA products were synthesized by catalytic dehydration of 4-methylpentan-2-ol and self-condensation of ethyl acetoacetate, respectively. The designed catalysts were evaluated using various techniques namely X-ray diffraction (XRD), BET surface area, transmission electron microscopy (TEM), UV-visible diffuse reflectance spectroscopy (UV-vis DRS), Raman spectroscopy (UV-RS and Vis-RS), X-ray photoelectron spectroscopy (XPS) and temperature programmed desorption (TPD) measurements. Attempts were made to correlate the catalytic activity with the structural features of the catalysts.
2. Experimental section
2.1 Catalyst preparation
The investigated CeO2–La2O3/SiO2 (CLS, 80![[thin space (1/6-em)]](https://www.rsc.org/images/entities/char_2009.gif) :
:![[thin space (1/6-em)]](https://www.rsc.org/images/entities/char_2009.gif) 20
20![[thin space (1/6-em)]](https://www.rsc.org/images/entities/char_2009.gif) :
:![[thin space (1/6-em)]](https://www.rsc.org/images/entities/char_2009.gif) 100 mole ratio based on oxides) was synthesized by a facile and economical deposition coprecipitation method. In a typical procedure, colloidal SiO2 (Ludox, 40 wt%, Aldrich) was dispersed in deionized water and stirred for 2 h. The desired amounts of Ce(NO3)3·6H2O (Aldrich, AR grade) and La(NO3)3·6H2O (Aldrich, AR grade) were dissolved in deionised water under mild stirring conditions and then the resultant Ce–La nitrate solution was added to the aforesaid support solution. Subsequently, aqueous NH3 solution was added drop wise to the mixture solution until pH ∼8.5 and the resulting slurry was filtered off. The obtained cake was oven dried at 383 K for 12 h and finally calcined at different temperatures from 773 to 1073 K in order to examine the thermal stability and the physicochemical properties of the materials. For comparison, a ceria–lanthana (CL, 80
100 mole ratio based on oxides) was synthesized by a facile and economical deposition coprecipitation method. In a typical procedure, colloidal SiO2 (Ludox, 40 wt%, Aldrich) was dispersed in deionized water and stirred for 2 h. The desired amounts of Ce(NO3)3·6H2O (Aldrich, AR grade) and La(NO3)3·6H2O (Aldrich, AR grade) were dissolved in deionised water under mild stirring conditions and then the resultant Ce–La nitrate solution was added to the aforesaid support solution. Subsequently, aqueous NH3 solution was added drop wise to the mixture solution until pH ∼8.5 and the resulting slurry was filtered off. The obtained cake was oven dried at 383 K for 12 h and finally calcined at different temperatures from 773 to 1073 K in order to examine the thermal stability and the physicochemical properties of the materials. For comparison, a ceria–lanthana (CL, 80![[thin space (1/6-em)]](https://www.rsc.org/images/entities/char_2009.gif) :
:![[thin space (1/6-em)]](https://www.rsc.org/images/entities/char_2009.gif) 20 mole ratio based on oxides) sample was also prepared following the same procedure under identical conditions.
20 mole ratio based on oxides) sample was also prepared following the same procedure under identical conditions.
2.2 Characterization studies
The synthesized materials were analyzed by X-ray diffraction using a Rigaku Multiflex instrument equipped with a nickel-filtered Cu Kα (0.15418 nm) radiation source and a scintillation counter detector. The intensity data were collected over a 2θ range of 12–80° with a 0.02° step size and using a counting time of 1 s per point. The average crystallite size of the oxide phases was estimated with the help of Scherrer equation and the lattice parameter was calculated by a standard cubic indexation method.The TEM studies were carried out on a JEM-2010 (JEOL) instrument equipped with a slow-scan CCD camera at an accelerating voltage of 200 kV. Samples for TEM were prepared by crushing the materials in an agate mortar and dispersing them ultrasonically in ethyl alcohol. After dispersion, a droplet was deposited on a copper grid supporting a perforated carbon film and allowed to dry. The specimen was examined under vacuum at room temperature.
Specific surface areas of the samples were determined by a single point BET analysis on a SMART SORB–92/93 instrument via a thermal conductivity detector. Prior to the experiment, samples were degassed at 393 K for 2 h to remove surface adsorbed residual moisture.
The UV-vis DRS measurements were performed over the wavelength range of λ = 200–750 nm using a GBS-Cintra 10e UV-vis NIR spectrophotometer with an integration sphere diffuse reflectance attachment. The band gap of the samples was determined from the equation Eg = 1239.8/λ, where Eg is the band gap (eV) and λ (nm) is the wavelength of the absorption edges in the spectrum.
The Raman spectra were obtained at room temperature using a LabRam HR800UV Raman spectrometer (Horiba Jobin-Yvon) fitted with a confocal microscope and a liquid-nitrogen cooled charge-coupled device (CCD) detector. Samples were excited either with 325 nm of a He–Cd laser (Melles Griot Laser) or with the emission line at 632.81 nm from an Ar+ ion laser (Spectra Physics) which was focused on the sample under the microscope with the diameter of the analyzed spot being ∼1 μm. The acquisition time was adjusted according to the intensity of the Raman scattering.
The XPS analysis was performed using a Shimadzu (ESCA 3400) spectrometer. The X-ray source utilized was Mg Kα (1253.6 eV) radiation. The analysis was done at room temperature and samples were maintained in a rigorous vacuum typically in the order of less than 10−8 Pa to avoid large amount of noise in the spectra from contaminates. All binding energies measured were within a precision of ±0.2 eV. The binding energies were corrected by setting the binding energy (BE) of the adventitious carbon (C 1s) peak at 284.6 eV.
The TPD (NH3–TPD and CO2–TPD) measurements were performed on a Micromeritics AutoChem 2910 instrument. A thermal conductivity detector was used for continuous monitoring of the desorbed gas and the areas under the peaks were integrated. Prior to TPD measurements, samples were pre-treated at 573 K for 1 h and then saturated with ultra-pure anhydrous NH3/CO2 for 1 h, and subsequently flushed with He to remove the physisorbed gas.
2.3 Activity studies
Dehydration activity measurements were conducted in a down flow fixed-bed microreactor.35 In a typical experiment, 0.5 g of catalyst was taken in a quartz micro-reactor (i.d. 0.8 cm) and placed vertically inside a tubular furnace. The catalyst was preheated at 773 K for 5 h under CO2-free air flow prior to the reaction. The 4-methylpentan-2-ol was fed into the vaporizer at a flow rate of 1.5 mL h−1 under an N2 flow rate of 60–70 mL min−1. The reaction was carried out in the temperature region of 573–723 K with the intervals of 50 K. To monitor the progress of the reaction, the condensed liquid products were collected at the bottom of the reactor and analyzed by GC equipped with BP-20 (wax) capillary column and a flame ionization detector (FID).Self-condensation of ethylacetoacetate was also performed in the same apparatus as described above. Here also, the catalyst (0.5 g) was preheated at 773 K for 5 h under a CO2-free air flow prior to the reaction. Ethylacetoacetate was fed with a N2 stream (60–70 mL min−1) into the vaporizer at a flow rate of 1.5 mL h−1. The reaction was carried out in the temperature region of 573–723 K with the intervals of 50 K. The reaction mixture was analyzed by GC equipped with BP-20 (wax) capillary column and FID. Also, the products were confirmed by GC-MS equipped with a DB-5 capillary column with FID and NMR spectroscopy. In both the activity studies, the conversion and product selectivity were calculated as per the procedure described elsewhere.35
3. Results and discussion
3.1 Structural characterization
The XRD patterns of the catalysts investigated in the current study are shown in Fig. 1 along with the XRD profiles of pristine ceria. The XRD of pure ceria is characteristic of a cubic fluorite-type crystal structure. The diffraction patterns of the investigated catalysts are exactly the same as that of ceria, thus confirming the existence of a single-phase cubic structure.7 The XRD profiles of La3+ doped ceria are significantly affected by the addition of support. Compared to ceria and CL patterns, the CLS peaks are broad. The broad nature of the peaks distinctly indicates the nanocrystalline nature of the samples. Additionally, within the detection limits there were no peaks due to lanthana and silica phases indicating formation of Ce–La–O solid solutions over the silica support. And, there are no XRD lines pertaining to mixed phases of the oxides of ceria–silica and lanthana–silica. This could be attributed to combination of various factors such as strong interaction between the cerium and lanthanum oxides to form solid solutions, use of inert colloidal silica as the support, and lower calcination temperatures employed. Interestingly, ceria features in the CLS sample are slightly shifted to high angles relative to CL samples. Upon increasing the calcination temperature, unlike C and CL samples, no appreciable change in the intensity of the lines and further a regular shift in the peak position towards lower angle are observed for CLS samples.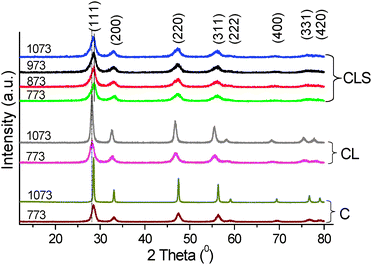 | ||
| Fig. 1 XRD patterns of ceria (C), ceria–lanthana (CL) and silica supported ceria–lanthana (CLS) solid solutions calcined at various temperatures. | ||
Using the most intense line (111) of the XRD patterns, calculation of cell parameter ‘a’ was carried out and the derived values are summarized in Table 1.19 The size of the unit cell is found to increase after incorporation of La3+ ions into the ceria lattice in agreement with Vegard's law.7,20 That means substitution of Ce4+ (0.097 nm) with the large sized La3+ cation (0.11 nm) causes expansion of the CeO2 lattice attributed to the structural distortion. On the other hand, the lattice parameter for CLS is decreased relative to the CL sample. This disparate feature might be due to slight incorporation of a Si4+ (0.041 nm) ion into the ceria lattice. It should be noted that there is a gradual increase in the cell parameter with calcination temperature which is also supported by a small shift towards lower angle. This increase could be due to steady confiscation of the Si4+ ions from the lattice cell with increase in calcination temperature.
The crystallite size (Table 1) of each sample was calculated by using XRD data of the most prominent lines (111), (200), (220) and (311). BET surface areas of various samples are also listed in Table 1. As expected, small crystallite size at low calcination temperature and a meagre increase in the crystallite size with temperature were observed. The 773 K calcined CLS sample exhibited a very high specific surface area of 112 m2 g−1. With increase in calcination temperature from 773 to 1073 K, the specific surface area gradually decreased and after 1073 K temperature, a surface area of 79 m2 g−1 was obtained. Retaining smallest crystallite size and high specific surface area under high temperature treatments is a remarkable observation which clearly establishes the significance of the support and the preparation method adopted.
To investigate the structural aspects at atomic scale, the electron microscopic studies were performed, which on the other hand, can complement the results obtained from XRD measurements. Fig. 2 and 3 represent the HREM global pictures of CL and CLS samples calcined at 773 and 1073 K, respectively. These images disclose that most of the grains exhibit irregular shapes, and the grain size of the CLS samples ranges from ∼6 to 7 nm, which is in agreement with the XRD analysis (Table 1). A very nominal increase in the grain size with calcination temperature has been noticed for CLS than that of the CL sample.
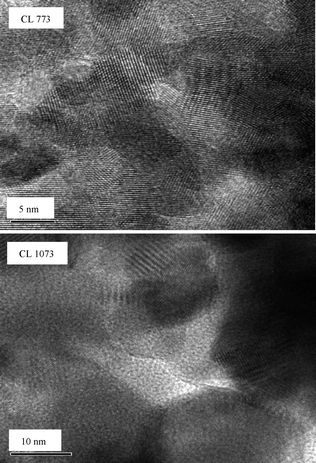 | ||
| Fig. 2 HREM images of ceria–lanthana (CL) solid solution calcined at 773 and 1073 K. | ||
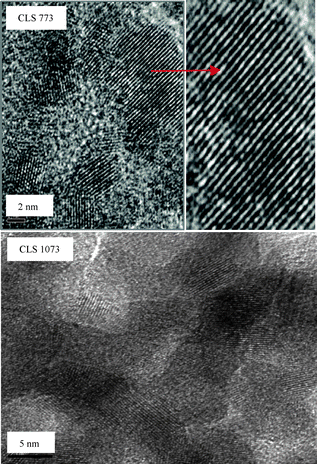 | ||
| Fig. 3 HREM images of silica supported ceria–lanthana (CLS) solid solution calcined at 773 and 1073 K (inset: expanded view). | ||
UV-vis DRS measurement is a promising method to obtain the information about oxygen–metal ion charge transfer bands regardless of difficulty in interpreting large bandwidths and specular reflectance often observed in the spectra.26 The UV–vis DRS of C, CL and CLS samples calcined at 773 K are shown in Fig. 4. Crystalline cerium dioxide has a band gap of 3.1 eV and absorbs strongly in the UV region with the absorption threshold near 400 nm.36 Generally, the absorption of ceria in the UV region originated from charge-transfer transitions between O 2p and Ce 4f bonds that overrun the familiar f to f spin–orbit splitting of the Ce 4f state. Importantly, the onset of the absorption edge in the UV absorption spectra of CeO2 has attracted much interest in recent years which can be used to calculate the band gap of the semiconducting oxide. As seen from the figure, the absorption edge is blue-shifted towards lower wavelength from C → CL → CLS and the band gap energy is increased accordingly. The blue-shift in the absorption edge has been well correlated to the reduction in the particle size.37 The observed blue-shift order is in well agreement with the crystallite size determined from the XRD and the HREM studies. The obtained grain size is smaller than the ceria's exciton Bohr diameter (∼15 nm).38 Small grain size is of major interest when considering the quantum confinement effect.
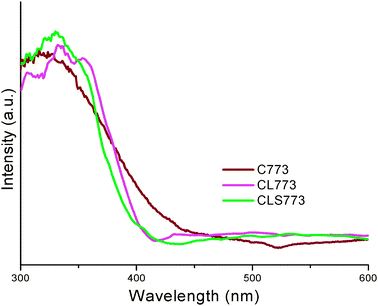 | ||
| Fig. 4 UV-vis DR spectra of ceria (C), ceria–lanthana (CL) and silica supported ceria–lanthana (CLS) solid solutions calcined at 773 K. | ||
The UV- and visible-RS of the CLS sample are displayed in Fig. 5 and 6, respectively. For comparison, we have also included C and CL samples calcined at 773 K. RS of the samples are characterized by an intense sharp Raman feature at ∼468 cm−1 and a merged broad feature ranging from ∼500 to 660 cm−1. Observation of a band at ∼468 cm−1 corresponds to the triply degenerate F2g mode and can be viewed as a symmetric breathing mode of the oxygen atoms around cerium ions (O–Ce–O) in agreement with the literature.39,40 As seen from the figure, the F2g band for CL is shifted to lower wavenumber (∼450 cm−1) when compared to pure ceria. Doping of heavier metal ion such as La3+ and subsequent expansion of the ceria unit cell may induce shift in the F2g band position. And, no Raman features pertaining to La2O3 were noted indicating formation of ceria–lanthana solid solutions (generally observed at ∼405 cm−1 attributed to torsional skeleton mode of hexagonal units).7 The F2g band of CLS is slightly shifted to higher wavenumbers and located in between C and CL. This gives an impression of a slight incorporation of Si4+ into the ceria lattice. The keen observation of the broad feature at ∼500 to 660 cm−1 (see inset) reveals that the band is highly asymmetric and is likely to be composed of more than one type. The ∼570 cm−1 band could be assigned to resultant extrinsic oxygen vacancies (to maintain charge neutrality) when Ce4+ ions are replaced with La3+ ions. Besides, the other band located at ∼590 cm−1 is ascribed to the intrinsic oxygen vacancies due to the presence of Ce3+ ions, which can be observed obviously in the Raman spectrum of CeO2 with UV (325 nm) excitation laser line.41 The high intensity of the broad band in all the samples may be due to the resonance enhancement of the Raman scattering cross section under UV excitation.42
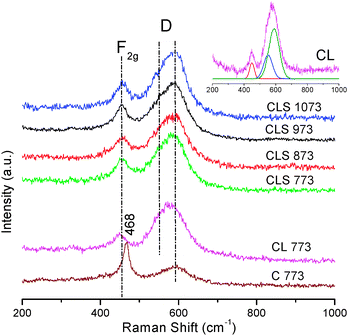 | ||
| Fig. 5 UV-Raman spectra of ceria (C 773), ceria–lanthana (CL 773) and silica supported ceria–lanthana (CLS) solid solutions calcined at various temperatures (inset: deconvoluted CL 773 sample). | ||
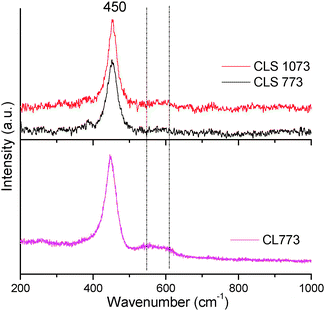 | ||
| Fig. 6 Vis-Raman spectra of ceria–lanthana (CL 773) and silica supported ceria–lanthana (CLS) calcined at various temperatures. | ||
The relative intensity (AD/AF2g) between the oxygen vacancies band (AD) and F2g mode (AF2g) for CL and CLS samples were calculated (Table 2) to estimate the oxygen vacancy concentration. These values are given with an assumption of no oxygen vacancy contribution from the silica. On the basis of these results, it is established that the vacancy concentration increases when the CL active component is deposited on the silica support. The visible-RS of CLS materials are presented in Fig. 6. For comparison, the vis-RS of the CL 773 sample is included. Similar to UV-RS, here also both CL and CLS samples exhibited a characteristic prominent peak at ∼450 cm−1. However, due to variation in the sampling depth of the excitation laser sources, the band at 570–620 cm−1 for visible-RS is insignificant when compared to the same in the UV-RS. This indicates that a major amount of oxygen vacancies are located near the surface region compared to the bulk. Interestingly, CLS has shown a low intense band compared to the CL sample. The deficiency of La in the bulk (a decrease in the Ce/La surface atomic ratio from XPS is noted for CLS) could be the reason for this observation. Silica did not exhibit any Raman features either in the UV-RS or in visible-RS in line with the results reported in the literature.43 The absence of any other Raman features infer that silica has not formed any compound with cerium and lanthanum oxides.
XPS analysis is generally used to obtain the information related to oxidation state and relative surface atomic ratios of various samples. Fig. 7 represents the Ce 3d core level spectra of various samples. It is apparent from the figure that Ce 3d spectra are complex and are made up of many individual overlapping peaks. The Ce 3d spectra pertaining to pure ceria are analyzed by following the labels previously used by Burroughs et al.44,45 The CL and CLS samples show very similar spectral profiles with that of pure CeO2. The peaks labelled ‘v’ correspond to Ce 3d5/2 contributions and those of labelled ‘u’ represent the Ce 3d3/2 contributions. In brief, the features v, v′′, v′′′ and u, u′′, u′′′ correspond to cerium in a 4+ oxidation state, while the features v0, v′ and u0, u′ correspond to cerium in 3+ oxidation state. The u′′′ peak is the most convenient feature to identify the progress of Ce reduction, since it does not overlap with any other peaks. It can be concluded from the figure that both CL and CLS samples have surface cerium species in both 4+ and 3+ oxidation states, with Ce4+ species being predominant. A closer look at the figure reveals that as ceria is doped with La3+, and with the addition of silica support, a progressive reduction in the intensity of the peaks u′′′/v′′′ and an increase in the intensity of peaks u′/v′ are noted. This remarkable observation indicates that there is an increase in the surface content of Ce3+ ions.46,47 The surface atomic ratio of Ce and La in the CL and CLS samples obtained by using the sensitivity factors is presented in Table 2. The trend observed in the table provides valuable information on the nature of the surface-active sites, which is vital for explaining their resultant catalytic activities. It is found that the Ce/La content is lower for the CL sample than the nominal composition (4![[thin space (1/6-em)]](https://www.rsc.org/images/entities/char_2009.gif) :
:![[thin space (1/6-em)]](https://www.rsc.org/images/entities/char_2009.gif) 1), and still decreased with the addition of silica support, which suggested that the distribution of La is inhomogeneous in the samples. Table 2 also lists the Iu′′′/ITotal intensity ratio which could be used for the evaluation of Ce3+ ions.
1), and still decreased with the addition of silica support, which suggested that the distribution of La is inhomogeneous in the samples. Table 2 also lists the Iu′′′/ITotal intensity ratio which could be used for the evaluation of Ce3+ ions.
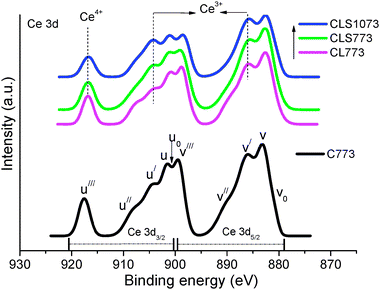 | ||
| Fig. 7 Ce 3d XPS of ceria (C 773), ceria–lanthana (CL 773) and silica supported ceria–lanthana (CLS) solid solutions calcined at different temperatures. | ||
Direct assessment of the acid–base properties (in terms of both amount and strength distribution) has been carried out by means of TPD measurements using ammonia and carbon dioxide as probe molecules. The NH3–TPD profiles of CL and CLS solid solutions are depicted in Fig. 8. As shown in the figure, both CL and CLS exhibit three desorption maxima at around 423, 673 and 973 K temperatures. These desorption peaks are supposed to correspond to Lewis acid sites. The peak at 423 K represents the weak acidic sites and the peak at 673 K corresponds to NH3 released from medium acidic sites present on the catalyst surface. And, the peak at 973 K signifies strong acidic sites. It is clear from the figure that the acidic sites of CLS are more in number compared to CL. In fact, there are higher number of weak acid sites (the relative peak area ratio for CLS and CL is 3.25![[thin space (1/6-em)]](https://www.rsc.org/images/entities/char_2009.gif) :
:![[thin space (1/6-em)]](https://www.rsc.org/images/entities/char_2009.gif) 0.49).
0.49).
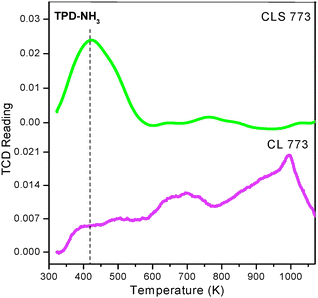 | ||
| Fig. 8 NH3–TPD of ceria–lanthana (CL) and silica supported ceria–lanthana (CLS) solid solutions calcined at 773 K. | ||
Fig. 9 represents the CO2–TPD profiles of the CL and CLS samples calcined at 773 K. Similar to NH3–TPD, in the CO2–TPD also, three peaks could be observed at 396, 723 and 996 K, respectively, related to weak, medium and strong basic sites. Here also, the amount of CO2 desorbed for CLS is higher compared to CL, particularly consisting of more number of medium strength basic sites. Importantly, the amount of CO2 desorbed is more compared to the amount of NH3 desorbed for both CL and CLS solid solutions. Among CL and CLS samples, CL has shown almost equal distribution of acid and base sites, where as the CLS sample has more number of weak acid sites and medium strength base sites. On the whole, well balanced acid–base sites (high amount of both weak acidic sites and medium strength basic sites) are generated when ceria–lanthana is dispersed over the silica support.
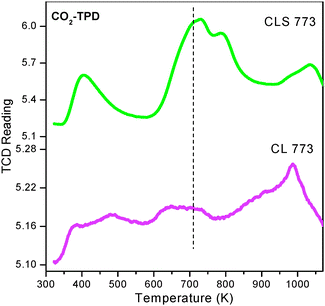 | ||
| Fig. 9 CO2–TPD of ceria–lanthana (CL) and silica supported ceria–lanthana (CLS) solid solutions calcined at 773 K. | ||
3.2 Activity studies
Fig. 10(A and B) illustrates the results of dehydration of 4-methylpentan-2-ol as a function of time at different reaction temperatures over CL and CLS samples, respectively. It is evident from the figure that the conversion of alcohol at initial reaction temperatures is very low and increases with increasing reaction temperature for both the catalysts. Upon dispersing ceria–lanthana over silica, the conversion of alcohol is remarkably increased in comparison to the CL sample. As the reaction time increases further, the conversion decreased which could be due to the deactivation of the catalysts. Interestingly, the selectivity towards 1-alkene (E1, desired product) is robustly increased with increasing reaction temperature, and the increase is reasonably higher for the CLS compared to the CL sample. In contrast, a higher amount of ketone (K) was obtained at low reaction temperatures and decreased with increasing temperature. And, only a small percentage of 2-alkene (E2) was noted at all reaction conditions. The negligible amount of ketone and 2-alkene formation suggests that the dehydration of alcohol proceeds through an E1cB mechanism.
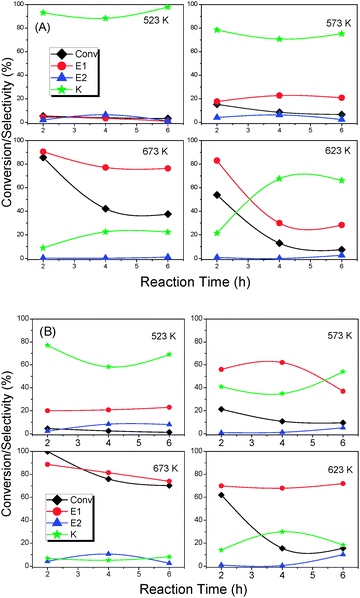 | ||
| Fig. 10 Dehydration of 4-mentylpentan-2-ol over (A) ceria–lanthana (CL 773) and (B) silica supported ceria–lanthana (CLS 773) solid solutions at 673, 623, 573 and 523 K reaction temperatures. Reaction conditions: catalyst loading 500 mg; reaction time 2–8 h; feed rate 1.5 mL h−1. | ||
Two conditions are essential for the E1cB mechanism to take place: (i) the reactant alcohol must be attacked by a two-point mechanism on an acid–base pair of the catalyst surface (an acid centre interacts with the OH group while most acidic hydrogen (i.e. terminal methyl group) of alcohol interacts with the base site, see Scheme 1a), and (ii) the presence of strong basic and weak acidic sites to assure correct timing in the bond breaking phenomenon (Scheme 1b).28
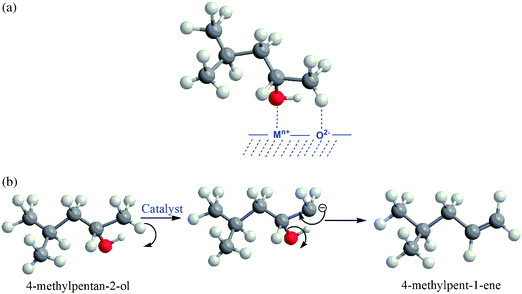 | ||
| Scheme 1 (a) Adsorption of 4-methylpentan-2-ol over catalyst surface. (b) Proposed mechanism for 4-methylpent-1-ene production. | ||
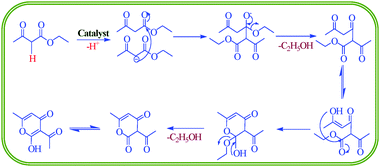 | ||
| Scheme 2 Proposed mechanism for dehydroacetic acid production. | ||
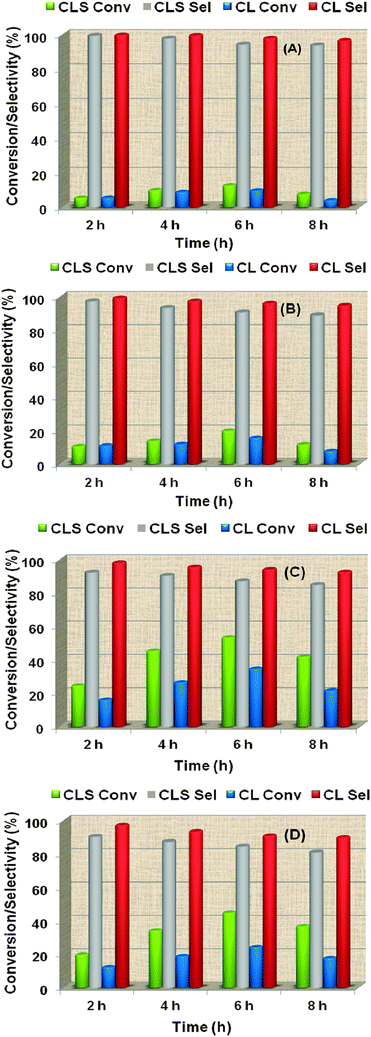 | ||
| Fig. 11 Self-condensation of ethyl acetoacetate over ceria–lanthana (CL 773) and silica supported ceria–lanthana (CLS 773) solid solutions at 573 (A), 623 (B), 673 (C) and 723 K (D) reaction temperatures. Reaction conditions: catalyst loading 500 mg; reaction time 2–8 h; feed rate 1.5 mL h−1. | ||
![[thin space (1/6-em)]](https://www.rsc.org/images/entities/char_2009.gif) :
:![[thin space (1/6-em)]](https://www.rsc.org/images/entities/char_2009.gif) NA, ratio between medium strength base sites and weak acid sites in total amount of respective sites) over different catalysts were calculated and are presented in Table 2. The ratio is found to be high for the CLS (70
NA, ratio between medium strength base sites and weak acid sites in total amount of respective sites) over different catalysts were calculated and are presented in Table 2. The ratio is found to be high for the CLS (70![[thin space (1/6-em)]](https://www.rsc.org/images/entities/char_2009.gif) :
:![[thin space (1/6-em)]](https://www.rsc.org/images/entities/char_2009.gif) 87) compared to the CL (14
87) compared to the CL (14![[thin space (1/6-em)]](https://www.rsc.org/images/entities/char_2009.gif) :
:![[thin space (1/6-em)]](https://www.rsc.org/images/entities/char_2009.gif) 19) sample. Therefore, the E1cB requirement is successfully fulfilled for the former. Furthermore, the total basic strength is higher for the CLS compared to the CL sample and hence the initiation of the reaction, i.e., formation of carbanion for the production of DHA is faster for the CLS than that of CL. Therefore, the superior performance of CLS (yields of 4-methylpent-1-ene and DHA are 88 and 47%, respectively) over that of CL (77 and 33%) can partly be attributed to their high AD/AF2g intensity ratio, enrichment of La3+ and Ce3+ ions, and the prominent NB
19) sample. Therefore, the E1cB requirement is successfully fulfilled for the former. Furthermore, the total basic strength is higher for the CLS compared to the CL sample and hence the initiation of the reaction, i.e., formation of carbanion for the production of DHA is faster for the CLS than that of CL. Therefore, the superior performance of CLS (yields of 4-methylpent-1-ene and DHA are 88 and 47%, respectively) over that of CL (77 and 33%) can partly be attributed to their high AD/AF2g intensity ratio, enrichment of La3+ and Ce3+ ions, and the prominent NB![[thin space (1/6-em)]](https://www.rsc.org/images/entities/char_2009.gif) :
:![[thin space (1/6-em)]](https://www.rsc.org/images/entities/char_2009.gif) NA ratio. The high dispersion of Ce–La-oxide over SiO2 could also be the reason for the above promising activity. High dispersion of active oxide facilitates the alcohol to interact with more balanced acid–base surface sites.
NA ratio. The high dispersion of Ce–La-oxide over SiO2 could also be the reason for the above promising activity. High dispersion of active oxide facilitates the alcohol to interact with more balanced acid–base surface sites.
4. Conclusions
Thermally stable, high surface area and nanostructured silica supported ceria–lanthana solid solution has been synthesized by a soft chemical route by adopting the deposition coprecipitation method. The following conclusions can be drawn from the present study:1. The XRD measurements revealed the formation of solid solutions. There is no indication of compound formation between silica and cerium, and lanthanum oxides.
2. TEM–HREM results indicate a well-dispersed nanosized ceria–lanthana (∼6–7 nm) over the surface of amorphous silica. No significant increase in the grain size is noted with increasing calcination temperature. This clearly discloses the significance of the support and the preparation method adopted.
3. Ce 3d core level spectra indicate the presence of cerium in both 4+ and 3+ oxidation states. With silica support, an increase in the Ce3+ surface content is observed.
4. The silica support showed an affirmative affect on both acidic and basic properties of ceria–lanthana, in terms of amount as well as strength of the sites.
5. The CLS catalyst showed better conversion of 4-methylpentan-2-ol and EAA as well as selectivity towards 4-methylpent-1-ene and DHA, respectively. Therefore, fine-tuning of the acid–base features of the catalyst surface is proved to be essential in governing the products.
Acknowledgements
L.K., P.S. and B.M. thank the Council of Scientific and Industrial Research (CSIR), New Delhi, for research fellowships.Notes and references
- J. Hierso, O. Sel, A. Ringuede, C. L. Robert, L. Bianchi, D. Grosso and C. Sanchez, Chem. Mater., 2009, 21, 2184 CrossRef CAS.
- J. B. Park, J. Graciani, J. Evans, D. Stacchiola, S. D. Senanayake, L. Barrio, P. Liu, J. Sanz, J. Hrbek and J. Rodriguez, J. Am. Chem. Soc., 2010, 132, 356 CrossRef CAS.
- T. J. Toops, A. B. Walters and M. A. Vannice, Appl. Catal., B, 2002, 38, 183 CrossRef CAS.
- G. A. M. Hussein, J. Phys. Chem., 1994, 98, 9657 CrossRef CAS.
- S. Setua, D. Menon, A. Asok, S. Nair and M. Koyakutty, Biomaterials, 2010, 31, 714 CrossRef CAS.
- D. Andriamasinoro, R. Kieffer, A. Kiennlmann and P. Piix, Appl. Catal., 1993, 106, 201 CAS.
- B. M. Reddy, L. Katta and G. Thrimurthulu, Chem. Mater., 2010, 22, 467 CrossRef CAS.
- S. Damyanova, B. Pawelec, K. Arishtirova, M. V. M. Huerta and J. L. G. Fierro, Appl. Catal., A, 2008, 337, 86 CrossRef CAS.
- E. Rocchini, M. Vicario, J. Llorca, C. de Leitenburg, G. Dolcetti and A. Trovarelli, J. Catal., 2002, 211, 407 CAS.
- X.-D. Zhoua and W. Huebner, Appl. Phys. Lett., 2001, 79, 3512 CrossRef.
- G. Zhou, J. Hanson and R. J. Gorte, Appl. Catal., A, 2008, 335, 153 CrossRef CAS.
- L. Vivier and D. Duprez, ChemSusChem, 2010, 3, 654 CrossRef CAS.
- J. Beckers and G. Rothenberg, Green Chem., 2010, 12, 939 RSC.
- T. Taniguchi, K. Katsumata, S. Omata, K. Okada and N. Matsushita, Cryst. Growth Des., 2011, 11, 3754 CAS.
- M. C. Kung and H. H. Kung, Catal. Rev.: Sci. Eng., 1985, 27, 425 Search PubMed.
- K. Tanabe, M. Misono, Y. Ono and H. Hattori, New Solid Acid and Bases, Kodansha, Tokyo, and Elsevier, Amsterdam, 1989 Search PubMed.
- J. M. Winterbottom, Catalysis, Specialist Periodical Reports, The Royal Society of Chemistry, London, 1981, vol. 4 Search PubMed.
- M. G. Cutrufello, I. Ferino, V. Solinas, A. Primavera, A. Trovarelli, A. Aurouxc and C. Picciauc, Phys. Chem. Chem. Phys., 1999, 1, 3369 RSC.
- B. M. Reddy, G. Thrimurthulu, L. Katta, Y. Yamada and S.-E. Park, J. Phys. Chem. C, 2009, 113, 15882 CAS.
- B. M. Reddy, P. Saikia, P. Bharali, Y. Yamada, T. Kobayashi, M. Muhler and W. Grünert, J. Phys. Chem. C, 2008, 112, 16393 CAS.
- L. Katta, P. Sudarsanam, G. Thrimurthulu and B. M. Reddy, Appl. Catal., B, 2010, 101, 101 CrossRef CAS.
- S. Sato, K. Koizumi and F. Nozaki, Appl. Catal., A, 1995, 133, L7 CrossRef CAS.
- S. Sato, K. Koizumi and F. Nozaki, J. Catal., 1998, 178, 264 CrossRef CAS.
- P. Kaszner and M. Baerns, Appl. Catal., A, 1996, 139, 107 CrossRef.
- L. Katta, G. Thrimurthulu, B. M. Reddy, M. Muhler and W. Grünert, Catal. Sci. Technol., 2011, 1, 1645 CAS.
- L. Katta, B. M. Reddy, M. Muhler and W. Grünert, Catal. Sci. Technol. 10.1039/c2cy00449f.
- T. Yamamoto, T. Matsuyama, T. Tanaka, T. Funabiki and S. Yoshida, Phys. Chem. Chem. Phys., 1999, 1, 2841 RSC.
- M. G. Cutrufello, I. Ferino, R. Monaci, E. Rombi, G. Colon and J. A. Navio, Phys. Chem. Chem. Phys., 2001, 3, 2928 RSC.
- A. Auroux, O. P. Artizzu, I. Ferino, R. Monad, E. Rombi, V. Solinas and G. Petrini, J. Chem. Soc., Faraday Trans., 1996, 92, 2619 RSC.
- E. Mikami, T. Goto, T. Ohno, H. Matsumoto and M. Nishida, J. Pharm. Biomed. Anal., 2002, 28, 261 CrossRef CAS.
- L. C. Dias, A. J. Demuner, V. M. M. Valente, L. C. A. Barbosa, F. T. Martins, A. C. Doreguetto and J. Ellena, J. Agric. Food Chem., 2009, 57, 1399 CrossRef CAS.
- V. Y. Sosnovskikh, B. I. Usachev, A. G. Blinov and M. I. Kodess, Mendeleev Commun., 2001, 1, 1 Search PubMed.
- O. Prakash, A. Kumar, A. Sadana, R. Prakash, S. P. Singh, R. M. Claramunt, D. Sanz, I. Alkortac and J. Elguero, Tetrahedron, 2005, 61, 6642 CrossRef CAS.
- F. Diwischek, M. Arnone, B. Engels and U. Holzgrabe, Tetrahedron, 2005, 61, 6993 CrossRef CAS.
- B. M. Reddy, G. M. Kumar, I. Ganesh and A. Khan, J. Mol. Catal. A: Chem., 2006, 247, 80 CrossRef CAS.
- B. G. Mishra and G. R. Rao, J. Mol. Catal. A: Chem., 2006, 243, 204 CrossRef CAS.
- S. Tsunekawa, R. Sahara, Y. Kawazoe and A. Kasuya, Mater. Trans., JIM, 2000, 41, 1104 CAS.
- Q.-C. Zhang, Z.-H. Yu, G. Li, Q.-M. Ye and J.-H. Lin, J. Alloys Compd., 2009, 477, 81 CrossRef CAS.
- B. M. Reddy, P. Bharali, P. Saikia, A. Khan, S. Loridant, M. Muhler and W. Grünert, J. Phys. Chem. C, 2007, 111, 1878 CAS.
- M. Yashima, H. Arashi, M. Kakihana and M. Yoshimura, J. Am. Ceram. Soc., 1994, 77, 1067 CrossRef CAS.
- Z. Wu, M. Li, J. Howe, H. M. Meyer III and S. H. Overbury, Langmuir, 2010, 26, 16595 CrossRef CAS.
- M. Fujii, S. Hayashi and K. Yamamoto, Appl. Phys. Lett., 1990, 57, 2692 CrossRef CAS.
- W. H. Weber, K. C. Hass and J. R. McBride, Phys. Rev. B: Condens. Matter, 1993, 48, 178 CrossRef CAS.
- A. Burroughs, A. Hamnett, A. F. Orchard and G. Thornton, J. Chem. Soc., Dalton Trans., 1976, 1686 RSC.
- M. Guo, J. Lu, Y. Wu, Y. Wang and M. Luo, Langmuir, 2011, 27, 3872 CrossRef CAS.
- J. S. Albero, F. R. Reinoso and A. S. Escribano, J. Catal., 2002, 210, 127 CrossRef.
- M. Daturi, C. Binet, J. Lavalley, A. Galtayries and R. Sporken, Phys. Chem. Chem. Phys., 1999, 1, 5717 RSC.
- M. G. Cutrufello, I. Ferino, R. Monaci, E. Rombi and V. Solinas, Top. Catal., 2002, 19, 225 CrossRef CAS.
- V. Solinas, E. Rombi, I. Ferino, M. G. Cutrufello, G. Colon and J. A. Navio, J. Mol. Catal. A: Chem., 2003, 204–205, 629 CrossRef CAS.
- B. M. Reddy, P. Lakshmanan, P. Bharali and P. Saikia, J. Mol. Catal. A: Chem., 2006, 258, 355 CrossRef CAS.
- A. Trovarelli, M. Boaro, E. Rocchini, C. de Leitenburg and G. Dolcetti, J. Alloys Compd., 2001, 323–324, 584 CrossRef CAS.
- D. Martin and D. Duprez, J. Phys. Chem., 1996, 100, 9429 CrossRef CAS.
Footnote |
| † Electronic supplementary information (ESI) available. See DOI: 10.1039/c2cy00551d |
| This journal is © The Royal Society of Chemistry 2012 |
