A DRIFTS study of CO adsorption and hydrogenation on Cu-based core–shell nanoparticles
Nachal D.
Subramanian
a,
Challa S. S. R.
Kumar
b,
Kazuo
Watanabe
c,
Peter
Fischer
d,
Ryo
Tanaka
c and
James J.
Spivey
*a
aCain Department of Chemical Engineering and Center for Atomic Level Catalyst Design, Louisiana State University, Baton Rouge, LA 70803, USA. E-mail: jjspivey@lsu.edu; Tel: +1(225)578-3690
bCenter for Advanced Microstructures and Devices and Center for Atomic Level Catalyst Design, Louisiana State University, Baton Rouge, LA 70806, USA
cDepartment of Chemistry, Tokyo University of Science, Tokyo 162-0826, Japan
dCenter for X-Ray Optics, Lawrence Berkeley National Laboratory, Berkeley, CA 94720, USA
First published on 5th January 2012
Abstract
Core–shell nanoparticles are being considered for various applications due to their controllable atomic structure and improved properties compared to their bulk counterparts. In the present work, we have synthesized Cu@Mn3O4 and Cu@Co3O4 (core@shell) nanocatalysts using wet-chemical synthesis methods involving organic surfactants, and probed their surfaces using CO and H2 under reaction conditions using diffuse reflectance infrared Fourier transform spectroscopy (DRIFTS). The surfactant ligands used in the synthesis of the nanoparticles must be removed to allow access to the active catalyst sites. These ligands can be removed by oxidation, allowing adsorption of CO and H2. This work reports the DRIFTS results of CO adsorption and hydrogenation on Cu@Mn3O4 and Cu@Co3O4 nanoparticles after removing the ligands. The CO hydrogenation results were in agreement with the DRIFTS results, which suggested that the Cu@Co3O4 nanoparticles adsorb CO both dissociatively and associatively, creating a balance between molecular CO required for CO insertion and dissociated surface carbon species required for chain growth. This resulted in higher selectivities towards C2+ alcohols on this catalyst. On the other hand, the Cu@Mn3O4 nanoparticles showed a higher CO uptake and a lower CO dissociation activity, which resulted in a lower CHx concentration on the surface, thus limiting the rate of the CO insertion step required to form higher alcohols.
1. Introduction
CO hydrogenation to higher alcohols has been extensively studied over a variety of catalysts,1–3 with Rh-based catalysts being the most active and selective. But the high cost and limited availability of Rh have changed the focus to base metal catalysts such as modified Cu-based catalysts.2,4 Although copper-based catalysts are active and selective for methanol synthesis, addition of suitable promoters can significantly enhance the formation of higher alcohols.5–7 Since copper can assist in non-dissociative adsorption of CO, a promoter that would dissociate portion of the adsorbed CO, thereby forming CHx surface species, is required for the higher alcohol formation.4 Cobalt and manganese would be expected to possess such properties—cobalt dissociates CO and hydrogenates the resulting surface carbon species into hydrocarbons, e.g., in F–T synthesis,8 and manganese can promote the adsorption and dissociation of CO,9–11 accelerate the hydrogenation steps12 and create new active sites for the CO insertion reaction.13 Hence Cu–Co and Cu–Mn catalysts are potential candidates for CO hydrogenation to higher alcohols.The interaction of catalyst and promoter appears to be a crucial property in determining the activity and selectivity to higher alcohols. The catalysts that have been studied for CO hydrogenation are typically synthesized using conventional impregnation or coprecipitation methods. However, achieving desired metal-promoter morphologies and atomic-level control over the structure of the catalysts is limited with these techniques. The achievement of such atomic-level control may lead to further improvement in the selectivity to desired products. Atomically controlled nanoparticles are receiving considerable attention due to their interesting properties and potential applications as catalysts that are not found in their respective bulk counterparts.4,14–16 Bimetallic core–shell nanoparticles are also very interesting since they provide excellent control over surface properties through modulation of shell and core dimensions. Their electronic structure and catalytic properties are substantially modified due to the interactions between the shell and the core atoms.17
Wet chemical synthesis methods are being widely used for the controlled synthesis of such nanoparticles. Surfactants play a vital role in controlling the particle size and shape of nanoparticles synthesized using wet-chemical methods.4,18 There are numerous reports that demonstrate surfactant-assisted synthesis of nanoparticles with controlled sizes and shapes.4,14,18–25 However, the surfactants used during the synthesis may be retained on the surfaces, blocking the active adsorption sites required for catalysis and thus may also lead to loss of catalytic activity.26–29 The excess surfactants can sometimes be removed by repeated washing, but if not, their decomposition at elevated reaction temperatures may lead to particle agglomeration and/or formation of an amorphous or nanocrystalline shell of carbon around the particles, thus making them catalytically inactive.28 Hence, the excess surfactants bonded to the nanoparticles must be removed from their surfaces in order for them to be suitable as effective catalysts.26–27
Time resolved (in situ) characterization techniques are critical in understanding the structural and chemical changes of a catalyst under reaction conditions and to develop structure–activity relationships. Infrared spectroscopy is a frequently used technique to characterize the catalysts and to study the nature of adsorbed molecules and reaction intermediates.30 Among the various IR techniques, diffuse reflectance infrared Fourier transform spectroscopy (DRIFTS) or in situ FTIR is a useful surface-sensitive technique to study the adsorption behavior of catalysts under reaction conditions and to elucidate the nature of the active sites and the surface intermediates involved in the reaction.31
CO and H2 are common probe molecules used to study the catalyst surface for CO adsorption and hydrogenation.31–41 It is very important to study the catalyst surface under reaction conditions. DRIFTS, equipped with an online mass spectrometer for continuous monitoring of the product stream, permits monitoring of the surface species during steady state or transient reaction conditions.
In the present work, we have used wet-chemical synthesis routes to synthesize Cu core–Mn oxide shell (denoted as Cu@Mn3O4) and Cu core–Co oxide shell (denoted as Cu@Co3O4) nanoparticles using oleic acid and trioctylphosphine surfactants. A thorough investigation of the synthesis and characterization of Cu@Mn3O4 nanoparticles is provided elsewhere.42 Here we provide the evidence for the lack of CO adsorption on the nanoparticle catalysts in the presence of organic ligands and report the DRIFTS results of CO adsorption and CO hydrogenation on the ligand-free nanocatalysts. The CO adsorption properties of Cu@Mn3O4vs. Cu@Co3O4 nanoparticles, and CO hydrogenation are reported here. We have also attempted to use soft X-ray microscopy, a promising analytical tool that would add element specificity, high spatial resolution and tomographic capabilities, to study the chemical and structural composition of these nanoparticles.
2. Experimental
2.1. Synthesis of Cu@X (X = Mn3O4 or Co3O4) bimetallic nanoparticles
Detailed information on the synthesis procedure for Cu@Mn3O4 nanoparticles is reported in our previous paper.42 A similar procedure was adopted for Cu@Co3O4. In short, all the syntheses were carried out under inert atmospheric conditions using commercially available reagents. First, a mixture of copper acetylacetonate salt (12 mmol), diphenyl ether (120 ml) and hexadecanediol (24 mmol) was taken in a three-necked flask and stirred using a magnetic stirrer. The contents were heated to 105 °C and held for 5–10 minutes before adding oleic acid (24 mmol) and trioctylphosphine (24 mmol) surfactants. This mixture was then heated to 200 °C and held for 20 minutes, after which manganese or cobalt acetylacetonate salt (4 mmol) was added along with lithium triethylborohydride (LiEt3BH) and held at 200 °C for another 20 minutes. The resulting nanoparticles were then washed thoroughly with degassed methanol followed by ethanol and dried to obtain a fine powder.These nanoparticles are designated as Cu@Mn3O4 and Cu@Co3O4 in this paper, since they were found to have a core containing copper and a porous shell containing manganese oxide (in the form of Mn3O4) or cobalt oxide (in the form of Co3O4), as will be discussed in the Results section.
2.2. Characterization
The nanoparticles were characterized by transmission electron microscopy (TEM), full field transmission soft X-ray microscopy (TXM), Ultraviolet-Visible spectroscopy (UV-Vis), X-ray absorption near edge structure (XANES) and ex situ Fourier transform infrared spectroscopy (ex situ FTIR) to study their structural and chemical properties. TEM experiments were carried out using a Hitachi H-9500 (acceleration voltage 200 kV). Samples for TEM were prepared under inert atmospheric conditions by dispersing the bimetallic nanoparticles in toluene and then placing a drop of the solution on carbon-coated copper or molybdenum grids. High spatial resolution imaging down to 25 nm with soft X-rays providing element specific information was performed at the full-field soft X-ray microscope XM-1 which is located at beamline 6.1.2 at the Advanced Light Source (ALS) in Berkeley, CA.43 UV-Visible spectroscopy measurements were performed using a Varian Cary 5000 spectrophotometer. A halogen incandescent lamp was used to study the optical properties in the wavelength range of 400–1000 nm using a 1 cm path length quartz cuvette at room temperature. Dilute solutions of toluene-dispersed nanoparticles were used as samples for these experiments.XANES K-edge experiments were performed at the Double Crystal Monochromator beamline of the J. Bennett Johnston, Sr., Center for Advanced Microstructures and Devices, Louisiana State University, using Ge (220) crystals. Powder samples placed between two kapton tapes were used for XANES measurements. Ex situ FTIR spectra were obtained using a Thermo Nicolet 6700 spectrometer equipped with a MCT detector. A diamond crystal attenuated total reflectance (ATR) accessory was used for these measurements. A small amount of the powder sample was placed on the diamond crystal and IR spectra were collected at 4 cm−1 resolution and 32 scans.
2.3. In situ FTIR (DRIFTS)
A Thermo Nicolet 6700 FTIR spectrometer equipped with a MCT detector and a Harrick Praying Mantis cell was employed for the diffuse reflectance infrared Fourier transform spectroscopy (DRIFTS) studies. The cell contains a temperature controlled reaction chamber, which is thermally isolated from the outer wall by a water-cooled jacket. The powdered sample was placed into the sample cup and prior to exposure to the reaction gas, the sample was heated under flowing He (30 scc min−1) to 400 °C and treated with 10% O2/He (50 scc min−1) at 400 °C for 10 h to remove the surfactant ligands. The catalyst was then reduced in situ in 10% H2/He (50 scc min−1) at 400 °C for 2 h, followed by He flushing and then cooled down to room temperature in He. Background spectra were collected at different temperatures. Then the reactant gas (or gas mixture) was fed to the cell and the infrared spectra were taken at 4 cm−1 resolution with 32 scans. 5% CO/He and 10% H2/He gas mixtures were used. CO adsorption and CO hydrogenation DRIFTS experiments were carried out at different temperatures and pressures as described in the respective sections. A Hiden HPR-20 QIC Benchtop Gas Analysis System equipped with a quadrupole mass spectrometer was connected to the DRIFTS reactor to be able to monitor the reaction products online as they were exiting from the reactor.2.4. CO hydrogenation
CO hydrogenation was performed in a fixed bed microreactor. The catalyst (0.2 g) was loaded between quartz wool and axially centered in the reactor tube, with the temperature monitored by a thermocouple. Prior to reaction, the catalyst was reduced at 400 °C in H2 flow for 2 h at atmospheric pressure. Then, the gas flow was switched to a 2![[thin space (1/6-em)]](https://www.rsc.org/images/entities/char_2009.gif) :
:![[thin space (1/6-em)]](https://www.rsc.org/images/entities/char_2009.gif) 1 H2/CO mixture at 270 °C and 10 bar. The products were analyzed for both oxygenates and hydrocarbons in an Agilent GC 6890 equipped with MSD and TCD. Product selectivities are reported in terms of carbon efficiencies defined as,
1 H2/CO mixture at 270 °C and 10 bar. The products were analyzed for both oxygenates and hydrocarbons in an Agilent GC 6890 equipped with MSD and TCD. Product selectivities are reported in terms of carbon efficiencies defined as,where ni is the number of carbon atoms and Ci is the molar concentration of the carbon-containing products. Calibration of the GC/MS was carried out using standard gas mixtures containing certified concentrations of each product gas.
3. Results and discussion
3.1. Structural characterization of as-prepared core–shell nanoparticles
Fig. 1 and 2 show the HRTEM images and particle size distributions of the as-prepared (ligand-capped) Cu@Mn3O4 and Cu@Co3O4 nanoparticles. The nanoparticles are spherical in nature with distinguishable contrast between inner and outer regions suggesting core–shell structures. The particles are uniformly dispersed and show a narrow size distribution with a size of 13 ± 0.35 nm (for Cu@Mn3O4) and 11.4 ± 0.73 nm (for Cu@Co3O4). The Cu core size is ∼6.1 nm and the shell is ∼3.45 nm thick in the case of Cu@Mn3O4 nanoparticles, while the Cu@Co3O4 nanoparticles have a core of ∼5 nm and a shell ∼3.2 nm thick.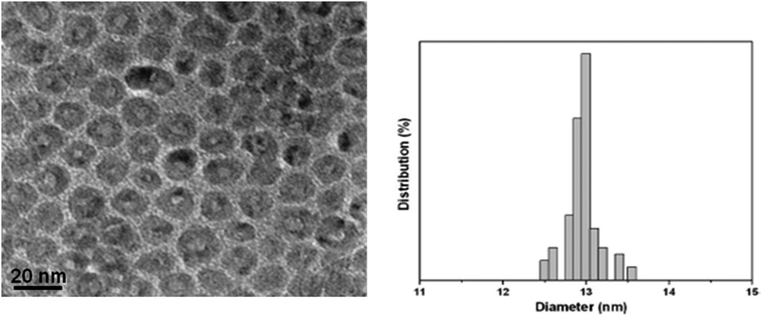 | ||
| Fig. 1 HRTEM image and particle size distribution of the as-prepared Cu@Mn3O4 nanoparticles. Mean size: 13 nm with a standard deviation of 0.35 nm. | ||
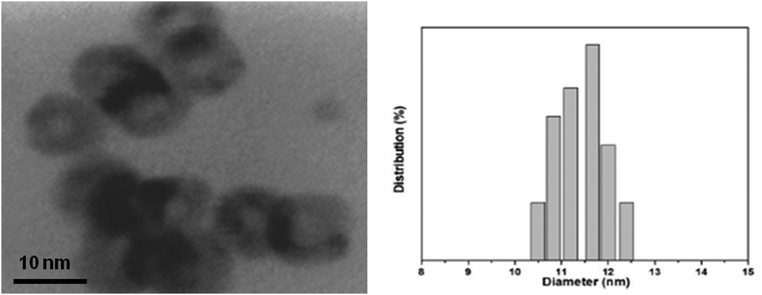 | ||
| Fig. 2 HRTEM image and particle size distribution of the as-prepared Cu@Co3O4 nanoparticles. Mean size: 11.4 nm with a standard deviation of 0.73 nm. | ||
In order to determine how the elements forming the core and shell are spatially distributed within the ligand-capped nanoparticles, the powdered samples were analyzed using transmission soft X-ray microscopy (TXM) at the Advanced Light Source (ALS) in Berkeley, CA.43,44 In TXM, the spatial resolution is obtained through Fresnel zone plate optical elements, and recently a 15 nm spatial resolution has been reported.45 The standard resolution, which was also achieved in this experiment, is currently ∼25 nm. One of the unique features of TXM is elemental specificity, which originates from the strong resonance enhancement of the interaction of soft X-rays with the material, when the photon energy matches the binding energy of inner core electronic levels, the so called X-ray absorption edges such as K or L edges. As a test case, we took Cu@Co3O4 nanoparticles and attempted to resolve the structural features using TXM. The samples were deposited on a regular TEM grid. The X-ray images of Cu@Co3O4 nanoparticles recorded at the Cu L3 (933 eV) and Co L3 (778 eV) absorption edges in the vicinity of the TEM grid structure showed different contrasts. However, the apparent non-uniform distribution of Co/Cu and the limited spatial resolution of 25 nm did not allow unambiguous resolution of the core–shell structures.
Fig. 3 shows the photographs and UV-vis absorption spectra of Cu@Mn3O4, Cu@Co3O4 and pure Cu nanoparticles dispersed in toluene. The change in color after the formation of the shell indicates the influence of shell material on the surface plasmon resonance of Cu. The complete dispersion of these nanoparticles in nonpolar solvents also suggests that the surface of the particles is bound to nonpolar surfactants—oleic acid (OA) and trioctylphosphine (TOP), which were used during the synthesis. The core–shell nanoparticles display a broad absorption feature at longer wavelengths, compared to monometallic Cu nanoparticles. This study shows that the formation of a shell around a Cu core can dampen the surface plasmon resonance of the Cu core and result in a red-shifted absorption peak as reported by Guo et al. in the case of Ag–Ni core–shell nanoparticles.46 The red-shift in the case of core–shell nanoparticles indicates a change in dielectric function due to the presence of the oxide shell.
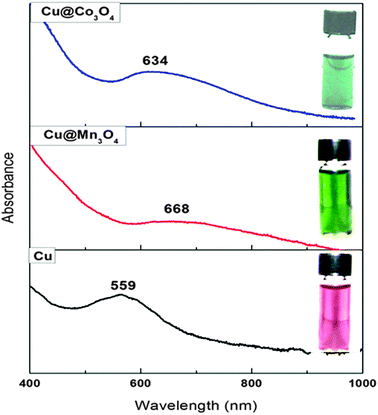 | ||
| Fig. 3 Photographs and UV-vis absorption spectra of Cu (dark red), Cu@Mn3O4 (green) and Cu@Co3O4 (blue) nanoparticles dispersed in toluene. | ||
Guo et al. suggested that the damping and red-shifted SPR bands were evidence for the formation of a core–shell structure.46 Hence the differences in color and UV-vis absorption features suggest an interaction between the core and shell atoms that can induce changes in the electronic properties of the bimetallic nanoparticles. This change may bring about physical or chemical properties that are absent in the individual components.46
The oxidation states of the core and shell components were studied using XANES analysis. The derivative spectra of the normalized Cu K-edge and Mn or Co K-edge XANES for the Cu@Mn3O4 and Cu@Co3O4 nanoparticles are shown in Fig. 4 and 5. The absorption edge of the Cu K-edge in both cases (8979 eV) is consistent with that of a standard fcc copper foil. Despite the close resemblance of the features to those of Cu foil, the air sensitivity of the nanoparticles could lead to minor contributions from Cu2O.
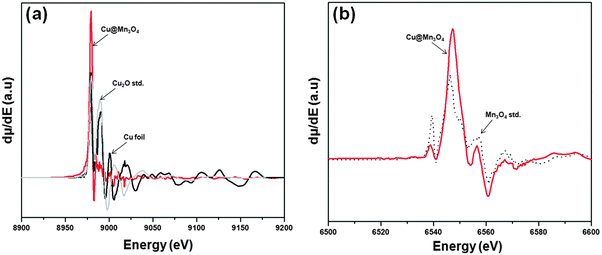 | ||
| Fig. 4 First derivatives of the normalized XANES spectra for (a) Cu K-edge and (b) Mn K-edge of the Cu@Mn3O4 nanoparticles. | ||
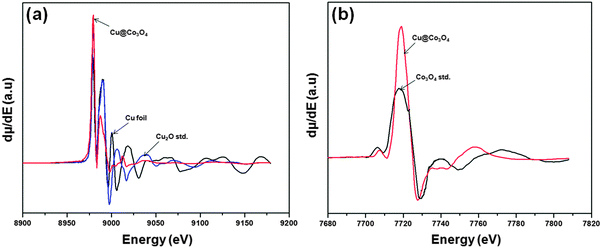 | ||
| Fig. 5 First derivatives of the normalized XANES spectra for (a) Cu K-edge and (b) Co K-edge of the Cu@Co3O4 nanoparticles. | ||
The absorption edge (6547 eV) and line shape of the Mn K-edge spectrum in Cu@Mn3O4 nanoparticles (Fig. 4b) compare favorably with that of the Mn3O4 standard. In the case of Cu@Co3O4 nanoparticles, the absorption edge of the Co K-edge spectrum is observed at 7718 eV (Fig. 5b) and the pre-edge and post-edge features of the spectrum match that of the Co3O4 standard. However, as we reported in our previous paper,42 the small differences in the spectral features of all the edges can be attributed to the unique behavior of nanoparticles as opposed to bulk metal standards and also to the interactions between core and shell atoms at the interface. These results suggest that the core is metallic copper and the shell comprises of Mn3O4 and Co3O4 in Cu@Mn3O4 and Cu@Co3O4 nanoparticles, respectively.
3.2. Removal of surfactant ligands from as-prepared core–shell nanoparticles
Fig. 6 shows the ex situ FTIR spectra of the as-prepared (ligand-capped) Cu@Mn3O4 and Cu@Co3O4 nanoparticles which confirm the presence of certain bands that are characteristic of the COO− group of oleic acid (1400–1540 cm−1), C–P stretching modes of TOP (1000–1170 cm−1), and CH2 vibrations (2850–3000 cm−1) due to both surfactants that were used during the synthesis. The various band assignments are provided in our previous paper.42 Thus the ex situ FTIR spectra indicate that organic ligands from the surfactants are bound to the nanoparticle surface, preventing further agglomeration of the particles.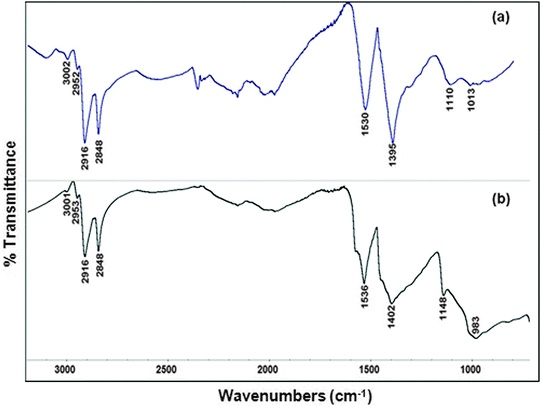 | ||
| Fig. 6 Ex situ FTIR spectra of the as-prepared nanoparticles in the 700–3200 cm−1 region: (a) Cu@Mn3O4 and (b) Cu@Co3O4 nanoparticles. | ||
In situ CO adsorption experiments on such ligand-capped nanoparticles by DRIFTS do not show any bands attributable to chemisorbed CO which indicates that CO does not adsorb on these materials. This is because all the adsorption sites are blocked by the surfactant ligands. Hence the as-prepared (ligand-capped) core–shell nanoparticles are catalytically inactive and the organic ligands must be removed before using them as catalysts. This was achieved by treating the nanoparticles at 400 °C in 10% O2/He while monitoring mass 44 (for CO2) in an online mass spectrometer. The oxidation treatment was continued until the CO2 levels came down to the baseline value, which took about 10 h.
Fig. 7 shows the ex situ FTIR spectra of the Cu@Mn3O4 and Cu@Co3O4 nanoparticles after treating them with 10% O2/He at 400 °C for 10 h. The major bands characteristic of the surfactants, which were observed on the as-prepared nanoparticles (Fig. 6), are either absent or insignificant in the case of oxygen-treated nanoparticles (Fig. 7). The band at 1629 cm−1 for Cu@Mn3O4 nanoparticles (1632 cm−1 for Cu@Co3O4), accompanied with a broad band in the range 3000–3500 cm−1 (not shown), can be attributed to the stretching and bending vibrations of adsorbed water which is a major product of oxidation. The absence of bands due to the surfactants in the IR spectra indicates their removal (at least partially) in the O2-treated nanoparticles.
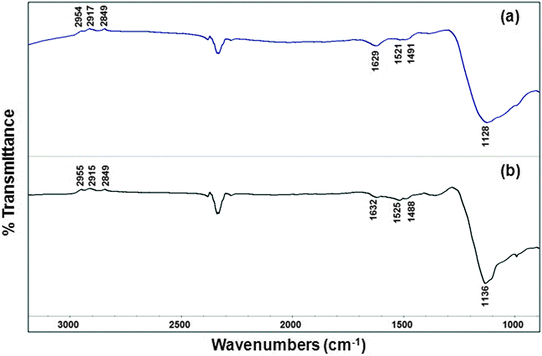 | ||
| Fig. 7 Ex situ FTIR spectra of the O2-treated (ligand-free) nanoparticles: (a) Cu@Mn3O4 and (b) Cu@Co3O4 nanoparticles. | ||
The morphology and size of the particles after oxidation was studied by HRTEM. Fig. 8 shows the HRTEM images of the O2-treated (ligand-free) Cu@Mn3O4 and Cu@Co3O4 nanoparticles. The nanoparticles after high temperature oxidation show a polyhedron-like morphology. It should be noted that their outer region shows well-ordered layer structures. The core–shell structures are retained after high temperature oxidation, but the particles are slightly agglomerated, indicating the removal of surfactants. Exact size determination is not possible since the particles overlap in the HRTEM images.
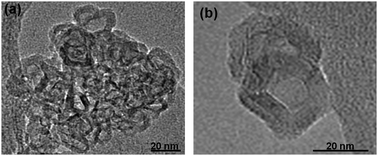 | ||
| Fig. 8 HRTEM images of the nanoparticles after removing the surfactant ligands by oxidation at 400 °C for 10 h. (a) Cu@Mn3O4 and (b) Cu@Co3O4. | ||
Due to the high temperature oxidation treatment, a diffusion/migration of copper ions from the core to the surface of the nanoparticles would be expected based on the Kirkendall effect.47–50 The surface ratio of Cu![[thin space (1/6-em)]](https://www.rsc.org/images/entities/char_2009.gif) :
:![[thin space (1/6-em)]](https://www.rsc.org/images/entities/char_2009.gif) Co derived from X-ray photoelectron spectroscopy (XPS, Table 1) increased 5 times after the high temperature treatment in the case of Cu@Co3O4 nanoparticles indicating a migration of copper to the near surface. But the ratio was not significantly affected in the case of Cu@Mn3O4 nanoparticles, suggesting very little diffusion of copper into the shell. However, the surface Cu/Co ratios after the treatment are much less compared to the respective bulk ratios (derived from ICP) for both catalysts, which indicate that the cores are not hollow.
Co derived from X-ray photoelectron spectroscopy (XPS, Table 1) increased 5 times after the high temperature treatment in the case of Cu@Co3O4 nanoparticles indicating a migration of copper to the near surface. But the ratio was not significantly affected in the case of Cu@Mn3O4 nanoparticles, suggesting very little diffusion of copper into the shell. However, the surface Cu/Co ratios after the treatment are much less compared to the respective bulk ratios (derived from ICP) for both catalysts, which indicate that the cores are not hollow.
| Catalyst | Cu/X surface atomic ratio | |
|---|---|---|
| As-prepared | Ligand-removed | |
| Cu@Mn3O4 | 2.1 | 2.2 |
| Cu@Co3O4 | 1.7 | 8.7 |
3.3. DRIFTS studies on ligand-free nanoparticles at 1 bar
(i) CO adsorption at 25 °C followed by He flushing at 25 °C, 1 bar. As described in the Experimental section, the O2-treated ligand-free nanoparticles were reduced in situ at 400 °C in 10% H2/He for 2 h before the DRIFTS experiment. 5% CO/He was adsorbed on the reduced catalyst surface at 25 °C for 10 min, followed by He flushing to remove the physisorbed CO.
Fig. 9 shows the DRIFTS spectra of CO adsorption on the reduced ligand-free Cu@Mn3O4 nanoparticles at 25 °C followed by He flushing. After 2 min of contact with CO, the major peaks observed in the IR spectra are in the carbonyl stretching region (2000–2200 cm−1) that can be attributed to various forms of adsorbed CO. The doublet bands attributed to gaseous CO could be removed by flushing with He for about 10 min. Linearly adsorbed CO species become visible after He flushing. The band at 2136 cm−1 with shoulders on either side (2126 cm−1, 2148 cm−1 and 2174 cm−1) is due to the linearly chemisorbed carbonyl species. The principal band at 2120–2136 cm−1 is assigned to Cu+–CO species by many authors.33,34,51 However, when the copper is highly dispersed, Cu0–CO species can also adsorb at the same frequency as Cu+–CO carbonyl in which case these two surface species can be distinguished by their stability: the Cu0–CO species are easily removed during flushing or evacuation.51 In the case of Cu@Mn3O4 catalyst, the 2136 cm−1 band was highly resistant to He flushing and hence can be assigned to Cu+–CO carbonyl species. The high stability and intensity of the band suggests that these Cu+–CO species are predominant on the surface, although minor contributions from metallic copper carbonyls to the band cannot be excluded. Although the catalyst was reduced before the DRIFTS experiment, the results provide the evidence for the presence of Cu+ sites, which can be due to the interaction of the Cu atoms with either CO in the feed, thereby keeping the surface Cu atoms in a partially oxidized state,52 or with the hydroxyl groups present on the surface after hydrogen reduction. Another plausible explanation could be that the reduction at 400 °C for 2 h before the DRIFTS experiment may not have been sufficient to reduce the catalyst entirely to its metallic state.
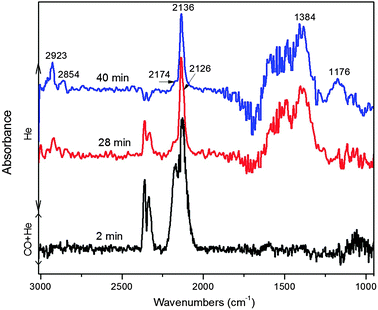 | ||
| Fig. 9 DRIFTS spectra of CO adsorption on the ligand-free Cu@Mn3O4 nanoparticles at 25 °C and 1 bar followed by He flushing. | ||
The 2126 cm−1 band in Fig. 9 can be due to another kind of Cu+–CO species since it is also found to be stable with He flushing. If so, there may be two kinds of Cu+ sites present on the surface. However, some reports suggest that the typical band positions of Cu+–(CO)2 dicarbonyl species are characterized by the symmetric (νs) and antisymmetric (νas) vibrational modes at 2160 and 2115 cm−1 respectively.39 With regard to this, the bands observed at 2126 and 2174 cm−1 in our case (Fig. 9) can also be assigned to these dicarbonyl species, if a component of the band at 2174 cm−1 can be assigned to the symmetric mode of Cu+–(CO)2 species, the respective antisymmetric vibrations being at 2126 cm−1.
The other small band at 2148 cm−1, which decreased in intensity with He flushing and eventually disappeared, can be assigned to the CO adsorbed over highly dispersed copper sites (or small copper particles)53 or CO hydrogen-bonded to the surface hydroxyl groups present after hydrogen reduction.34 The doublet in the region 2320–2380 cm−1, which corresponds to gaseous CO2, varies randomly throughout the experiment. Although the sample compartment is sealed from the atmosphere, the instrument is extremely sensitive to even very small changes in CO2 in the lab atmosphere due to which the CO2 bands were not taken into account and no conclusions were drawn from them. A CO2 impurity in the CO gas cylinder could also lead to variations in CO2 bands, despite the use of ultra-high purity CO.
The spectra after 2 min of CO adsorption did not have any significant IR bands below 1700 cm−1, whereas the spectra after He flushing for 20 min and higher revealed some IR bands in the low frequency region that may be due to various surface bound carbonates or carboxylates.54 The absence of these bands in the initial 2 min spectrum indicates that they originated from the desorbed CO as a result of He flushing. The bands at 2923, 2955 and 2854 cm−1 can be assigned to the C–H stretching vibrations of the saturated alkyl groups.55,56 Although no hydrogen was admitted in this experiment, these species can be produced by an interaction of CO with already present residual hydroxyl groups or residual hydrogen that is leftover after the reduction step.54 The bands in the region 1300–1650 cm−1 found in the 28 min and 40 min spectra can be attributed to the vibrations of surface bound carbonate species or carboxylate species of the formate or acetate type, and/or to the CH3Oad and C2H5Oad species, as reported elsewhere.55–57 These bands in conjunction with the C–H stretching region could indicate the presence of adsorbed oxygenated compounds on the catalyst surface. The band at 1176 cm−1 can be due to some hydrogen-carbonate species that is also formed upon interaction of desorbed CO with the residual hydrogen.54 This may indicate that more CO desorbed with He flushing over time which then reacts with the leftover hydrogen or OH groups to form these new species.
(ii) Coadsorption of CO and H2 at 1 bar. In this experiment, a mixture of 5% CO/He and 10% H2/He was co-adsorbed on the reduced Cu@Mn3O4 nanoparticles for 10 min at 25 °C, followed by flushing with H2/He (at 25 °C, 100 °C and 270 °C). Simultaneous adsorption of CO and H2 did not affect the positions of the CO stretching bands, but flushing with H2 after CO + H2 adsorption resulted in a faster desorption/reaction of the adsorbed CO species, as evidenced by a significant decrease in their intensity, compared to flushing with He alone. [The IR spectra are not shown since they are similar to CO adsorption spectra as in Fig. 9, except that H2 flushing resulted in a faster desorption of the chemisorbed CO.] The carboxylate species (<1700 cm−1), which are considered to be the intermediates for alcohol/oxygenate products,54 and bands in the C–H stretching region (2830–2950 cm−1) decreased in intensity with H2 flushing over time, indicating their reaction with either H2 or desorbed CO. Thus, coadsorption of H2 with CO decreases the coverage for the adsorbed CO as a result of reaction with adsorbed hydrogen.
However these DRIFTS results alone cannot be used to conclusively identify the products formed. Reactor studies under similar conditions are necessary to support these findings.
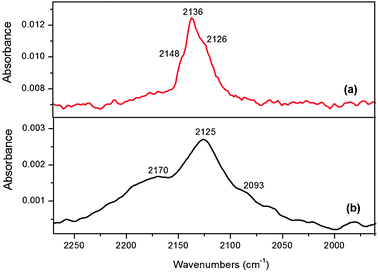 | ||
| Fig. 10 DRIFTS spectra after CO adsorption followed by 20 min of He flushing at 25 °C and 1 bar over ligand-free nanoparticles. (a) Cu@Mn3O4 and (b) Cu@Co3O4 (note the y-axis scale). | ||
As seen in Fig. 10, the CO stretching region for both the nanoparticles shows a major peak with shoulders on either side, but at higher wavenumbers in the case of Cu@Mn3O4 nanoparticles, where all the bands have blue-shifted. The blue-shift with Mn promoter on Cu catalysts was also observed by Xu et al.,41,58 who attributed the blue-shift to lowering of the Lewis basicity (or electron density) of the surface Cu metal atoms by the presence of Mn2+, consequently increasing the strength of the C–O bond, leading to higher vibrational frequencies. Higher frequencies represent the weakening of the Cu–CO bond and strengthening of the C–O bond which may be expected to enhance the molecular adsorption of CO during CO hydrogenation,59 because the stronger the C–O bond, the less likely it is to be dissociated. The weakening of the Cu–CO bond by Mn is due to the electron withdrawing effect of Mn which results in an increased population of Cu+ species on the catalyst surface. Due to the decrease in electron density, Cu atoms tend to remain in an oxidized state, which makes their reduction difficult. Therefore, the reduction of copper is inhibited by the addition of Mn, as evidenced by the TPR profile of the O2-treated Cu@Mn3O4 nanoparticles (not shown). Hence two major observations can be made: first, CO chemisorption increases (more intense linear CO band) because Mn provides more sites for CO adsorption, and second, CO dissociation is less on the Mn-containing catalyst, so that the adsorbed CO desorbs as molecular CO. The latter point is consistent with the effect of Mn on CuMnZrO2, as previously reported, where Mn oxide weakened the Cu–CO bond.41
On the other hand, lower wavenumbers in the case of Cu@Co3O4 nanoparticles suggest that the C–O bond is relatively weaker (or Cu–CO bond is stronger) than on the Cu@Mn3O4 nanoparticles. The presence of both Cu+ and Cu0 sites may suggest that CO adsorbs in both associative and dissociative forms on Cu@Co3O4 nanoparticles. The stronger the adsorption of CO on metal the more likely it is to be dissociated, suggesting that CO is less likely to dissociate on the Mn-containing nanoparticles.
3.4. DRIFTS experiments at 10 bar: hydrogenation of pre-adsorbed CO
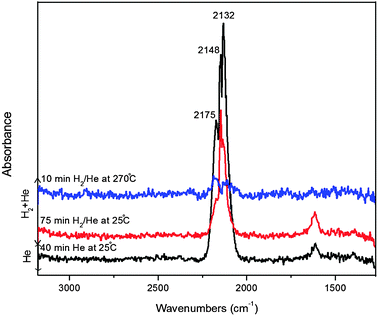 | ||
| Fig. 11 DRIFTS spectra recorded during CO adsorption at 25 °C and 10 bar followed by He flushing at 25 °C and then flushing with H2/He at 25 °C and 270 °C for the ligand-free Cu@Mn3O4 nanoparticles. | ||
Admission of H2 to the reactor at 25 °C over the pre-adsorbed CO did not affect the positions of any of the bands, but decreased their intensities which suggests that the adsorbed CO undergoes reaction with hydrogen. As the temperature was increased to 270 °C under hydrogen flow, the linear CO bands disappeared and the CO stretching region is now characterized by a doublet band attributable to physisorbed (gaseous) CO and new bands appeared at 2916 and 2948 cm−1, corresponding to C–H vibrations. These observations indicate the reaction between desorbed linear CO and H2 thereby resulting in the formation of hydrocarbon intermediate species.
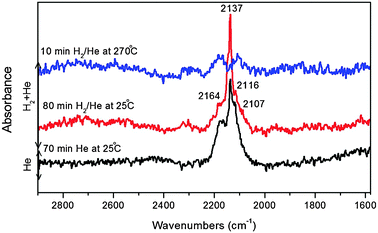 | ||
| Fig. 12 DRIFTS spectra recorded during CO adsorption at 25 °C and 10 bar followed by He flushing at 25 °C and then flushing with H2/He at 25 °C and 270 °C for the ligand-free Cu@Co3O4 nanoparticles. | ||
The highly stable band at 2137 cm−1 in Fig. 12 can be assigned to linearly adsorbed CO on Cu+ sites as seen in the previous sections. The two bands at 2116 and 2164 cm−1 can again be attributed to antisymmetric and symmetric modes of the Cu+–(CO)2 dicarbonyl species. The band at 2116 cm−1 can also be due to CO adsorbed on Co+ ions or CO complexes with partially-reduced cations.60 The higher frequency bands in the range 2160–2180 cm−1 can be assigned to CO linearly adsorbed on oxidized Co species (Co2+ or Co3+).60
Upon hydrogenation at 25 °C after He flushing, the band positions were not affected significantly similar to the case of Cu@Mn3O4 and all the bands except that at 2137 cm−1 decreased in intensity with H2, but the intensity of the linear CO band at 2137 cm−1 increased with hydrogen flow at 25 °C. A careful inspection of the spectra and the literature indicates that it is possible for the Cu+–(CO)2 dicarbonyl species to decompose into monocarbonyl species, thereby resulting in an intense linear CO band.61 Thus, the rise in intensity of the 2137 cm−1 band during hydrogenation could be a result of decomposition of the dicarbonyls to linear Cu+–CO complexes. As the temperature was raised to 270 °C in hydrogen flow, the linear CO band became very weak due to the presence of gaseous CO, indicating the possible reaction between desorbed linear CO and H2.
3.5. DRIFTS experiments coupled with mass spectrometry
The products of DRIFTS CO hydrogenation experiments carried out at 270 °C on the Cu@Mn3O4 and Cu@Co3O4 nanoparticles were analyzed by an online mass spectrometer. Fig. 13 shows the mole fractions of masses 31 and 15 observed at 1 bar and 10 bar (both at 270 °C), which can be attributed to the formation of alcohols and methane respectively.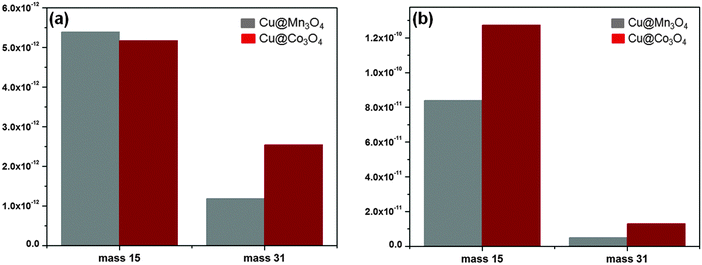 | ||
| Fig. 13 Masses 31 and 15 monitored on a mass spectrometer during CO hydrogenation DRIFTS experiment at 270 °C: (a) 1 bar and (b) 10 bar (note that the y-axis scales are different). | ||
There are no significant differences in mass 15 at 1 bar. Increasing the pressure to 10 bar increases the yields of all products, indicating an increase in overall CO conversion (note the different y-axis scales in Fig. 13). At both the pressures, mass 31 is higher in the case of Cu@Co3O4 nanoparticles, suggesting that they produce more alcohols than the Cu@Mn3O4 nanoparticles.
3.6. CO hydrogenation results
Table 2 summarizes the product selectivities of the two nanoparticle catalysts tested at 10 bar, 270 °C, H2/CO = 2, space velocity (S.V.) = 18![[thin space (1/6-em)]](https://www.rsc.org/images/entities/char_2009.gif) 000 scc (h gcat)−1 and differential conversions. These conditions were chosen for the reactor studies to allow for a direct comparison with the DRIFTS/MS results.
000 scc (h gcat)−1 and differential conversions. These conditions were chosen for the reactor studies to allow for a direct comparison with the DRIFTS/MS results.
| Products | Selectivityb (C%) | |
|---|---|---|
| Cu@Mn3O4 | Cu@Co3O4 | |
a Catalyst: 0.2 g; reaction conditions: P = 10 bar, 270 °C, H2/CO = 2, space velocity = 18![[thin space (1/6-em)]](https://www.rsc.org/images/entities/char_2009.gif) 000 scc (h gcat)−1.
b Product selectivities are reported in terms of carbon efficiencies defined as carbon efficiency = niCi/∑(niCi), where ni is the number of carbon atoms and Ci is the molar concentration of the carbon-containing products.
c Acetaldehyde, propanol, butanol and acetone.
d Ethane, propane, propylene, butane and hexane. 000 scc (h gcat)−1.
b Product selectivities are reported in terms of carbon efficiencies defined as carbon efficiency = niCi/∑(niCi), where ni is the number of carbon atoms and Ci is the molar concentration of the carbon-containing products.
c Acetaldehyde, propanol, butanol and acetone.
d Ethane, propane, propylene, butane and hexane.
|
||
| CO2 | 59.6 | 42.2 |
| MeOH | 16.0 | 26.6 |
| EtOH | 7.8 | 15.1 |
| C2+ Oxyc | 4.9 | 5.3 |
| CH4 | 9.8 | 10.6 |
| C2+ HCd | 1.8 | 0.3 |
The high selectivities towards CO2 formation can be attributed to the presence of copper which enhances the water gas shift reaction. It is evident that the Cu@Co3O4 nanoparticles produce more alcohols/oxygenates and methane compared to the Cu@Mn3O4 nanoparticles, consistent with the DRIFTS/MS results at 10 bar (Fig. 13b). The highest ethanol selectivity achieved at this condition is 15% on the Cu@Co3O4 nanoparticles with relatively low methane selectivity (10.6%), and the total selectivity towards alcohols and oxygenates is 47%.
These results are consistent with the DRIFTS results which suggested a higher CO uptake in an associative form and a lower CO dissociation activity on the Cu@Mn3O4 nanoparticles. This might result in a lower concentration of CHx species on the surface, thus limiting the rate of the CO insertion step required to form higher alcohols. On the other hand, the DRIFTS results suggest that the Cu@Co3O4 nanoparticles adsorb CO in both forms (dissociative and associative), thereby creating a balance between molecular CO required for CO insertion and dissociated surface carbon species required for chain growth. This may likely be the reason for higher selectivities towards alcohols on this catalyst. Lower methane selectivity and higher alcohol selectivity may be attributed to the enhanced stability of the CHx species on the surface towards hydrogenation, followed by CO insertion into the metal–carbon (M–C) bond of the surface CHx species and hydrogenation to produce alcohols.
4. Summary and conclusions
Cu core–Mn oxide shell (Cu@Mn3O4) and Cu core–Co oxide shell (Cu@Co3O4) nanoparticles were synthesized using surfactant-assisted wet chemical synthesis methods, characterized and their CO adsorption properties were studied using DRIFTS. The removal of surfactant ligands from the nanoparticle surfaces was found to be necessary for CO adsorption during DRIFTS experiments. CO adsorbed in both linear and dicarbonyl forms on the ligand-free nanoparticles, and the desorbed CO as a result of He flushing over time led to the formation of surface bound carboxylate species, probably by reacting with the residual hydroxyl groups present after hydrogen reduction.The CO uptake was very high and the linearly adsorbed CO band was highly stable to He flushing on the Cu@Mn3O4 nanoparticles, indicating the presence of only Cu+ active sites, whereas the partially stable linear carbonyl species on the Cu@Co3O4 nanoparticles indicated the possible presence of both Cu0 and Cu+ sites. The effect of pressure on CO adsorption and hydrogenation was also studied using DRIFTS. Increase in the total pressure resulted in an increase in the intensity of the linear CO and an upward shift of its wavenumber. The linear CO uptake at 10 bar was roughly about 8 times greater than that at 1 bar. Hydrogenation of the pre-adsorbed CO at 270 °C indicated the disappearance of strongly pre-adsorbed linear CO in both Cu@Mn3O4 and Cu@Co3O4 nanoparticles, indicating the reaction of linear CO with H2.
CO hydrogenation studies at 10 bar and 270 °C showed a highest ethanol selectivity of 15% on the Cu@Co3O4 nanoparticles with relatively low methane selectivity (10%), and a total alcohols/oxygenates selectivity of 47%. The CO hydrogenation results are in agreement with the DRIFTS results which indicated a lower CO dissociation activity on the Cu@Mn3O4 nanoparticles, and the presence of both dissociative and associative forms of CO adsorption on the Cu@Co3O4 nanoparticles; the latter may be the likely reason for higher selectivities towards alcohols/oxygenates on this catalyst.
Acknowledgements
This material is based upon work supported as part of the Center for Atomic Level Catalyst Design, an Energy Frontier Research Center funded by the U.S. Department of Energy, Office of Science, Office of Basic Energy Sciences under Award Number DE-SC0001058. The soft X-ray microscope at the ALS is supported by the Director, Office of Science, Office of Basic Energy Sciences, Materials Sciences and Engineering Division, of the U.S. Department of Energy under Contract No. DE-AC02-05-CH11231.References
- J. J. Spivey and A. Egbebi, Chem. Soc. Rev., 2007, 36(9), 1514–1528 RSC.
- V. Subramani and S. K. Gangwal, Energy Fuels, 2008, 22(2), 814–839 CrossRef CAS.
- P. Chaumette, P. Courty, A. Kiennemann, R. Kieffer, S. Boujana, G. A. Martin, J. A. Dalmon, P. Meriaudeau, C. Mirodatos, B. Holhein, D. Mausbeck, A. J. Hubert, A. Germain and A. Noels, Ind. Eng. Chem. Res., 1994, 33(6), 1460–1467 CrossRef CAS.
- N. D. Subramanian, G. Balaji, C. Kumar and J. J. Spivey, Catal. Today, 2009, 147(2), 100–106 CrossRef CAS.
- S. C. Chuang, J. G. Goodwin and I. Wender, J. Catal., 1985, 95(2), 435–446 CrossRef CAS.
- Y. H. Du, D. A. Chen and K. R. Tsai, Appl. Catal., 1987, 35(1), 77–92 CrossRef CAS.
- J. R. Katzer, A. W. Sleight, P. Gajardo, J. B. Michel, E. F. Gleason and S. McMillan, Faraday Discuss. Chem. Soc., 1981, 72, 121–133 RSC.
- N. Mouaddib, V. Perrichon and G. A. Martin, Appl. Catal., A, 1994, 118(1), 63–72 CrossRef CAS.
- M. Ichikawa and T. Fukushima, J. Phys. Chem., 1985, 89(9), 1564–1567 CrossRef CAS.
- W. M. H. Sachtler, D. F. Shriver, W. B. Hollenberg and A. F. Lang, J. Catal., 1985, 92(2), 429–431 CrossRef CAS.
- Y. Wang, H. Y. Luo, D. B. Liang and X. H. Bao, J. Catal., 2000, 196(1), 46–55 CrossRef CAS.
- F. G. A. Vandenberg, J. H. E. Glezer and W. M. H. Sachtler, J. Catal., 1985, 93(2), 340–352 CrossRef CAS.
- H. Trevino, T. Hyeon and W. M. H. Sachtler, J. Catal., 1997, 170(2), 236–243 CrossRef CAS.
- Y. Mizukoshi, T. Fujimoto, Y. Nagata, R. Oshima and Y. Maeda, J. Phys. Chem. B, 2000, 104(25), 6028–6032 CrossRef CAS.
- X. L. Pan, Z. L. Fan, W. Chen, Y. J. Ding, H. Y. Luo and X. H. Bao, Nat. Mater., 2007, 6(7), 507–511 CrossRef CAS.
- A. J. Zarur and J. Y. Ying, Nature, 2000, 403(6765), 65–67 CrossRef CAS.
- S. Alayoglu, A. U. Nilekar, M. Mavrikakis and B. Eichhorn, Nat. Mater., 2008, 7(4), 333–338 CrossRef CAS.
- R. M. de Silva, V. Palshin, K. M. N. de Silva, L. L. Henry and C. Kumar, J. Mater. Chem., 2008, 18(7), 738–747 RSC.
- J. Ahmed, K. V. Ramanujachary, S. E. Lofland, A. Furiato, G. Gupta, S. M. Shivaprasad and A. K. Ganguli, Colloids Surf., A, 2008, 331(3), 206–212 CrossRef CAS.
- Z. H. Guo, C. Kumar, L. L. Henry, E. E. Doomes, J. Hormes and E. J. Podlaha, J. Electrochem. Soc., 2005, 152(1), D1–D5 CrossRef CAS.
- S. W. Han, Y. Kim and K. Kim, J. Colloid Interface Sci., 1998, 208(1), 272–278 CrossRef CAS.
- D. Mott, J. Galkowski, L. Y. Wang, J. Luo and C. J. Zhong, Langmuir, 2007, 23(10), 5740–5745 CrossRef CAS.
- N. Shukla, C. Liu, P. M. Jones and D. Weller, J. Magn. Magn. Mater., 2003, 266, 178–184 CrossRef CAS.
- Y. J. Song, E. E. Doomes, J. Prindle, R. Tittsworth, J. Hormes and C. Kumar, J. Phys. Chem. B, 2005, 109(19), 9330–9338 CrossRef CAS.
- Y. J. Song, H. Modrow, L. L. Henry, C. K. Saw, E. E. Doomes, V. Palshin, J. Hormes and C. Kumar, Chem. Mater., 2006, 18(12), 2817–2827 CrossRef CAS.
- P. D. Burton, D. Lavenson, M. Johnson, D. Gorm, A. M. Karim, T. Conant, A. K. Datye, B. A. Hernandez-Sanchez and T. J. Boyle, Top. Catal., 2008, 49(3–4), 227–232 CrossRef CAS.
- K. R. Gopidas, J. K. Whitesell and M. A. Fox, Nano Lett., 2003, 3(12), 1757–1760 CrossRef CAS.
- B. Stahl, J. Ellrich, R. Theissmann, M. Ghafari, S. Bhattacharya, H. Hahn, N. S. Gajbhiye, D. Kramer, R. N. Viswanath, J. Weissmuller and H. Gleiter, Phys. Rev. B, 2003, 67(1), 014422 CrossRef.
- C. J. Zhong and M. M. Maye, Adv. Mater., 2001, 13(19), 1507–1511 CrossRef CAS.
- N. Y. Topsoe, Catal. Today, 2006, 113(1–2), 58–64 CrossRef CAS.
- J. W. Niemantsverdriet, Spectroscopy in Catalysis, VCH Verlag, Weinheim, 1993 Search PubMed.
- T. Beutel, O. S. Alekseev, Y. A. Ryndin, V. A. Likholobov and H. Knozinger, J. Catal., 1997, 169(1), 132–142 CrossRef CAS.
- K. Hadjiivanov and H. Knozinger, Phys. Chem. Chem. Phys., 2001, 3(6), 1132–1137 RSC.
- K. Hadjiivanov, T. Venkov and H. Knozinger, Catal. Lett., 2001, 75(1–2), 55–59 CrossRef CAS.
- W. J. Ji, Y. Chen, S. K. Shen, S. B. Li and H. L. Wang, Appl. Surf. Sci., 1996, 99(2), 151–160 CrossRef CAS.
- M. Jiang, N. Koizumi, T. Ozaki and M. Yamada, Appl. Catal., A, 2001, 209(1–2), 59–70 CrossRef CAS.
- X. H. Mo, J. Gao and J. G. Goodwin Jr., Catal. Today, 2009, 147, 139–149 CrossRef CAS.
- F. Morales, E. de Smit, F. M. F. de Groot, T. Visser and B. M. Weckhuysen, J. Catal., 2007, 246(1), 91–99 CrossRef CAS.
- D. Scarano, S. Bordiga, C. Lamberti, G. Spoto, G. Ricchiardi, A. Zecchina and C. O. Arean, Surf. Sci., 1998, 411(3), 272–285 CrossRef CAS.
- D. Song, J. Li and Q. Cai, J. Phys. Chem. C, 2007, 111(51), 18970–18979 CAS.
- R. Xu, Z. Y. Ma, C. Yang, W. Wei, W. H. Li and Y. H. Sun, J. Mol. Catal. A: Chem., 2004, 218(2), 133–140 CrossRef CAS.
- N. D. Subramanian, J. Moreno, J. J. Spivey and C. S. S. R. Kumar, J. Phys. Chem. C, 2011, 115, 14500–14506 CAS.
- P. Fischer, Mater. Sci. Eng., R, 2011, 72(5), 81–95 CrossRef.
- D. T. Attwood, Soft X-rays and Extreme Ultraviolet Radiation: Principles and Applications, Cambridge University Press, 1999 Search PubMed.
- W. Chao, J. Kim, S. Rekawa, P. Fischer and E. H. Anderson, Opt. Express, 2009, 17(20), 17669–17677 CrossRef CAS.
- H. Z. Guo, Y. Z. Chen, X. Z. Chen, R. T. Wen, G. H. Yue and D. L. Peng, Nanotechnology, 2011, 22(19), 195604 CrossRef.
- H. J. Fan, M. Knez, R. Scholz, D. Hesse, K. Nielsch, M. Zacharias and U. Gosele, Nano Lett., 2007, 7(4), 993–997 CrossRef CAS.
- L. I. Hung, C. K. Tsung, W. Y. Huang and P. D. Yang, Adv. Mater., 2010, 22(17), 1910–1914 CAS.
- R. Nakamura, D. Tokozakura, J. G. Lee, H. Mori and H. Nakajima, Acta Mater., 2008, 56(18), 5276–5284 CrossRef CAS.
- Y. D. Yin, R. M. Rioux, C. K. Erdonmez, S. Hughes, G. A. Somorjai and A. P. Alivisatos, Science, 2004, 304(5671), 711–714 CrossRef CAS.
- A. Hornes, P. Bera, A. L. Camara, D. Gamarra, G. Munuera and A. Martinez-Arias, J. Catal., 2009, 268(2), 367–375 CrossRef CAS.
- G. J. Millar, C. H. Rochester and K. C. Waugh, Catal. Lett., 1992, 14(3–4), 289–295 CrossRef CAS.
- S. Kannan, T. Venkov, K. Hadjiivanov and H. Knozinger, Langmuir, 2004, 20(3), 730–736 CrossRef CAS.
- A. Kiennemann, H. Idriss, J. P. Hindermann, J. C. Lavalley, A. Vallet, P. Chaumette and P. Courty, Appl. Catal., 1990, 59(1), 165–184 CrossRef CAS.
- A. Egbebi, V. Schwartz, S. H. Overbury and J. Spivey, Catal. Today, 2010, 149(1–2), 91–97 CrossRef CAS.
- J. T. Li, W. D. Zhang, L. Z. Gao, P. Y. Gu, K. Q. Sha and H. L. Wan, Appl. Catal., A, 1997, 165(1–2), 411–417 CrossRef CAS.
- Z. Q. Yu and S. S. C. Chuang, J. Catal., 2007, 246(1), 118–126 CrossRef CAS.
- R. Xu, Z. Y. Ma, C. Yang, W. Wei and Y. H. Sun, React. Kinet. Catal. Lett., 2004, 81(1), 91–98 CrossRef CAS.
- C. D. Zeinalipour-Yazdi, A. L. Cooksy and A. M. Efstathiou, Surf. Sci., 2008, 602(10), 1858–1862 CrossRef CAS.
- E. L. Rodrigues and J. M. C. Bueno, Appl. Catal., A, 2004, 257(2), 201–211 CrossRef CAS.
- T. Venkov and K. Hadjiivanov, Catal. Commun., 2003, 4(4), 209–213 CrossRef CAS.
| This journal is © The Royal Society of Chemistry 2012 |

