A carbon nanoparticle-based low-background biosensing platform for sensitive and label-free fluorescent assay of DNA methylation†
Xiangyuan
Ouyang‡
,
Jinhua
Liu‡
,
Jishan
Li
* and
Ronghua
Yang
*
State Key Laboratory of Chemo/Biosensing and Chemometrics, College of Chemistry and Chemical Engineering, Hunan University, Changsha, 410082, China. E-mail: jishanli@hnu.cn; Yangrh@pku.edu.cn
First published on 7th November 2011
Abstract
Combining a DNA intercalator, SYBR Green I, and enzyme-linkage reactions with carbon nanoparticles, a low-background biosensing platform for label-free and sensitive fluorescent assay of DNA methylation is reported.
DNA methylation plays an important role in protecting genes from invasion by external genomes and epigenetic activation/deactivation of the transcription.1 This process is catalyzed by DNA methyltransferases (MTases), which transfer a methyl group from S-adenosyl-L-methionine to the target cytosine or adenine in specifically short palindromic sequences.2 However, recent studies on cancer pathology have testified that aberrant DNA methylation is a new generation of cancers and DNA MTase is a potential target in anticancer therapy.3 Therefore, sensitive, accurate and low-cost methods for assay of DNA-methylation are very important. Traditional methods employed for the assay usually require radioactive labeling, cleavage of DNA by methylation-sensitive enzymes, or separation of methylation nucleotides by HPLC.4 Then some more advanced fluorescent and colorimetric approaches were proposed for the assay of MTase activity based on fluorescent molecular beacons,5DNAzymes6 or gold nanoparticles.7 Although these approaches have made great contributions for detection of DNA methylation, they are laborious, time-consuming and even still require the design and synthesis of various sophisticated DNA oligomer probes, which is tedious and expensive. To reduce the operational cost and improve the ability of DNA methylation assay, and as a continuation of our studies on carbon nanomaterials-based sensing designs,8 we present herein the attempt to develop a new strategy based on carbon nanoparticles (CNPs), oligonucleotides and DNA intercalating dyes (SYBR Green I, SG) for sensitive and label-free fluorescent assay of DNA methylation as well as MTase's activity.
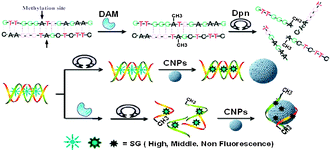
The carboxylated CNPs used in the work were prepared according to the previously reported methods,9 and were characterized with SEM, AFM and FT-IR spectroscopy (Fig. S1 and S2, ESI†). The foundation of our design (Scheme 1) is based on the following: (1) single-stranded DNA (ssDNA) can be adsorbed on the carbon nanomaterial's surface by means of the π–π stacking interactions, while double-stranded DNA (dsDNA) does not possess this feature,8a,10 (2) organic dyes can also be adsorbed on the carbon nanomaterial's surface and thus their fluorescence will be quenched,8b,10 and (3) SG shows stronger binding ability to dsDNA over ssDNA11 and the affinity of SG to dsDNA is stronger than that of SG to the carbon nanomaterials,12 thus the dsDNA facilitates the intercalation of SG, emitting strong fluorescence. After the dsDNA molecules were methylated by DNA MTase and cleaved by a methylation-sensitive restriction endonuclease, the produced ssDNA and free SG will be adsorbed onto the CNP's surface, resulting in the decrease of the system's fluorescence, and then realizing the assay of DNA methylation.
 | ||
| Scheme 1 Schematic description for label-free fluorescence assay of DNA methylation based on CNPs, SG and enzyme-linkage reactions. | ||
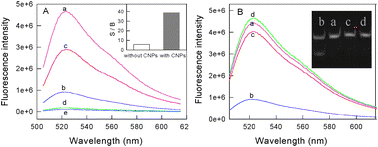
From the principle of the proposed approach, the primary fundamentality of this DNA methylation assay method is that the DNA intercalating dyes should have high ability to bind dsDNA over ssDNA. Although SG has been widely used in the simple and label-free detection of DNA hybridization, such a dye still encounters its intrinsic limitations because of the relatively high background signal which results from the non-specific binding of SG with ssDNA through electrostatic interactions. Considering the special properties of carbon nanostructures mentioned above, we think that a successful SG-based DNA methylation assay should be dependent on the introduction of carbon nanomaterials. To confirm the hypothesis, experiments with/without carbon nanomaterials were carried out under the same conditions. As shown in Fig. 1A, although the fluorescence intensity of SG for dsDNA (curve a) is higher than that for ssDNA (curve b), the ratio of the two samples' fluorescence intensity at 520 nm is only 5.8 due to the high background fluorescence of SG. In contrast, in the presence of carbon nanomaterials, the fluorescence intensity ratio of dsDNA (curve c) to ssDNA (curve d) is greatly increased, reaching 38.7, although the fluorescence intensity of SG for dsDNA is also reduced. These results indicate that the use of carbon nanomaterials can indeed improve the ability of DNA intercalating dyes in distinguishing dsDNA from ssDNA.
 | ||
| Fig. 1 Fluorescence emission spectra of the DNA samples. (A) Curves a and b are the dsDNA probe (P1 + P2) and ssDNA sample (P3 + P4 + P5 + P6) without CNPs, respectively, curves c and d are the corresponding spectra with CNPs, curve e is the spectrum of SG alone. Inset: the patterns of the ratio of signal to background (S/B) with or without CNPs obtained from the spectral detection at 524 nm. (B) Curves a and b are the dsDNA probes (P1 + P2) treated without/with Dam MTase in the presence of DpnI, respectively, curve c is the sample treated with Dam MTase alone and curve d is the random dsDNA (P7 + P8) treated with Dam MTase and Dpn I. Inset: the gel electrophoresis images of the dsDNA probes incubated for 4 h. Lanes: (a) treated with Dpn I endonucleases alone; (b) treated with Dpn I endonucleases and Dam methylase; (c) treated with Dam methylase alone; (4) dsDNA probe. | ||
The other important fundamentality of this proposed approach is that the carbon nanomaterials should have excellent ability in selectively adsorbing ssDNA, other than dsDNA, onto their surface. Although the previous reports have shown that the carbon nanomaterials (carbon nanotubes and graphene) can be successfully used in the DNA hybridization assay,8a,13 the fluorescence restoration of these systems is poor and the response kinetics is slow, which may be resulting from the strong affinity of the flat carbon nanostructures to both ssDNA and dsDNA. Here, we have also used carbon nanotubes and graphene combined with SG to measure the DNA hybridization. The results show that, in the presence of carbon nanotubes or graphene, the fluorescence of SG for dsDNA and ssDNA are all weak and the fluorescence intensity ratio of dsDNA to ssDNA is only 14.6 for carbon nanotubes and 1.2 for graphene (Fig. S3, ESI†), far lower than 38.7 obtained from the CNPs-based system, indicating that the traditional carbon nanotube or graphene is not suitable for the SG-based DNA hybridization assay. Alternately, the CNP shows an excellent ability in the SG-based DNA sequence assay. Besides the high sensitivity, one can see from Fig. S4 (ESI†) that the kinetics behavior of a CNP-based sensing platform is also very satisfactory: the formation and release of dsDNA from CNPs is very fast, reaching equilibrium in 25 min. This improved ability of CNPs in the DNA sequence assay might be explained as follows: the spherical shape of a CNP does not facilitate adsorption of dsDNA with more rigid structure onto its cambered surface and the dsDNA is expected to have repulsive interaction with the CNP because of the negative charges of the carboxyl groups on the CNP (zeta potential of CNP: −36.5 mV) and the negatively charged phosphate backbone of DNA. So CNPs were chosen in this SG-based assay.
The performance of our proposed approach is also based on the specificity of the restriction endonucleases for methylated sites. Hence, the properties of the used enzymes should be rationally explored before performing the enzyme-linkage assay. DNAadenine methylation (Dam) MTase and methylation-sensitive restriction endonuclease Dpn I, having the same recognition site of 5′-G-A-T-C-3′, were chosen as the model MTase and endonuclease in this research, respectively. Dam MTase could methylate the N6-adenine in the symmetric tetranucleotide 5′-G-A-T-C-3′.14 It has also been found that Dpn I endonuclease can only cut the sequence 5′-G-Am-T-C-3′ when the internal adenine is methylated.15 Thus, in the presence of Dam, dsDNA containing the sequence 5′-G-A-T-C-3′ can be methylated and then be cut into four pieces of ssDNA. Fig. 1B shows the fluorescence spectra of the DNA samples treated with (curve b) or without (curve a) Dam MTase in the presence of DpnI. One can see from the result that the addition of Dam MTase and DpnI induced a significant decrease in fluorescence, while no significant fluorescence change for Dam MTase or DpnI alone (curve c). Moreover, the specificity of Dam MTase for the DNA probe was also demonstrated by the almost unchanged fluorescence intensity of the random dsDNA (P7 + P8) (curve d). To further confirm the reliability of the methylation-induced cleavage, gel electrophoresis was also carried out. As shown in the inset of Fig. 1B, new bands appear in lane 1 when both Dam MTase and Dpn I are added together, suggesting that a methylation reaction has taken place and the methylated DNA are then cut into small pieces. As a comparison, it can be observed that there is only one band of the original probe in lanes 2 and 3 when the Dam MTase or DpnI is presented alone, indicating that no methylation/cleavage reaction occurs.
To get best conditions for performance of the DNA methylation assay, various variables of the measuring system should be optimized. In the present approach, if the monitoring was carried out under relatively low temperature, the produced ssDNA segments from the cleavage of dsDNA probes could hybridize to form unstable duplexes again, reducing the adsorption efficiency of DNA probes on the CNPs' surface and the SG would intercalate into the duplexes, resulting in a low level of fluorescence change. Therefore, the assay temperature should be fixed at a temperature lower than the melting temperature of dsDNA probes but higher than that of the short dsDNA newly formed from the produced ssDNA segments. Fig. S5A shows thermostabilities of the dsDNA probes and their cleaved products. The melting curves clearly reveal that the duplex formed between the produced ssDNA dissociates completely at the temperature of 35 °C, nevertheless the dsDNA probes remain in the duplex structure at this temperature. Therefore, the operation temperature was set to 35 °C in the assay procedure. The SG emission intensities will increase with the increase in SG concentration. It can be seen from Fig. S5B that the fluorescence intensity increases with the increase in SG concentration up to 61 nM. Further addition of SG to the duplexes only leads to an unclear fluorescence increase, which indicates the saturation of SG intercalation at [SG] = 61 nM. Considering both the fluorescence intensity and the signal enhancement, 61 nM of SG was selected for this study. The amounts of CNPs would also influence the sensitivity and discrimination ability of the DNA methylation assay method (Fig. S5C). At lower concentration of carbon nanoparticles, the free SG could not be adsorbed completely on the surfaces of CNPs, resulting in a high background (Fig. S5C). When excessive nanoparticles were present, they could increase the probability of dsDNA colliding with the nanoparticles and reduce the fluorescent signal of SG, resulting in the increase of detection error. 3.0 μg mL−1 of CNPs were optimized for the measuring system.
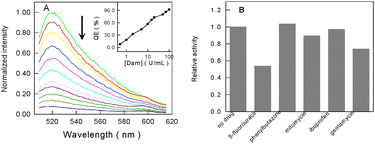
Under the optimized conditions, different concentrations of Dam MTase were analyzed using the proposed method. As shown in Fig. 2A, the fluorescence intensity gradually decreases with the increase in the concentration of Dam MTase. This is in accordance with the fact that, under higher concentrations of Dam MTase, more dsDNA probes will be cut into ssDNA fragments and then be adsorbed onto the surface of CNPs, resulting in the fluorescence quenching of SG greatly. The calibration curve (Fig. 2A, inset) shows that the linear range of this Dam MTase assay is from 0.5 to 100 U mL−1 with a detection limit of 0.1 U mL−1, comparable to previously reported results via signal amplification assays,6 suggesting that this approach could be used to detect the MTase conveniently and efficiently.
 | ||
| Fig. 2 (A) Normalized fluorescence emission spectra of the dsDNA probe with increasing concentrations of Dam MTase (from top to bottom). Inset: the quenching efficiency (QE) as a function of the amounts of Dam MTase. (B) Influence of different drugs on the activity of Dam MTase. | ||
We also explored whether our approach can be employed for high-throughput screening of Dam MTase inhibitors, such as antibiotics and anticancer drugs. Because there are two enzymes involved in this assay system, it is necessary to evaluate the influence of these drugs on Dpn I first. The control experiments indicate that all of them have no influence on the activity of Dpn I when the concentration is not more than 1.0 μM (Fig. S6, ESI†). Then the influence of these drugs (1.0 μM) on the activity of Dam MTase was investigated. As can be seen from Fig. 2B, mitomycin, gentamycin and 5-fluorouracil could strongly inhibit the methylase. The inhibition by 5-fluorouracil was the most serious one, which may decrease the activity of Dam MTase by about 46%. However, phenylbutazone and ibuprofen had almost no effect on the methylation. We also checked how the concentration of 5-fluorouracil could influence the activity of methylase. As shown in Fig. S7 (ESI†), the inhibition effect of 5-fluorouracil on Dam MTase is observed to enhance linearly with the concentration of the inhibitor. Therefore, our method can be successfully used in the assay of Dam MTase inhibitors.
In summary, we have proposed a simple and highly sensitive label-free fluorescence strategy for the detection of Dam MTase using a DNA intercalator dye coupled with an endonuclease and carbon nanomaterials. The approach takes advantage of the specific recognition of Dam MTase and methyl-sensitive endonuclease Dpn I, and the exceptional quenching ability of CNPs towards the proximate dye and the different propensities of ssDNA and dsDNA to adsorb onto CNPs. Compared with the traditional method to detect methylation, this assay forsakes the complex design and high cost in modifying probes with signaling dyes. The introduction of CNPs acting as both a “nano-quencher” of the fluorophore and a “nano-scaffold” for the oligonucleotide solves the background and sensitivity limits of the intercalating dye, resulting in the improvement of the assay ability for DNA methylation. Furthermore, this simple and sensitive assay method provides a promising platform for the high-throughput screening of Dam MTase, which might be of help in the discovery of anticancer drugs.
This work was supported by NSFC (21075032, 21005026 and 21135001), DFMEC (20100151120008), and “973” National Key Basic Research Program (2011CB911000).
Notes and references
- A. Jeltsch, ChemBioChem, 2002, 3, 274 CrossRef CAS.
- (a) X. Cheng and R. J. Roberts, Nucleic Acids Res., 2001, 29, 3784 CrossRef CAS; (b) G. Song, C. Chen, J. Ren and X. Qu, ACS Nano, 2009, 3, 1183 CrossRef CAS.
- (a) B. Brueckner and F. Lyko, Trends Pharmacol. Sci., 2004, 25, 551 CrossRef CAS; (b) P. A. Jones and S. B. Baylin, Nat. Rev. Genet., 2002, 3, 415 CrossRef CAS; (c) M. Esteller, Oncogene, 2002, 21, 5427 CrossRef CAS.
- (a) W. Messer and M. Noyer-Weidner, Cell (Cambridge, Mass.), 1988, 54, 735 CAS; (b) A. Bergerat, W. Guschlbauer and G. V. Fazakerley, Proc. Natl. Acad. Sci. U. S. A., 1991, 88, 6394 CrossRef CAS; (c) E. Boye, M. G. Marinus and A. Lobner-Olesen, J. Bacteriol., 1992, 174, 1682 CAS; (d) V. Thielking, S. D. Bois, R. Eritja and W. Guschlbauer, Biol. Chem., 1997, 378, 407 CrossRef CAS.
- (a) W. Tan, K. Wang and T. Drake, Curr. Opin. Chem. Biol., 2004, 16, 173 Search PubMed; (b) J. Li, H. Yan, K. Wang, W. Tan and X. Zhou, Anal. Chem., 2007, 79, 1050 CrossRef CAS.
- W. Li, Z. Liu, H. Lin, Z. Nie, J. Chen, X. Xu and S. Yao, Anal. Chem., 2010, 82, 1935 CrossRef CAS.
- T. Liu, J. Zhao, D. Zhang and G. Li, Anal. Chem., 2010, 82, 229 CrossRef CAS.
- (a) R. H. Yang, J. Y. Jin, Y. Chen, N. Shao, H. Z. Kang, Z. Y. Xiao, Z. W. Tang, Y. R. Wu, Z. Zhu and W. H. Tan, J. Am. Chem. Soc., 2008, 130, 8351 CrossRef CAS; (b) X. Y. Ouyang, R. Q. Yu, J. Y. Jin, J. S. Li, R. H. Yang, W. H. Tan and J. L. Yuan, Anal. Chem., 2011, 83, 782 CrossRef CAS.
- H. P. Liu, T. Ye and C. D. Mao, Angew. Chem., Int. Ed., 2007, 46, 6473 CrossRef CAS.
- M. Zheng, A. Jagota, E. D. Semke, B. A. Diner, R. S. Mclean, S. R. Lustig, R. E. Richardson and N. G. Tassi, Nat. Mater., 2003, 2, 338 CrossRef CAS.
- (a) J. Wang and B. Liu, Chem. Commun., 2008, 4759 RSC; (b) S. Mondal and V. Venkataraman, J. Biochem. Biophys. Methods, 2007, 70, 773 CrossRef CAS.
- The affinity of SG to dsDNA and CNPs was estimated by monitoring the fluorescence of SG–dsDNA with/without CNPs (Fig. S8, ESI†).
- (a) C. H. Lu, H. H. Yang, C. L. Zhu, X. Chen and G. N. Chen, Angew. Chem., Int. Ed., 2009, 48, 4785 CrossRef CAS; (b) C. H. Lu, J. Li, J. J. Liu, H. H. Yang, X. Chen and G. N. Chen, Chem.–Eur. J., 2010, 16, 4889 CAS.
- F. Barras and M. G. Marinus, Trends Genet., 1989, 5, 139 CrossRef CAS.
- G. E. Geier and P. Modrich, J. Biol. Chem., 1979, 254, 1408 CAS.
Footnotes |
| † Electronic supplementary information (ESI) available: Experiments and other mentioned data. See DOI: 10.1039/c1cc15511c |
| ‡ X. Ouyang and J. Liu contributed equally to the work. |
| This journal is © The Royal Society of Chemistry 2012 |
