Determination of critical concentrations by synchronous fluorescence spectrometry†
Daoyong
Yu
*ab,
Fang
Huang
a and
Hai
Xu
*a
aState Key Laboratory of Heavy Oil Processing, Centre for Bioengineering and Biotechnology, China University of Petroleum, Qingdao, Shandong 266555, China. E-mail: daoyong@upc.edu.cn; xuh@upc.edu.cn; Fax: + 86 532 8698 1135; Tel: + 86 532 8698 1135
bLaboratory of Molecular Self-Assembly, Centre for Biomedical Engineering, Massachusetts Institute of Technology, Cambridge, MA 02139, USA
First published on 18th November 2011
Abstract
We demonstrate that by using constant wavelength synchronous fluorescence spectrometry (CW-SFS) critical concentrations of some types of aggregation can be quantified. Detection of aggregation associated with hydrogen bonding in Chlorin e6 and Triton X-100 suggest that CW-SFS may be a technique that can explore aggregation at much lower levels (dimer, trimer, oligomer, etc.)
Critical concentrations of analytes dispersed in solvents are important parameters, and it is crucial to exactly measure them (ESI† Note 1). The critical concentration is a relatively narrow concentration range over which solutions usually show an abrupt change in physical properties such as electrical conductivity, surface tension, osmotic pressure, density, viscosity, and light scattering. A micelle is a special form of aggregate, which can include several interactions such as hydrogen bonding, hydrophobic, and electrostatic. Critical micelle concentration (CMC) is one of the most important physical parameters of surfactants, above which aggregation of the molecule to form a micelle is spontaneous, and the physical properties of the solution show corresponding abrupt changes. A wide variety of techniques to determine CMC have been reported,1 but often each method only applies to a specific type of surfactant and most have shortcomings, such as low sensitivity, the need for dye or probe, or large volumes of sample. Fluorescence-based methods have also been used extensively for CMC determination due to their relative quickness and ease, but these conventional fluorescence-based methods need probes2 which sometimes cause unwanted problems. For example, when the CMC of surfactants is very low and pyrene is being used as the probe, it is difficult to obtain a clear turning point because there are not enough micelles to solubilise pyrene.3 Compared with conventional fluorescence spectrometry the main characteristics of synchronous fluorescence spectrometry are a narrowing of the spectral band, simplification of the emission spectra, and contraction of the spectral range.4 Recently, synchronous fluorescence spectrometry (SFS) has become an attractive method for qualitative and quantitative analysis,5 and SFS is preferable for the simultaneous analysis of complex multicomponent samples.6
We have developed a new sensitive method to determine critical concentrations using constant wavelength synchronous fluorescence spectrometry (CW-SFS) combined with UV-Vis absorption spectroscopy, which requires no additive and, because it is not limited to traditional fluorescing surfactants, can be applied to nearly all types of surfactant (ESI† Table S1). Here CW-SFS is employed to enable a convenient selection of an optimal wavelength at which there should be linearity of fluorescence intensity versus concentration, i.e., A = εbc < 0.1 over the measured concentration range and the smaller A is the better (ESI† Note 2). By selecting an appropriate wavelength and plotting a curve of fluorescent intensity versusanalyte concentration, CW-SFS can be used to determine critical concentrations of any type in solutions, with a relatively broad range of application, and characterised by high sensitivity, small amounts of sample, and rapid analysis.
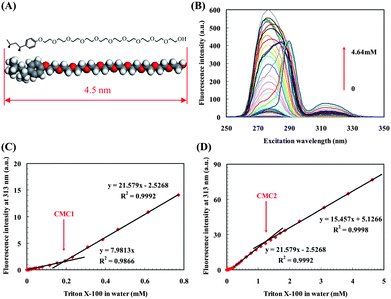
As an initial test of the sensitivity of the method we have used CW-SFS to determine the CMCs of Triton X-100, which is a typical nonionic surfactant with a hydrophilic polyethylene oxide group (on average including 9.5 ethylene oxide units and one end hydroxyl group) and a hydrocarbon hydrophobic 4-(1,1,3,3-tetramethylbutyl)-phenyl group (Fig. 1A). Triton X-100 micelle is excited at 313 nm (Fig. 1B) and after micelle formation, the fluorescence intensity at λex = 313 nm linearly increases with concentration, and the intersection of the two slopes gives CMC1 (Fig. 1C). More micelles form at high concentration, and micelles bump into each other and form large aggregates as the concentration is higher than CMC2, thus an apparent slope decrease occurs (Fig. 1D). Both CMCs are consistent with the data from other standard techniques (ESI† Table S1), and the aggregates can be detected by dynamic light scattering (DLS, ESI† Fig. S5D–G).
 | ||
| Fig. 1 CMC determination of Triton X-100 in MilliQ water. (A) Corey-Pauling-Koltum model of Triton X-100, the maximum length is ∼4.5 nm and intermolecular hydrogen bonds can be formed among hydrophilic polyethylene oxide groups. (B) CW-SFS spectra of Triton X-100 in MilliQ water, quenching caused by the inner-filtration effect occurred in high concentration samples. (C,D) Plot of fluorescence intensity versus Triton X-100 concentration with obvious slope change, mean of 5 runs and the error bars are less than the data symbols. (C) CMC1, the relative slope change is 170.4% which is much greater than the theoretical slope change (ESI† Note 2 Appendix) −0.6% with A≥313nm < 0.005. (D) CMC2, the relative slope change is −28.4% which is much greater than the theoretical slope change −2.5% with A≥313nm < 0.02. | ||
According to the generating mechanism, fluorescence can be emitted by any molecule which absorbs photons in the UV range, but usually scientists only consider chemicals with fluorescence quantum yield >0.1. Thus, the fluorescent or non-fluorescent chemicals result only from a commonly defined concept. On the other hand, fluorometry has become more and more sensitive than ever before, which allow us to use the technique to measure the critical concentration of named non-fluorescent chemicals. This has been demonstrated by using CW-SFS to determine the critical concentrations of sodium dodecyl sulfate (SDS, ESI† Fig. S6) and Fos-Choline®-14 (FC-14, ESI† Fig. S7), and the reliability of these measurements were verified by other techniques such as surface tension, electrical conductivity, and molecular absorption spectrometry (ESI† Table S1).
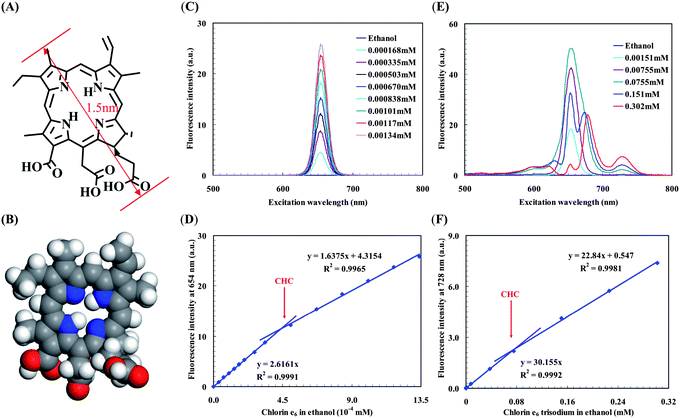
We further applied CW-SFS to examine the possibility of aggregation in Chlorin e6 and its trisodium salt in ethanol (Fig. 2 and ESI† Fig. S8). CW-SFS is sensitive enough to obtain critical concentrations in very dilute solutions, but it does not necessarily show a type of aggregation by itself. However, it is often possible to use simple arguments in conjunction with the concentration data to identify possible structures. Chlorin e6 could in principle aggregate either through hydrogen bonding, aromatic π–π stacking, or hydrophobic interactions. There are three carboxylic acid groups at side-branches and four nitrogen atoms at the central porphin ring in one Chlorin e6 molecule (Fig. 2A,B). There is therefore a possibility of strong intermolecular hydrogen bonding between the polar –COOH groups and the onset of any aggregation associated with this should be detectable with CW-SFS. This is clear in Fig. 2D and we can tentatively identify a critical hydrogen-bond assembling concentration (CHC) from the data. In addition, for the Chlorin e6trisodium salt to form stable hydrogen bonds, it is first necessary for the electronegative carboxylic anions to partially hydrolyse to carboxylic acids. Thus the CHC of Chlorin e6trisodium salt would be expected to be much higher than Chlorin e6. In Fig. 2F, the 2 order of magnitude increase in the aggregation concentration observed of the salt of Chlorin e6 shows that hydrogen bonding must be the key driver. And the formation of hydrogen-bond assembling had been confirmed by DLS results (ESI† Fig. S9,S10). When the concentration is lower than CHC, Chlorin e6 monomers are main particles detected by DLS. On the other hand, when the concentration is higher than CHC, a large hydrogen-bond assembling aggregate was found with a size of hundreds of nanometres. Because hydrogen bonds can easily be made and broken at room temperature,7 this kind of hydrogen bonding aggregate is unstable, and easily disturbed by mechanical vibrations, but there is an equilibrium established between assembly and disassembly. We observed a gradual size changing of the hydrogen bonding aggregate by dynamic light scattering, and only the equilibrium size is reported (ESI† Fig. S9,S10).
 | ||
| Fig. 2 Aggregation of Chlorin e6 and its trisodium salt in ethanol. (A) Structure of Chlorin e6, maximum length ∼1.5 nm. (B) Corey-Pauling-Koltum model of Chlorin e6, geometry optimized by Accelrys' DMol3 module in Materials Studio v5.0.0.0, and intermolecular hydrogen bonds can be formed among carboxylic acid groups. (C) CW-SFS spectra of Chlorin e6 in ethanol. (D) Plot of fluorescence intensity versusChlorin e6 concentration with obvious slope change. The relative slope change is −37.4% which is much greater than the theoretical slope change −7.5% with A≥654nm < 0.06. (E) CW-SFS spectra of Chlorin e6 trisodium in ethanol, quenching caused by the inner-filtration effect occurred in high concentration samples. (F) Plot of fluorescence intensity versusChlorin e6 trisodium concentration with obvious slope change. The relative slope change is −24.3% which is greater than the theoretical slope change −9.7% with A≥728nm < 0.08. (D,F) mean of 5 runs and the error bars are less than the data symbols. | ||
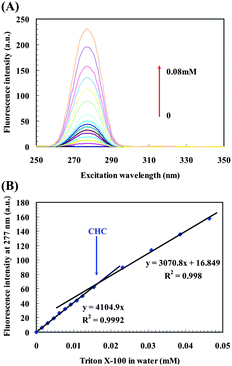
We also applied CW-SFS to examine the possible CHC of Triton X-100 in MilliQ water (Fig. 3 and ESI† Fig. S4). A new definition of hydrogen bond is reported8 and a detailed technical report provides the rationale behind the new definition.9 According to the chemical structure of Triton X-100, there is a hydroxyl group at the end of the hydrophobic head, and there are about 10 ether–oxygens with lone-pair electrons. These groups are capable of forming hydrogen bonds. Triton X-100 free monomer (phenyl ring) is excited at 277 nm (Fig. 3A), and the fluorescence intensity at λex = 277 nm is linearly increased versus concentration. When the concentration is higher than CHC, an apparent slope decrease occurs due to the formation of intermolecular hydrogen bonds (Fig. 3B).10 The large aggregate, with a size of hundreds of nanometres, formed by hydrogen bonding was confirmed by DLS results (ESI† Fig. S5A–C).
 | ||
| Fig. 3 CHC determination of Triton X-100 in MilliQ water. (A) CW-SFS spectra of Triton X-100 in MilliQ water. (B) Plot of fluorescence intensity versus Triton X-100 concentration with obvious slope change, mean of 5 runs and the error bars are less than the data symbols. The relative slope change is −25.2% which is greater than the theoretical slope change −7.5% with A≥277nm < 0.06. | ||
The initial intention of this work was to develop and present a simple method for quantitative analysis and to investigate how the technique of CW-SFS can be applied to obtain critical concentrations, especially in more complex situations, for example, in the conditions under which surfactants are used in membrane protein separation, purification, stabilisation and crystallisation. In these situations it is important to exclude the use of species such as fluorescent probes and the complexity often makes it impossible to use many of the traditional techniques such conductivity and surface tension. An unexpected by-product of the work has been the detection of aggregation associated with hydrogen bonding in Chlorin e6 and Triton X-100, which suggests that CW-SFS may be a technique that can explore much lower level aggregation (dimer, trimer, oligomer, etc.) that is characteristic of so many biomolecules, such as enzymes and proteins. This aggregation occurs at very low concentrations of the aggregating species and often needs to be studied in complex solutions typical of biological conditions, where, even if other techniques have the sensitivity, they cannot be used because of interference.
Acknowledgements
We thank Dr Robert K. Thomas at Oxford University for his critical discussions. This work was supported in part by the Fundamental Research Funds for the Central Universities, Shandong Provincial Natural Science Foundation (No. ZR2010BL008), and the National Natural Science Foundation of China (No. 20773164). Daoyong Yu thanks the China University of Petroleum and Dr Shuguang Zhang at the Laboratory of Molecular Self-assembly at MIT for their financial support.Notes and references
- A. Patist, Handbook of Applied Surface and Colloid Chemistry, Ed. K. Holmberg, John Wiley & Sons, Chichester, U.K. 2001, 2, 239 Search PubMed.
- Y. Nakahara, T. Kida, Y. Nakatsuji and M. Akashi, Langmuir, 2005, 21, 6688 CrossRef CAS.
- (a) O. Regev and R. Zana, J. Colloid Interface Sci., 1999, 210, 8 CrossRef CAS; (b) T. Yoshimura and K. Esumi, J. Colloid Interface Sci., 2004, 276, 450 CrossRef CAS.
- D. Patra and A. K. Mishra, TrAC, Trends Anal. Chem., 2002, 21, 787 CrossRef CAS.
- (a) Á. Andrade-Eiroa, G. de-Armas, J.-M. Estela and V. Cerdà, TrAC, Trends Anal. Chem., 2010, 29, 885 CrossRef; (b) Á. Andrade-Eiroa, G. de-Armas, J.-M. Estela and V. Cerdà, TrAC, Trends Anal. Chem., 2010, 29, 902 CrossRef.
- (a) N. Zhou, H. D. Luo, N. Li, Y. Z. Jia and Y. Q. Li, Luminescence, 2011, 26, 35 CrossRef CAS; (b) X. Y. Li, N. Li, H. D. Luo, L. R. Lin, Z. X. Zou, Y. Z. Jia and Y. Q. Li, J. Agric. Food Chem., 2011, 59, 5899 CrossRef CAS.
- A. D. Buckingham, J. E. Del Bene and S. A. C. McDowell, Chem. Phys. Lett., 2008, 463, 1 CrossRef CAS.
- E. Arunan, G. R. Desiraju, R. A. Klein, J. Sadlej, S. Scheiner, I. Alkorta, D. C. Clary, R. H. Crabtree, J. J. Dannenberg, P. Hobza, H. G. Kjaergaard, A. C. Legon, B. Mennucci and D. J. Nesbitt, Pure Appl. Chem., 2011, 83, 1637 CrossRef.
- E. Arunan, G. R. Desiraju, R. A. Klein, J. Sadlej, S. Scheiner, I. Alkorta, D. C. Clary, R. H. Crabtree, J. J. Dannenberg, P. Hobza, H. G. Kjaergaard, A. C. Legon, B. Mennucci and D. J. Nesbitt, Pure Appl. Chem., 2011, 83, 1619 CrossRef.
- CW-SFS is much more sensitive than absorption spectrometry. As for Triton X-100, there is no apparent slope change relevant to CHC in ESI† Fig. S4B.
Footnote |
| † Electronic supplementary information (ESI) available: Notes, Materials, Methods, Table S1 and Figures S1–S10. See DOI: 10.1039/c1ay05495c |
| This journal is © The Royal Society of Chemistry 2012 |
