Optimization of solid-phase microextraction (SPME) to determine airborne biogenic volatile organic compounds (BVOCs): An application for measurement of household cleaning products
Yu
Huang
a,
Steven Sai
Hang Ho
bc,
Kin Fai
Ho
b,
Shun Cheng
Lee
*a,
Yuan
Gao
a and
Natale Sin
Yau Feng
d
aResearch Centre for Environmental Technology and Management, Department of Civil and Structural Engineering, The Hong Kong Polytechnic University, Hung Hom, Hong Kong, China. E-mail: ceslee@polyu.edu.hk; Fax: +852-23346389; Tel: +852-27666011
bSKLLQG, Institute of Earth Environment, Chinese Academy of Sciences, Xi'an, 710075, China
cDivision of Atmospheric Sciences, Desert Research Institute, Reno, NV 89512, United States
dHong Kong Premium Services and Research Laboratory, Hong Kong, China
First published on 28th November 2011
Abstract
Biogenic volatile organic compounds (BVOCs) in household cleaning products play key roles in indoor air quality (IAQ) because they are precursors for secondary pollutants formation. An accurate and rapid analytical technique for their measurement is of importance. This paper describes an optimization of a method for solid-phase microextraction (SPME) coupled with gas chromatography/mass spectrometry (GC-MS) for the determination of BVOCs. SPME fibers coated with Carboxen-PDMS are used to collect 12 individual BVOCs under standard conditions with a short exposure time of 5 min. Parameters influencing the extraction processes including sampling time, temperature and relative humidity are also investigated. All of the targeted BVOCs are shown to have limits of detection (LODs) in mixing ratios ranging from 0.31–0.50 ppbv, which are two magnitudes better than the LODs reported. The method precisions are between 1.1% and 6.7%. Comparison studies were carried out on a set of four floor cleaner extracts using the SPME method and traditional liquid injection method. Good agreement of the targeted BVOCs by the two methods was demonstrated. Our results indicated that SPME can serve as a simple and rapid sample collection approach to quantify BVOCs accurately and precisely in the indoor environment.
1. Introduction
Biogenic volatile organic compounds (BVOCs), dominated by monoterpenes and oxygenated monoterpenes, are commonly used as solvents or odorants in household cleaning products which are utilized regularly in indoor environments for hygiene purposes.1 These unsaturated compounds are very reactive. For example, indoor BVOCs can react rapidly with ozone (O3), producing formaldehyde, hydrogen peroxide (H2O2), hydroxyl radicals (·OH) and secondary ultrafine particles (Dp < 100 nm), to produce adverse effects on human health.2 Therefore, characterization and quantification of BVOCs either present in or emitted from cleaning products are important to understand their roles in indoor chemistry. In view of this point, an accurate and rapid measurement of BVOCs in the indoor environment is crucial.The high reactivity of many BVOCs makes it difficult to collect and analyze these species using common analytical techniques. The traditional sampling method is to collect them onto solid adsorbents such as porous organic polymers (e.g., Tenax TA and Tenax GR) or carbon-based materials (e.g., Carbotrap and Carbograph) which are consequently thermally desorbed into a gas chromatography (GC) instrument.3Analytes can be then detected using a flame ionization detector (FID) or mass spectrometer (MS). Furthermore, the use of electro-polished stainless steel canisters has also been employed in sampling of those compounds. The whole air samples are commonly re-concentrated using cryo-focusing before being released into the GC.4 However, the stability of these highly reactive compounds is questionable during the sampling and post-sampling period. Alternatively, solid-phase microextraction (SPME), which is a solvent-free sample collection technique that integrates sampling, isolation and concentration of the target analytes, has attracted more and more attentions recently. The sampled SPME can be directly desorbed in the injection port of the GC-MS system. It usually complies with thermal desorption (TD) followed by gas chromatographic separation and various detections which is an alternative passive sampling method for environmental monitoring,5–8pharmaceutical9 and food10 analyses. TD offers a high desorption efficiency and avoids unnecessary sample dilution, leading to an increase of analytical sensitivity.11SPME is suitable to be employed in indoor measurements since the air flow velocity and direction are very stable. For instance, Larroque et al.12 developed a SPME method for sampling representative VOCs of indoor environments including acetaldehyde, acetone, and BTX etc. The calibration curves for these compounds showed good correlation coefficients (>0.99). More recently, the emission of low molecular weight (MW) compounds from recycled high-impact polystyrene has been investigated using headspace-SPME coupled with GC-MS.13 However, in both these studies equilibrium extraction processes were adopted which required a long sampling time (normally larger than 30 min). This may enhance the competitive adsorption making quantification particularly challenging. In contrast, non-equilibrium short-time extraction is much preferred because it would minimize the sampling collection time and thus reduce duration variations in concentrations of target compounds. BVOCs in indoor environments, mainly from the use of household cleaning products, is a matter of increasing concern because they are prone to react with ozone to form harmful secondary pollutants which can pose risks on indoor air quality and human health. To the best of our knowledge, limited studies have been reported on determination of BVOCs with the SPME method in indoor environments, especially BVOC components in household cleaning products.
In this paper, we describe a standardization of the SPME sampling, which is coupled with GC-MS detection, for quantification of airborne BVOCs. A linear correlation is shown between analytes adsorption and their mixing ratios in the atmosphere under standard environment with a short-term fiber exposure. Optimal sampling parameters (i.e., sampling duration) and analytical procedures (i.e., desorption temperature and duration) have been examined. The influences from air temperature (T) and relative humidity (RH) on the SPME extraction efficiency have also been investigated. The feasibility of this method is demonstrated to determine the mass composition profiles of BVOCs for household floor cleaners in Hong Kong.
2. Experimental
2.1 Preparation of test atmosphere
Liquid vaporization into a Tedlar bag was used in preparing gaseous standards for calibration and method characterization. The highest purity of BVOCs standards of α-pinene, camphene, β-pinene, myrcene, 3-carene, p-cymene, d-limonene, eucalyptol, γ-terpinene, terpinolene, linalool and α-terpineol were purchased from Aldrich (Milwaukee, WI) and Fluka (Buchs, SG, Switzerland). The standards were diluted with cyclohexane (AR grade, Pestinorm, BDH, Poole, UK). A 12 L Tedlar bag (SKC Inc., Eighty Four, PA) was cleaned by filling it with air supplied by a zero air generator (Model 111, Thermo Environmental Inc., Sugar Land, TX) and evacuating it with laboratory suction at least four times before use. The clean bag was then filled with 10 L of the zero air monitored by a calibrated flow meter. A known amount of diluted standard solution was injected into the clean bag with a micro-syringe (Hamilton, Reno, NV) through a septum. Liquid vaporization was allowed by keeping the filled bag in a temperature-regulated environmental chamber at 23 °C for 2 h. All discharges from the Tedlar bag were directed into a fume hood as a safety measure.2.2 Solid-phase microextraction (SPME) method
A manual SPME sampling holder consists of a 75 μm Carboxen-PDMS fiber (Supelco, Bellefonte, PA). New fibers were heated in a GC injection port (6890 GC, Hewlett-Packard, Santa Clara, CA) at a continuous helium (He) gas flow at 300 °C for 1 h, aiming to thermally desorb any impurities. The conditioned fibers were stored properly inside a clean box in the laboratory. Before sample collection, each fiber was reconditioned in the GC injection port at 300 °C for 10 min. The experimental results show that no significant amount of BVOCs remained on the fiber. Each conditioned fiber was exposed in the test atmosphere for 5 min.2.3 Sample analysis
Once the sampling was completed, the fiber was stored and then inserted into the GC injection port at 280 °C for 4 min. During the desorption period, the GC oven temperature was kept at 50 °C. Such a temperature condition would allow the analytes to be released from the SPME fiber on the head of the GC column in a narrow band. The injector was kept in the splitless mode for the first 2 min and then switched to the split mode until the end of the GC oven temperature program. The GC oven temperature program was then started, which was initially set at 50 °C and held at this temperature for 3 min, ramped at a rate of 5 °C min−1 to 95 °C and 10 °C min−1 to 130 °C and 55 °C min−1 to 290 °C, and then held at the final temperature of 290 °C for 3 min. A DB-5MS UI column (J&W, Agilent Technologies, Inc., Santa Clara, CA, 30 m × 25 mm i.d. × 25 μm film thickness) was adopted for the analytes separation. The GC injector temperature was kept at 280 °C throughout the analysis. The carrier gas was He (ultra-high purity grade) held at a constant flow of 1.0 ml min−1. The analytes after the GC separation were detected using a MS (5973 MS, Hewlett-Packard), which was operated at an ion source temperature of 230 °C and 70 eV for electron-impact ionization (EI). The mass scan range was from 50 to 200 amu. Identification was achieved by comparing the mass spectra with the NIST 08 MS library and retention times of the chromatographic peaks with those of calibration standards. The two or three most abundant ion fragments of each BVOC were selected as extract ions for the quantification. Table 1 summarizes the quantitative information for the targeted BVOCs.| BVOCs | Formula | MW | Quantification ion | Boiling point (°C) | Slope | Intercept | R 2 | LOD (ppbv) | RSD |
|---|---|---|---|---|---|---|---|---|---|
| α-Pinene | C10H16 | 136.23 | 77,93,121 | 155–156 | 286.9 | 105.1 | 0.997 | 0.44 | 1.9% |
| Camphene | C10H16 | 136.23 | 79,93,121 | 159–160 | 219.0 | −47.8 | 0.999 | 0.48 | 3.3% |
| β-Pinene | C10H16 | 136.23 | 69,79,93 | 155–156 | 312.6 | 82.7 | 0.999 | 0.39 | 4.4% |
| Myrcene | C10H16 | 136.23 | 69,93 | 167 | 173.7 | −22.5 | 0.998 | 0.33 | 5.2% |
| 3-Carene | C10H16 | 136.23 | 77,93,121 | 168–169 | 373.5 | 145.4 | 1.000 | 0.45 | 2.3% |
| p-ymene | C10H14 | 134.22 | 91,119,134 | 176–178 | 1538.4 | −24.2 | 0.994 | 0.50 | 6.7% |
| D-Limonene | C10H16 | 136.23 | 68,93 | 170–180 | 166.1 | 2.3 | 0.996 | 0.50 | 4.6% |
| Eucalyptol | C10H18O | 154.25 | 81,108,111 | 176–177 | 199.1 | −1 | 1.000 | 0.33 | 6.0% |
| γ-Terpinene | C10H16 | 136.23 | 93,119,136 | 182 | 167.3 | −26.8 | 0.999 | 0.31 | 1.1% |
| Terpinolene | C10H16 | 136.23 | 93,121,136 | 184–185 | 101.9 | −50.2 | 0.993 | 0.42 | 2.9% |
| Linalool | C10H18O | 154.25 | 55,71,93 | 194–197 | 113.3 | 56 | 0.999 | 0.37 | 3.8% |
| α-Terpineol | C10H18O | 154.25 | 59,93,136 | 217–218 | 199.8 | −14.7 | 0.999 | 0.35 | 1.3% |
2.4 Method characterization
The atmosphere only with calibration solution had a RH of <1%. Test atmospheres of 18%, 30%, 50%, 80% and 90% RH were generated by injecting the amount of Milli-Q water required to achieve these RH under the same experimental conditions. The Tedlar bag was heated gently using a hair-dryer to promote the complete evaporation of the injected aliquot. In the temperature influence study, the filled bag was kept in the environmental chamber which was controlled precisely at 15, 23 and 30 °C.14,152.5 Determination of BVOCs compositions in floor cleaners
Three millilitres of each aqueous household floor cleaner were extracted respectively with 2 ml of cyclohexane. The recovery test shows that close to 100% of efficiency was found in the liquid–liquid extraction for BVOCs. The supernatant (cyclohexane) layer was transferred into a clean capped vial. Ten microlitres of the extract were injected into the zero-air filled bag, which was also injected with Milli-Q water to adjust the RH to 18%. The air bag was conditioned in a large environmental chamber at a temperature of 23 °C for 2 h. Both the sample collection and analytical protocol were the same as those applied for the method characterization and calibration.Each extract was also manually injected through the GC injector at 250 °C. The injector was kept in the splitless mode for the first 2 min and then switched to the split mode until the end of the GC oven temperature program. The column and the MSD conditions were the same as those used in the SPME method. Calibration curves were established by plotting the peak areas of analyteversus the amounts of analytes per injection.
3. Results and discussion
3.1 Optimization of SPME exposure duration
Equilibrium extraction and linear uptake are the two most popular methods employed in quantification of target air pollutants for passive sampling.16 With an equilibrium extraction approach, it involves exposing the fibers into the sample matrix (i.e., air or water solution) until the adsorption and desorption of analytes on the fibers reach dynamic equilibrium. Once the equilibrium point was achieved, the amount of analytes adsorbed onto the fiber would not significantly increase with a prolonged sampling time. However, before the dynamic equilibrium is reached, the amount of analytes adsorbed onto the fiber is linearly proportional to the amount of analytes in the sample matrix and also the fiber exposure time. Such a linear uptake method is much preferred because it would minimize the sampling collection time and thus reduce duration variations in concentrations of target compounds.6 As a result, a proper exposure time is essential to guarantee a linear correlation between the amount of analytes adsorbed onto the fiber and that contained in the sample matrix.To evaluate threshold exposure duration, the extraction efficiencies at different durations were examined by exposing the Carboxen-PDMS fibers in the Tedlar bag, which contained a mixture of the BVOCs of interest at 120 ppbv. Such concentration in the test atmosphere was higher than the emission concentrations from the household cleaning products and air fresheners.17,18 The threshold value is defined as the point up to which a clear linear correlation is observed by comparing the detector response to the exposure duration (in unit of min). Fig. 1 demonstrates the extraction efficiency profiles for the 12 BVOCs. The time required to reach adsorption equilibrium point was much shorter for the target compounds including α-pinene, camphene, β-pinene and eucalyptol, with an experimental time of 15 min. The duration is consistent with the value reported when a 65 μm polydimethylsiloxane/divinylbenzene (PDMS/DVB) fiber was used.6 The threshold exposure duration was 40 min for 3-carene. The longest threshold exposure duration were seen for myrcene, p-cymene, D-limonene, γ-terpinene, terpinolene, linalool, and α-terpineol, which were all >120 min. Based on the experimental results, the extraction time of 5 min was selected in this study for both calibration and quantification of BVOCs in the atmospheres, minimizing any competitive adsorption onto the SPME fiber. The linear uptake of 5 min exposure duration was further confirmed by examining the extraction efficiencies at targeted BVOCs concentrations of 60, 120, 1200, and 2,400 ppbv (Fig. 2). It is important to stress that the linear uptake can be affected by the amounts of other gases which can be adsorbed by the fiber. The competition of active sites may result in prior saturation.
 | ||
| Fig. 1 Extraction efficiency profiles of BVOCs using the Carboxen-PDMS fiber with different exposure times. The figures were plotted as detector response (peak area) versus the fiber exposure time (min). | ||
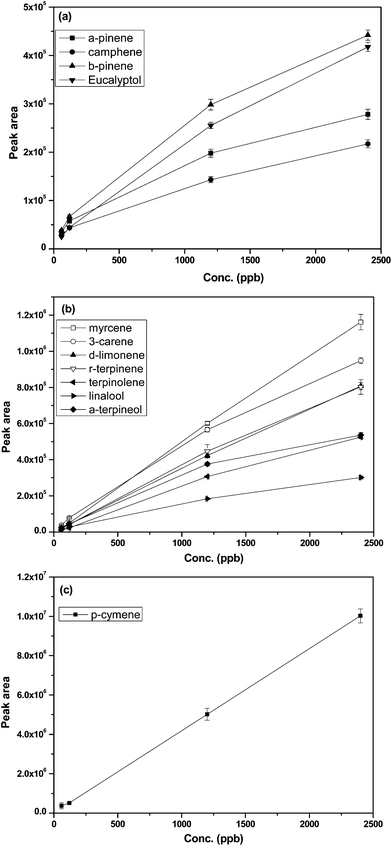 | ||
| Fig. 2 Extraction efficiency profiles of BVOCs of different concentration using the Carboxen-PDMS fiber with exposure time of 5 min. The figures were plotted as detector response (peak area) versus the BVOCs concentration (ppbv). | ||
3.2 Desorption duration
The optimal desorption duration is the minimum time that is required for complete desorption of target analytes from the SPME fiber and subsequent transfer from the GC injection port to the capillary column head. An unnecessarily longer TD time would result in peak broadening and also lengthen the total analysis time.19 As a recommendation from the manufacturer, a TD temperature of 280 °C was sufficient to desorb all target BVOCs from the SPME fiber which was set to determine an optimal desorption time. Four desorption durations of 1, 2, 4, and 5 min were allowed to elapse before the GC temperature program was started. Desorption efficiencies were accounted by analyzing the fibers exposed in the test atmosphere under the same conditions. Fig. 3 compares the desorption efficiencies of the target BVOCs with the four different desorption durations. With the desorption duration of 1 min, the responses of both BVOCs of interest were 20–40% lower compared with that desorbed for 4 min, suggesting an incomplete desorption. Lower desorption efficiencies (>20%) were also found with desorption duration of 5 min. This can be attributed to the capillary column not being able to retain the BVOCs efficiently at the initial GC oven temperature of 40 °C over a long desorption duration. The variation of desorption efficiencies between the desorption temperature of 2 and 4 min were within 10%. An optimal desorption duration of 4 min was thus applied to ensure the best desorption efficiency can be achieved. | ||
| Fig. 3 Relative desorption efficiencies with desorption duration of 1, 2, and 5 min to those with 4 min for the targeted BVOCs. | ||
3.3 Influence from temperature
Temperature is one of the key parameters affecting the gas adsorption onto the SPME fibers. The extraction efficiencies for the targeted BVOCs were examined at three different temperatures of 15, 23 and 30 °C with other conditions unchanged. The peak areas for the compounds sampled at 15 and 30 °C were normalized to the peak area of corresponding compound sampled at 23 °C (Fig. 4). In general, more analytes were adsorbed onto the SPME fiber while the temperature increased. This can be ascribed to the increase of the gas-phase molecular diffusion coefficient (denoted as Dg), which is directly proportional to temperature.20 The increase of Dg can result in the increase of adsorbed mass under certain sampling times in turn. As reported by Koziel et al. (2000), the amount of extracted VOCs (i.e., benzene, toluene and p-xylene) mass increased almost linearly when the air temperature increased slightly from 22 to 25 °C.20 However, we did not have a similar observation for α-pinene, camphene, β-pinene and eucalyptol. The variations of extraction efficiencies were not significant over the tested temperature ranges, referring to the relatively lower boiling point of these compounds and their associated weak affinity to the fiber. Another exceptional case is for α-terpineol of which the extraction efficiency decreased at both 15 and 30 °C. This was possibly due to the reduction of adsorbent effectiveness to that compound at incongruous temperatures. The extraction efficiencies for p-cymene and linalool decreased at 15 °C but were consistent at 30 °C, compared with that at 23 °C. This further suggests that the fiber may operate more efficiently in adsorption of particular compounds at higher temperatures. A medium temperature of 23 °C was selected as a standard for collection of both calibration standards and samples. | ||
| Fig. 4 The effect of temperature on the extraction efficiencies of BVOCs. | ||
3.4 Influence from relative humidity
The extraction efficiencies for the targeted BVOCs sampled at five different RH of 18, 30, 50, 80 and 90% are shown in Fig. 5. The presence of water vapor offered a negative effect to analyte adsorption with the SPME fiber, namely less mass was adsorbed at higher RH levels.20 Koziel et al. (2000) demonstrated a substantial drop in mass absorption for benzene at the RH of 75%. It is noted that the RH effect on the extraction efficiencies was ignorable for few BVOCs of interest (e.g., α-pinene, camphene, and β-pinene). For the other compounds, the extraction efficiencies decreased generally at the RH of 30% but did not vary at the RH of 90%, compared with that at RH of 18%. There is not any specific explanation for such a phenomenon, but the results can prove that the active sites on the fiber would not be saturated by water molecules during the short extraction duration. In order to provide a consistent working environment for SPME, the RH in the sampled atmospheres was adjusted to 18%. | ||
| Fig. 5 The effect of relative humidity (RH) on the extraction efficiency of BVOCs. | ||
3.5 Sample stability
Fig. 6 compares the detector responses for the fibers being analyzed immediately and stored at 23 °C for 12 h after exposure in the same test atmosphere. The variations for most target compounds were within ±10%, except linalool (16.0%), 3-carene (21.6%), γ-terpinene (30.3%) and terpinolene (30.8%). It is reasonable that a small loss of volatile BVOCs was seen along the storage duration. However, the average response of less volatile compounds including linalool, γ-terpinene and terpinolene was even higher for the fiber being stored for 12 h than that analyzed at once. It was possibly due to large measurement deviations which were found usually for the stored samples. Considering the SPME sampling method would be applied in future field studies, all fibers after exposure in the target atmosphere were kept in the clean box for 12 h before desorption to the GC.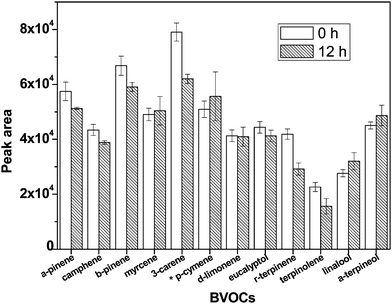 | ||
| Fig. 6 Detector responses of BVOCs after collection over storage duration from 0 to 12 h.*p-cymene: the detector response is divided by a factor of 10 to fix the scale for other compounds. | ||
3.6 Calibration and limit of detection (LOD)
The calibration curves for the tested BVOCs were constructed by exposing the SPME fiber in a gaseous BVOC mixture of known mixing ratios for 4 min. The mixing ratios of individual BVOCs in the Tedlar sampling bags ranged from 10 to 120 ppbv at the temperature of 23 °C and RH of 18%. The calibration curves were plotted as the total peak areas of the respective quantification ions versus the mixing ratio of BVOCs in the standard atmosphere. Even though many targeted BVOCs are constitutional or spatial isomers, their EI mass spectra are generally distinguishable. The two or three most abundant fragment ions were selected as quantification ions for each compound. The m/z 93 ion is the base peak in EI mass spectra of most but not for p-cymene and eucalyptol. Table 1 lists the calibration slopes, intercepts, and coefficients of determination, and limits of detection (LOD) for the 12 BVOCs. The coefficients of determination are all >0.99. The values demonstrate that the SPME method is reliable for quantification of BVOCs at standard conditions.The limit of detection (LOD) of the method is defined as the minimum amount of a selected standard that generates the minimum distinguishable signal plus three times the standard deviation of the blank signals. No peaks were detected for the BVOCs in the blank calibration samples. Hence, we approximated the mean blank signal with the calibration line intercept and the blank signal standard deviation with the standard error for the y (peak area ratio) estimate.21 The LODs in the mixing ratio were 0.31–0.50 ppbv for the 12 BVOCs. Our values are two magnitudes better than the LODs reported by Sanchez-Palomo et al. (2005) using an SPME approach with the 65 μm PDMS/DVB fiber.22
3.7 Method precision
Three replicates were examined for the fibers exposed in the same test atmosphere containing BVOC mixture at a mixing ratio of 70 ppbv. The method precision was demonstrated by calculating the relative standard deviation (RSD) of the replicates, which was reported for each compound in Table 1. The observed RSD ranged from 1.1 to 6.7%, indicating that the passive sampling and the analytical protocol are highly reproducible in the quantification of gaseous BVOCs.3.8 BVOCs composition profiles in floor cleaners
The organic extracts from four floor cleaner samples (FC#1-FC#4) were analyzed using the SPME method under optimal conditions. The samples were selected based on the extent of product consumption in Hong Kong and the scent shown on the label of their containers. The data obtained in mixing ratio was converted to mass concentration, presenting in the amount of BVOC (microgram) in one gram of floor sample. Table 2 shows the mass concentrations for the four floor cleaner samples. The mass concentration of total quantified BVOCs for FC#1 was the highest which was 4145 ± 888 μg per gram of floor cleaner sample (μg g−1). The total mass concentrations for other three samples were a magnitude lower than FC#1, ranging from 139 ± 3.9 to 265 ± 24.6 μg g−1. Summarily, D-limonene, eucalyptol, linalool and α-terpineol are the major quantified BVOCs among the samples. β-Pinene (11.0 ± 4.5 μg g−1), myrcene (215 ± 12.1 μg g−1), and p-cymene (142 ± 13.1 μg g−1) were only quantifiable in FC#1. D-Limonene and linalool are the two most abundant BVOCs for FC#1, which accounted for 30.2% and 55.9%, respectively, to the total quantified BVOCs. D-Limonene had a contribution of 8.9% for FC#2 and was undetectable for FC#3 and FC#4. Linalool was accounted for 35.8% and 21.3%, respectively, to the total quantified BVOCs in FC#2 and FC#3. α-Terpineol was absent for FC#1 but was the most abundant BVOC for FC#2 (43.0%) and FC#3 (64.4%). Eucalyptol can be determined in both samples, accounting for 5.1 to 16.3% of the total quantified BVOCs. In addition, only eucalyptol and α-terpineol were quantified in FC#4.| Samples | β-Pinene | Myrcene | p-Cymene | D-Limonene | Eucalyptol | Linalool | α-Terpineol | Total | ||||||||
|---|---|---|---|---|---|---|---|---|---|---|---|---|---|---|---|---|
| Mean | S.D. | Mean | S.D. | Mean | S.D. | Mean | S.D. | Mean | S.D. | Mean | S.D. | Mean | S.D. | Mean | S.D. | |
| a nd represents not detectable in sample. | ||||||||||||||||
| FL#1 | 11 | 4.5 | 215 | 12.1 | 142.2 | 13.1 | 1250 | 236.5 | 210 | 50.1 | 2317.2 | 571.6 | nd | — | 4145 | 888 |
| FC#2 | nda | — | nd | — | nd | — | 23.6 | 3.1 | 32.5 | 3.3 | 94.7 | 8.4 | 113.8 | 9.8 | 265 | 24.6 |
| FC#3 | nd | — | nd | — | nd | — | nd | — | 20 | 0.7 | 29.7 | 2.1 | 89.6 | 1.1 | 139 | 3.9 |
| FC#4 | nd | — | nd | — | nd | — | nd | — | 40.7 | 9.6 | nd | — | 208.6 | 28.1 | 249 | 37.7 |
The amounts of BVOCs in the extract were also determined by the simple direct injection method to the GC. The extent agreement in the mass concentrations determined using the two methods could be assessed as simple linear fits. A good correlation (R2 = 0.95) was found between the two methods for individual BVOCs. This demonstrates that the SPME method reports accurate and reliable data in the determination of airborne BVOCs under the standard environments.
4. Conclusions
We have demonstrated the optimization of a SPME method using Carboxen-PDMS fibers to quantify BVOCs with short-term fiber exposure. On the basis of comparison of the results in the determination of mass concentrations in floor cleaner extracts, the BVOCs in a standard atmosphere can be quantified accurately and precisely. The SPME approach enables a simple and rapid measurement, which would be applied for quantification of BVOCs emissions from household cleaning reagents and air refreshers in indoor environments. The data and their interpretation as well as their environmental impacts will be reported in our coming up paper.Acknowledgements
This study is supported by the Research Grant (1-ZV3X) of the Hong Kong Polytechnic University, Research Grants Council of Hong Kong (PolyU 5175/09E), and Chinese Academy of Sciences (KZCX2-YW-BR-10). The authors would like to thank Mr. Tam for his technical support.Reference
- H. Destaillats, M. M. Lunden, B. C. Singer, B. K. Coleman, A. T. Hodgson, C. J. Weschler and W. W. Nazaroff, Environ. Sci. Technol., 2006, 40, 4421–4428 CrossRef CAS.
- W. W. Nazaroff and C. J. Weschler, Atmos. Environ., 2004, 38, 2841–2865 CrossRef CAS.
- J. Ortega and D. Helmig, Chemosphere, 2008, 72, 343–364 CrossRef CAS.
- S. Pressley, B. Lamb, H. Westberg, A. Guenther, J. Chen and E. Allwine, Atmos. Environ., 2004, 38, 3089–3098 CrossRef CAS.
- M. Adam, M. Juklov, T. Bajer, A. Eisner and K. Ventura, J. Chromatogr., A, 2005, 1084, 2–6 CrossRef CAS.
- N. C. Bouvier-Brown, R. Holzinger, K. Palitzsch and A. H. Goldstein, J. Chromatogr., A, 2007, 1161, 113–120 CrossRef CAS.
- J. Nicolle, V. Desauziers and P. Mocho, J. Chromatogr., A, 2008, 1208, 10–15 CrossRef CAS.
- J. Zeng, B. Yu, W. Chen, Z. Lin, L. Zhang, Z. Lin, X. Chen and X. Wang, J. Chromatogr., A, 2008, 1188, 26–33 CrossRef CAS.
- C. Camarasu, C. Madichie and R. Williams, TrAC, Trends Anal. Chem., 2006, 25, 768 CrossRef CAS.
- D. A. Lambropoulou and T. A. Albanis, J. Chromatogr., A, 2003, 993, 197 CrossRef CAS.
- T. Dorothea, B. Wilhelm, H. Armin, L. Francesco, S. R. R. Ursula and S. Jorgg-Peter, Plant J., 2006, 45, 540–560 CrossRef.
- V. Larroque, V. Desauziers and P. Mocho, J. Environ. Monit., 2006, 8, 106–111 RSC.
- F. Vilaplana, M. Martinez-Sanz, A. Ribes-Greus and S. Karlsson, J. Chromatogr. A, 1217, pp. 359–367 Search PubMed.
- B. Wang, S. C. Lee and K. F. Ho, Atmos. Environ., 2006, 40, 7858–7868 CrossRef CAS.
- B. Wang, S. C. Lee, K. F. Ho and Y. M. Kang, Sci. Total Environ., 2007, 377, 52–60 CrossRef CAS.
- G. Ouyang and J. Pawliszyn, J. Chromatogr., A, 2007, 1168, 226–235 CrossRef CAS.
- B. C. Singer, B. K. Coleman, H. Destaillats, A. T. Hodgson, M. M. Lunden, C. J. Weschler and W. W. Nazaroff, Atmos. Environ., 2006, 40, 6696–6710 CrossRef CAS.
- B. C. Singer, H. Destaillats, A. T. Hodgson and W. W. Nazaroff, Indoor Air, 2006, 16, 179–191 CrossRef CAS.
- S. S. H. Ho and J. Z. Yu, J. Chromatogr., A, 2004, 1059, 121–129 CrossRef CAS.
- J. Koziel, M. Jia and J. Pawliszyn, Anal. Chem., 2000, 72, 5178–5186 CrossRef CAS.
- J. C. Miller and J. N. Miller, Statistics for Analytical Chemistry, third edn, Ellis Horwood, 1993 Search PubMed.
- E. Sanchez-Palomo, M. C. Diaz-Maroto and M. S. Perez-Coello, Talanta, 2005, 66, 1152–1157 CrossRef CAS.
| This journal is © The Royal Society of Chemistry 2012 |