A novel method for picoxystrobin determination by flow injection chemiluminescence assistance with ultrasonic treatment
Wang-bing
Zhang
*,
Xin-an
Yang
,
Hai-xia
Zhu
and
Yong-ping
Dong
Department of Applied chemistry, Anhui University of Technology, Maanshan, Anhui 243002, P. R. China. E-mail: zhangwb@ahut.edu.cn; Tel: +86-555-2311807
First published on 23rd November 2011
Abstract
A simple and sensitive flow injection chemiluminescence (FI-CL) method for determination of the fungicide picoxystrobin was described for the first time. Picoxystrobin was injected into the mixed stream of luminol with KMnO4, and the CL signal of picoxystrobin could be greatly improved when an ultrasonic treatment was adopted. Meanwhile, the signal intensity increases with the analyte concentration proportionally. The effects of the ultrasonic conditions including ultrasonic frequency, time, power and temperature on the CL signal have been studied in detail. It was found that the higher the ultrasonic frequency used, the stronger the CL intensity increased. Since the variety of ultrasonic parameters can lead to the fluctuation of signal intensity, the CL mechanism was discussed. Under the optimized conditions, the CL intensity was linear for picoxystrobin concentration over the range of 2–150 ng mL−1 with a 3σ detection limit of 0.27 ng mL−1. The relative standard deviation was 3.9% for 11 consecutive measurements of 20 ng mL−1 picoxystrobin. The method was demonstrated by application to spiked water samples from different origins including river, ground and tap water.
Introduction
As a member of the strobilurin pesticides, picoxystrobin (methyl(E)-3-methoxy-2-{2-[6-(trifluoromethyl)-2-pyridyloxy-methyl]phenyl}acrylate, PC (Fig. 1)) is a broad spectrum fungicide. It has been widely used in cereal crop protection, particularly in wheat, barley and oat crops, because of its powerful biological activity.1 However, the extensive and intensive use of agrochemical compound results in residual amounts of toxic substances, which have been commonly found in food products. Consequently, the European Regulation no. 396/2005 has established the maximum residues levels (MRLs) for PC at 0.05 mg kg−1 for the food groups.2 Hence, the determination of PC is of great importance. | ||
| Fig. 1 The structure of picoxystrobin. | ||
The most often applied analytical method to determine PC residue is a chromatography technique coupled with a different detector, such as gas chromatography,3 liquid chromatography4 and the micellar electrokinetic capillary chromatography (MEKC).5 Recently, some methods based on the use of GC-mass spectrometry (GC-MS)6–11 and LC-MS12–16 have been developed for monitoring the trace of this pesticide in fruits, vegetables and water samples. Also, immunoanalytical methodologies based on the competitive enzyme-linked immunosorbent assay (cELISA) technique17 have been used.
Noticeably, many studies concerning the chemiluminescence (CL) technique for the determination of pesticide residues have been reported during the last few decades. Compared with chromatography or MS, the CL has many merits like low cost, simplicity, and rapidity. Moreover, by choosing different CL systems, catalyst or depressor agents, it is feasible to improve the analytical sensitivity of pesticide residues. For example, by using two consecutive reactions of choline oxidase and peroxidase, Moris et al.18 developed a highly sensitive CL assay for the determination of dimethoate and ethyl parathion. Through the reaction between photodegraded imazalil and ferricyanide in a basic medium, Meseguer-Lloret et al.19 reported a fast and economic CL method for the determinaiton of imazalil in environmental water samples. Based on the reaction of luminol with H2O2 in the presence of a cationic surfactant (cyltrimethylammonium bromide), Wang et al.20 proposed a simple fast chemilumine-scence flow injection (FI) method for the direct determination of dichlorvos in vegetable sample. Using sodium chloride to improve the CL signal, the same method was also used for the determination of monocrotophos in water samples.20 The chlorpyrifos in spiked orange and pomelo samples was detected by the reaction of luminol with potassium periodate.21 Making use of luminol-KMnO4 chemiluminescence system in alkaline medium, García-Campaña et al.22 proposed a simple FI coupling with CL detection for the sensitive determinations of carbaryl and carbofuran in vegetables and different type of waters. By the oxidation of luminol in alkaline medium, using hexacyanoferrate(III) as catalyst/cooxidant and hexacyano-ferrate(II) as depressor, an FI-CL method to determinate some dithiocarbamate fungicides, such as ziram, mancozeb and propineb, was reported by Kubo et al.23 However, we also noted that despite the related reports about determination of pesticide residues with chemiluminescence's method increasing, the measured objects, such as pesticides, herbicides and so on are abundant, but based on CL technology for the determination of PC have still have not been reported.
It was found that PC could greatly enhance emission of the luminol-KMnO4 CL system after ultrasonic treatment. The enhancing effect on the CL intensity is proportional to the concentration of the studied analyte. In this paper, a novel method for PC determination was developed. This method has been applied to determine PC in water sample with satisfactory results. To the best of our knowledge, this is the first report using the CL method to the determination of the fungicide. Furthermore, the possible mechanism was also proposed.
Experimental
Apparatus
An ultrasonic bath instrument (model SG2200HBT, Shanghai Guante Ultrasonic Instrument Co., Shanghai, China) with the temperature control function was used to treat the fungicide. Three ultrasound frequencies of 40, 49, 59 kHz could be selected. CL measurements of PC were carried out with an MPI-F multi-function CL detector (Xi'an Remex Analyse Instrument Co., Ltd., Xi'an, China) in which the photomultiplier tube was operated at −700 V. To validate the feasibility of the proposed method, a high performance liquid chromatography (HPLC) system equipped with a reversed-phase SB-C18 analytical column of 4.6 × 250 mm and UV detector (Agilent series 1200, USA) was used. The relative excitation spectra and emission spectra were recorded using F-4600 fluorescence spectrometer (Hitachi, Japan).Chemical reagents
All reagents were at least analytical grade and solutions were prepared with doubly deionized water (DDW). Luminol (3-aminophthalhydrazide, ≥98.0%, Sigma) was prepared in 0.1 M sodium hydroxide and stored at 4 °C. During the preparation of stock solution (0.1000 g L−1), PC (≥99.5%, Dr Ehrenstorfer, Germany) solid was dissolved in 50% ethanol–water solution because of lower solubility in water. A series of fresh standard solutions (2–150 ng mL−1) were prepared by diluting the stock solution with DDW before use. The stock solution is diluted at least 600 times or more. Ethanol content in the working solution will be less than 0.1% (v/v). Other chemical reagents were all provided by the Chemical Reagent Company of Shanghai (China).River, ground and tap water samples were collected in polyethylene bottles and filtered through 0.45 μm membrane filters to remove the suspended solid and stored at 4 °C in the refrigerator. Prior to analysis, the water samples were spiked with 1 mg L−1 PC standard solution, in order to obtain solutions containing different PC concentrations. These sample and a series standard solutions were placed in the bath and sonicated by the ultrasonic device, then detected by CL.
Analytical procedures
A scheme of the FI-CL system is shown in Fig. 2. The FI configuration used included two peristaltic pumps. One was used to drive the carrier (NaOH) and sample solutions/ethanol–water solution (0.1% v/v) at a flow rate of 3.0 mL min−1. The other was used to deliver luminol and KMnO4 solutions at a flow rate of 1.6 mL min−1. Then, the two mixture solutions were injected to the detection cell simultaneously. In order to reduce the impact of solvent on the detection signal, the relative CL intensity was used, and it was calculated as ΔI = I − I0. I is the intensity of the PC–luminol–KMnO4 system, which is peak height, and I0 was obtained under the same condition with ethanol–water (0.1% v/v) solution instead of PC. Instrument settings and operational parameters used for the experimental FI-CL system are summarized in Table 1.| Parameter | Setting |
|---|---|
| Chemiluminescence | |
| High voltage of PMT/V | −700 |
| Carrier solution concentration (NaOH, mol L−1) | 0.6 |
| Luminol concentration (mol L−1) | 7 × 10⁻⁵ |
| KMnO4 concentration (mol L−1) | 2 × 10⁻⁵ |
| NaOH/sample flow rate (mL min−1) | 3.0 |
| Luminol/KMnO4 flow rate (mL min−1) | 1.6 |
| Ultrasonic Treatment | |
| Frequency (kHz) | 59 |
| Power (W) | 200 |
| Time (min) | 10 |
| T/°C | 50 |
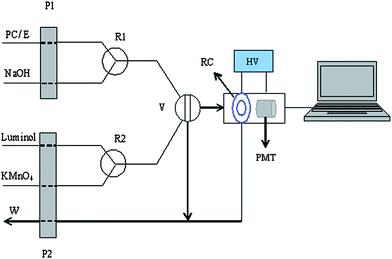 | ||
| Fig. 2 Scheme of the FIA-CL system. E – ethanol solution (0.1% v/v); P1 P2 – pump; R1 R2 – reaction tube; V – eight-port value; RC – reaction cell; W – waste; HV – high voltage; PMT – photomultiplier tube. | ||
As a reference method, a HPLC-UV detector was used in our work. The mobile phase was acetonitrile–water (85![[thin space (1/6-em)]](https://www.rsc.org/images/entities/char_2009.gif) :15), the flow rate was 1.0 mL min−1, the column temperature was 40 °C.
:15), the flow rate was 1.0 mL min−1, the column temperature was 40 °C.
Results and discussion
CL for determination of PC
In order to determine the PC, different oxidant systems were studied. Oxidants including 0.5 mol L−1 H2O2, 5 × 10⁻⁵ mol L−1 K3Fe(CN)6, 2 × 10⁻⁵ mol L−1 KMnO4 and 1 × 10⁻⁴ mol L−1 K2S2O8 were tested, and the results are shown in Fig. 3. It was found that, without UT, PC could slightly improve the CL signal of the above-mentioned oxidants with luminol (7 × 10⁻⁵ mol L−1). The sensitivity was poor. Therefore, direct detection of PC with low concentration by CL method was infeasible. | ||
| Fig. 3 The effect of different oxidations on the CL signal of PC. UT conditions: ultrasonic frequency, temperature, time and power were 59 kHz, 50 °C, 10 min and 200 W, respectively; PC flow rate 3.0 mL min−1; CL regents flow rate 1.6 mL min−1. | ||
However, when ultrasonic treatment (UT) was applied before the PC solution mixing up with oxidant and luminol, it's found that each system has different levels of CL intensity increase, especially the luminol–KMnO4 CL system. The CL signal of PC with UT increased more than 30 times hat of direct detection. Meanwhile, the increase of CL signals showed a good linear relationship with analyte concentration. Hence, determination of PC by the CL method with the assistance of UT was suitable.
Investigation of parameters affecting sonication
To optimize the detection methods, a series of experiments were performed to investigate the effect of changing ranges of variables including sonication frequency, time, power and temperature. | ||
| Fig. 4 Effects of ultrasonic frequency and sonication time on the CL signal of 20 ng mL−1 PC. Ultrasonic power 200 W; temperature 50 °C; PC flow rate 3.0 mL min−1; CL regents flow rate 1.6 mL min−1; concentration of NaOH, luminol and KMnO4 selected as 0.6 mol L−1, 7 × 10⁻⁵ mol L−1 and 2 × 10⁻⁵ mol L−1, respectively. | ||
The effect of sonication time on the CL signal of analyte was also studied in the range of 0∼60 min, and the result is shown in Fig. 4. It illustrated that the CL signal increased proportionally with the sonication time up to 30 min, then increased slightly from 30 to 40 min, and decreased thereafter. On one hand, a shorter UT time would be favorable in terms of improving the analysis speed. On the other hand, the CL signal intensity is increased with the sonication time because more radicals can generate in the sample solution during a longer UT time. Consequently, a compromise condition, 10 min, was chosen. It should also be noted that the higher the ultrasonic frequency applied, the sooner to reach a maximum signal. For example, a frequency of 59 kHz needs 40 min to reach the maximum whiles the frequency of 40 kHz needs 50 min. The reason probably is that the higher the frequency used, the more hydroxyl radicals (·OH) in PC solution were produced,24 which has benefits for the generation of metastable substances.
Comparing to the direct CL determination method, the major problem of this UT method may be how much more time consuming it is. However, the signal intensity of PC by CL detection with UT increased about 30 times. Moreover, the ultrasonic bath device can be simultaneously processing multiple samples resulting in effectively improving the efficiency of the analysis. For example, our ultrasonic device can handle 10 samples simultaneously; each sample is 1 min on average. In batch sample analysis, this time can barely affect the analysis efficiency. So, UT is a good choice for improving the sensitivity of the method, especially for analysis of a large number of samples.
 | ||
| Fig. 5 Effect of ultrasonic temperature on the CL signal of 20 ng mL−1 PC with different ultrasonic frequency application. Ultrasonic power and time are 200 W and 10 min, respectively; PC flow rate 3.0 mol L−1; CL regents flow rate 1.6 mol L−1. | ||
 | ||
| Fig. 6 Effect of ultrasonic power on the CL signal of 20 ng mL−1 PC with different ultrasonic frequency application. Ultrasonic time and temperature are 10 min and 50 °C, respectively; PC flow rate 3.0 mol L−1; CL regents flow rate 1.6 mol L−1. | ||
Discussion on the reaction mechanism
The propagation of ultrasonic waves in a liquid generates cavitation bubbles, which can grow and implode under the periodic variations of the pressure. In aqueous solution, implosion and fragmentation of the bubbles are the center of high-energy phenomena. Temperature, pressure, and electrical discharges give rise to H2O sonolysis, which leads to the production of radical species (·OH) and direct destruction of the solute.26,27 Therefore, the reason that the PC after ultrasonic treatment could greatly improve the signal intensity of the luminol–KMnO4 CL system probably due to three factors; (1) the ·OH from H2O, or (2) the small molecule produced by the PC destruction, and (3) the metastable substances produced from the reaction between PC and ·OH, which give rise to the CL emission.Firstly, reports in the literature claim that the ·OH could increase the CL emission of luminol system in an alkaline solution. A method for the determination of H2O2 by ·OH produced in aqueous media during ultrasonic treatment enhancing luminol CL was reported.28 However, based on the fact that the signal intensity increased proportionally with the PC concentration, we do not agree that the possible reason was directly related to the reaction between ·OH and luminol–KMnO4 CL system. Meanwhile, the ·OH is extremely instable and easily annihilated in the solution.29 As a result, this signal enhancement would disappear quickly when ultrasonic treatment stopped. The duration of signal enhancement was tested and the results are shown in Fig. 7. It was found that the CL signal of PC varied slightly even when the ultrasonic treated solution was tested 20 min later. Hence, we believed that there is a substance existing in the solution after UT, which takes part in the reaction of the CL system. And its concentration is directly related to the concentration of PC.
 | ||
| Fig. 7 Effect of storage time on the CL signal. | ||
Secondly, the HPLC of PC with/without UT was carried out to study the PC destruction. No new peak appears, which indicates that the PC is not destructed under ultrasonic treatment.
Thirdly, the fluorescence spectroscopy of the reaction mixtures—luminol–KMnO4 and luminol–KMnO4–PC with/without UT were scanned by an F-4600 fluorescence spectrometer (Fig. 8). The excitation spectra and emission spectra were similar for the reaction mixtures. The emission wavelength was within the range of 370–900 nm (λem = 415 nm). They were identical with the emission spectrum of 3-aminophthalate ion (3-AP).30 The emission spectra of luminol–KMnO4–PC and luminol–KMnO4 were similar, demonstrating that the PC did not directly participate in the CL reaction of luminol and KMnO4. When PC was treated by ultrasonication and mixed with luminol–KMnO4, it was found that the fluorescence intensity of this system was enhanced more than two times, which suggested that UT might prompt a change in PC. This proved that PC plays an important role in the reaction of luminol–KMnO4.
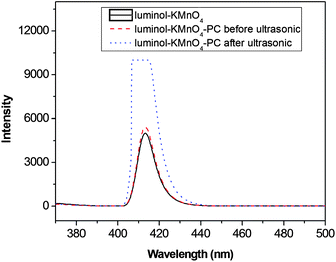 | ||
| Fig. 8 The fluorescent spectra. | ||
Moreover, since PC improved the CL signal of the luminol–KMnO4 CL system slightly without ultrasonic treatment, the reason that the PC after ultrasonic treatment could greatly improve the signal intensity of above-mentioned system was not directly related to the reaction between PC and luminol–KMnO4 CL system.
Based on the above discussion, we deduced that ˙OH generated from H2O sonolysis26–28 can react with PC to form excited PC (PC*).

| ˙OH + PC → PC* + OH− |
Luminol could react with KMnO4 to generate excited state of 3-AP*. When 3-AP* returned to ground state 3-AP, light emission was observed. Then excited PC* could transfer its energy to 3-AP to generate excited 3-AP*. As a result, the CL intensity was enhanced. The similar mechanism of luminol–KMnO4 CL systems was also reported by other work.31
| KMnO4 + luminol → K2MnO4 + 3-AP + hv |
| 3-AP + PC* → 3-AP* + PC |
| 3-AP* → 3-AP + hv |
The transition rate of PC* to ground state was faster under high temperature or high ultrasonic power conditions for long time UT. As a result, more PC* disappeared before it was mixed with CL reagent during the ultrasonic process. Therefore, the CL intensity of luminol–KMnO4–PC apparently decreased under the above-mentioned conditions.
Optimization of instrumental variables
The effect of the sample and CL reagent flow rates on the CL intensity was studied in the range of 0.5–4 mL min−1. The flow rate of CL regents went up from 1.2 to 2.8 mL min−1, the CL signal increased less than 10%. Meanwhile, the CL intensity was increased about 22% with the PC and NaOH flow rate increasing from 1.5 to 3.75 mL min−1. Considering the analysis cost and sensitivity of method, 1.6 mL min−1 and 3.0 mL min−1 were chosen as CL regents and PC/NaOH flow rates.It is well known that the CL signal is proportional to the concentration of luminol. The dependence of the CL intensity on luminol concentration was recorded for 20 ng mL−1 PC, at different luminol concentrations in the range of 1 × 10⁻⁵–8 × 10⁻⁵ mol L−1. The CL intensity still went up remarkably as the concentration of luminol increased, and then it increased slightly when the concentration of luminol was higher than 7 × 10⁻⁵ mol L−1. Therefore, 7 × 10⁻⁵ mol L−1 luminol was chosen.
KMnO4 concentration was also a critical factor. Relative CL signal of PC increased along with KMnO4 concentration varying from 1 × 10⁻⁵ to 2 × 10⁻⁵ mol L−1, then decreased obviously with further increase of the concentration. So, 2 × 10⁻⁵ mol L−1 KMnO4 was chosen in our work.
NaOH is used as carrier solution to transfer the PC to detector. The concentration of NaOH was optimized in the range of 0.1–0.9 mol L−1. The CL intensity increased proportionally with the NaOH concentration from 0.1 to 0.5 mol L−1 for 20 ng mL−1 PC solutions, then increased slightly in the range of 0.5–0.9 mol L−1. Based on these results, 0.6 mol L−1 NaOH was selected as carrier solution.
Study of interferences
The possible interference of the most common ions in water was studied. This study was carried out by preparing 20 ng mL−1 PC standard solutions and salts containing these ions. The obtained signals were tested against a pure solution of PC at the same concentration. The effect is expressed as the change in the presence of interfering ions relative to the interference-free response. A substance was considered not to interfere if it caused a relative change less than 5%. The maximum tolerable concentrations for PC determinations are shown in Table 2.| Species | Concentration (mg L−1) | Concentration ratio [M]/[PC] | Recovery (%) |
|---|---|---|---|
| K(I) | 200 | 10000 |
101 |
| Na(I) | 200 | 10000 |
100 |
| Ca(II) | 200 | 10000 |
98 |
| Zn(II) | 200 | 10000 |
101 |
| Fe(III) | 20 | 1000 | 105 |
| Co(II) | 8 | 400 | 104 |
| 20 | 1000 | 135 | |
| Cu(II) | 20 | 1000 | 105 |
| 50 | 2500 | 147 | |
| Pb(II) | 20 | 1000 | 101 |
| As(III) | 10 | 500 | 97 |
| H2PO4− | 200 | 10000 |
101 |
| CO32− | 200 | 10000 |
103 |
| HCO3− | 200 | 10000 |
95 |
| NH4+ | 100 | 5000 | 98 |
| SO42− | 40 | 2000 | 106 |
| Cl− | 200 | 10000 |
98 |
It can clearly be seen that among the common ions, cobalt and copper cause the most serious interference. The presence of 8 mg L−1 Co2+ in sample solution produced 4% signal enhancement, while 20 mg L−1 can lead to 35% signal enhancement. The presence of 20 mg L−1 Cu2+ in sample solution resulted in 5% enhancement of signal; 50 mg L−1 Cu2+ can lead to 47% signal enhancement. The probably reason is that the Co2+ and Cu2+ have a catalytic effect and enhance the CL signal of the luminol–KMnO4 system. The concentration of Co and Cu in the water sample generally is lower than the interference concentration and ensured that the proposed method could be applied to the determination of PC in water samples.
Analytical performance characteristics
Under the optimized conditions above described and using ultrasonic treatment with the proposed FI-CL manifold, the method was validated for linearity, detection limits and the relative standard deviation. The linear calibration graph was obtained in the range 2–150 ng mL−1 with the linear regression equation: ICL = 23.41 + 78.28Cp. Cp in the equation is the PC concentration (ng mL−1). The regression coefficient R was 0.9992. The detection limit based on three times the standard deviation of the blank (3σ) was 0.27 ng mL−1 for PC. The precisions (RSD) for 11 replicate determinations of 20 ng mL−1 PC was 3.9%.Compared with MS and cELISA, although the sensitivity of the proposed method is not good, however, the CL has a low analytical cost, simplicity, and rapidity not available with the above-mention techniques.
Applications
The proposed method has been applied to the determination of PC in 3 different types of water samples: river, ground water and tap water, all of which were free of the studied pesticides. The reliability of the proposed method was tested with recovery experiments by adding PC standard solutions into the sample solutions. The analytical results are listed in Table 3, and their recoveries are satisfactory. T-tests were performed and no significant difference was found between the HPLC values and obtained values in this work.| Samples | Measured (μg L−1) | Added (μg L−1) | Found (μg L−1) | Recovery (%) | |
|---|---|---|---|---|---|
| by CL | by HPLC | ||||
| a N.D. = not detected. | |||||
| Yangtze river | N.D.a | 25.0 | 23.2 | 24.1 | 93 |
| 50.0 | 48.7 | 48.0 | 97 | ||
| 75.0 | 73.2 | 76.5 | 98 | ||
| Lake water | N.D. | 30.0 | 31.9 | 32.4 | 106 |
| 60.0 | 62.3 | 62.0 | 104 | ||
| 90.0 | 88.9 | 92.5 | 99 | ||
| Tap water | N.D. | 20.0 | 21.4 | 21.0 | 107 |
| 40.0 | 40.6 | 42.3 | 102 | ||
| 80.0 | 78.5 | 83.0 | 98 | ||
Conclusions
A novel FI-CL method coupled with off-line UT assistance for the determination of low levels of fungicide picoxystrobin in water samples has been developed for the first time. Even the detection limit of CL technology is poorer compared with chromatography-MS technology; the advantages of the proposed method are still obvious: (1) greatly improved sensitivity of CL for determination of PC, (2) more simple and effective in analyzing large numbers of environmental samples, and (3) possibility to detect other members of strobilurin pesticides.Because the CL method does not have the ability to distinguish different analytes, the proposed method has not yet been used for the analysis of complex samples. We will work to build on the on-line UT device and detect complex samples combined with the separation technique in the future.
Acknowledgements
This work is supported by the Key project of Scientific Research Foundation sponsored by the Education Department of Anhui Province, China (KJ2010A048), and the Younger Teacher Fund of Anhui University of Technology (QZ200905).Notes and references
- A. Santino, L. Bolzoni and M. Bandini, J. Chromatogr., A, 2004, 1036, 161 CrossRef.
- Regulation (EC) no. 396/2005 of the European Parliament and of the Council, Official Journal of the European Union, 2005, L70, p. 1 Search PubMed.
- E. J. Avramides, C. Lentza-Rizos and M. Mojasevic, Food Addit. Contam., 2003, 20, 699 CrossRef CAS.
- C. Falqui-Cao, Z. Wang, L. Urruty, J. J. Pommier and M. Montury, J. Agric. Food Chem., 2001, 49, 5092 CrossRef CAS.
- F. de Souza Cabrini, L. M. C. da Cunha Alessandra and R. Q. Aucélio, Chromatographia, 2009, 70, 1461 Search PubMed.
- F. J. Arrebolaa, J. L. Martínez Vidala, M. J. González-Rodrígueza, A. Garrido-Frenicha and N. Sánchez Morito, J. Chromatogr., A, 2003, 1005, 131 CrossRef.
- J. W. Wong, M. G. Webster, D. Z. Bezabeh, M. J. Hengel, K. K. Nigm, A. J. Krynitsky and S. E. Ebeler, J. Agric. Food Chem., 2004, 52, 6361 CrossRef CAS.
- D. Štajnbaher and L. Zupančič-Kralj, J. Chromatogr., A, 2003, 1015, 185 CrossRef.
- P. Viňas, N. Campillo, N. Martínez-Castillo and M. Hernández-Córdoba, J. Chromatogr., A, 2009, 1216, 140 CrossRef.
- A. Garrido-Frenich, F. J. Arrebola, M. J. González-Rodríguez, J. L. Martínez Vidal and N. Mora Díez, Anal. Bioanal. Chem., 2003, 377, 1038 CrossRef CAS.
- J. H. Wang, Y. B. Zhang and X. L. Wang, J. Sep. Sci., 2006, 29, 2330 CrossRef CAS.
- M. J. Taylor, K. Hunter, K. B. Hunter, D. Lindsay and S. Le Bouhellec, J. Chromatogr., A, 2002, 982, 225 CrossRef CAS.
- A. Sannino, L. Bolzoni and M. Bandini, J. Chromatogr., A, 2004, 1036, 161 CrossRef CAS.
- C. Soler and Y. Picó, TrAC, Trends Anal. Chem., 2007, 26, 103 CrossRef CAS.
- J. Wang and D. Leung, J. Agric. Food Chem., 2009, 57, 2162 CrossRef CAS.
- M. Mezcua, O. Malato, J. F. García-Reyes and A. Molina-Díaz, Anal. Chem., 2009, 81, 913 CrossRef CAS.
- F. A. Esteve-Turrillas, J. Parra, A. Abad-Fuentes, C. Agulló, A. Abad-Somovilla and J. V. Mercader, Anal. Chim. Acta, 2010, 682, 93 CrossRef CAS.
- P. Moris, I. Alexandre and M. Roger, Anal. Chim. Acta, 1995, 302, 53 CrossRef CAS.
- S. Meseguer-Lloret, S. Torres-Cartas and M. C. Gómez-Benito, Anal. Bioanal. Chem., 2010, 398, 3175 CrossRef CAS.
- J. N. Wang, C. Zhang, H. X. Wang, F. Z. Yang and X. R. Zhang, Talanta, 2001, 54, 1185 CrossRef CAS.
- J. X. Du, X. Y. Liu and J. R. Lu, Anal. Lett., 2003, 36, 1029 CrossRef CAS.
- Z. H. Song, S. Hou and N. Zhang, J. Agric. Food Chem., 2002, 50, 4468 CrossRef CAS.
- J. F. Huertas-Pérez and A. M. García-Campaña, Anal. Chim. Acta, 2008, 630, 194 CrossRef.
- H. Kubo, Y. Tsuda, Y. Yoshimura, H. Homma and H. Nakazawa, Anal. Chim. Acta, 2003, 494, 49 CrossRef CAS.
- T. J. Mason, J. P. Lorimer, D. M. Bates and Y. Zhao, Ultrason. Sonochem., 1994, 1, 91 CrossRef.
- B. Yang, M. M. Zhao, J. Shi, N. Yang and Y. M. Jiang, Food Chem., 2008, 106, 685 CrossRef CAS.
- Y. Y. Zhang, Z. Y. Xiao, F. Chen, Y. Q. Ge, J. H. Wu and X. S. Hu, Ultrason. Sonochem., 2010, 17, 72 CrossRef CAS.
- M. A. Matouq, Z. A. Al-Anber, T. Tagawa, S. Aljbour and M. Al-Shannag, Ultrason. Sonochem., 2008, 15, 869 CrossRef CAS.
- Y. F. Hu, Z. J. Zhang and C. Y. Yang, Ultrason. Sonochem., 2008, 15, 665 CrossRef CAS.
- G. M. Greenway, T. Leelasattarathkul, S. Liawruangrath, R. A. Wheatley and N. Youngvises, Analyst, 2006, 131, 501 RSC.
- Y. H. Li, W. F. Niu and J. R. Lu, Talanta, 2007, 71, 1124 CrossRef CAS.
| This journal is © The Royal Society of Chemistry 2012 |