Optimized conditions for liquid-phase microextraction based on solidification of floating organic droplet for extraction of nitrotoluene compounds by using response surface methodology
Laleh
Adlnasab
a,
Homeira
Ebrahimzadeh
*a and
Yadollah
Yamini
b
aDepartment of Chemistry, Shahid Beheshti University, G.C. Evin, Tehran, Iran. E-mail: h-ebrahim@sbu.ac.ir; Fax: +98 21 22403041; Tel: +98 21 29902891
bDepartment of Chemistry, Tarbiat Modares University, P.O. Box 14115-175, Tehran, Iran
First published on 31st October 2011
Abstract
Solidification of floating organic droplet microextraction (SFODME) method followed by gas chromatography-flame ionization detector (GC-FID) was applied for ultra-preconcentration and determination of nitrotoluene compounds in water samples. The effects of several factors such as volume of organic solvent, sample solution temperature, extraction time, stirring rate and ionic strength were simultaneously investigated on the extraction efficiency using an experimental design. For the first time, quarter fraction factorial design was applied to screening in order to determine the significant factors in the extraction efficiency. Then, central composite design (CCD) was used for the optimization of important factors and the response surface equations were obtained. The optimized conditions were established to be 600 rpm for stirring rate, 30 min for extraction time, 60 °C for extraction temperature, 5 μL for organic solvent volume, and 3% (w/v) of NaCl for ionic strength. Limit of detections (LODs) for the extraction method were in the range of 0.3–0.5 μg L−1. Linear dynamic ranges were in the range of 0.5–200 μg L−1 for three nitrotoluene compounds and the obtained preconcentration factor was in the range of 535–640. The relative standard deviations of the proposed method were 4–10%. Finally, performance of the proposed method was tested for the extraction and determination of the nitrotoluene compounds at microgram per litre levels in samples and satisfactory results were achieved.
Introduction
MNTs (mono nitrotoluenes) are used in the synthesis of intermediates for production of dyes, rubber chemicals, pesticides, drugs, resin modifiers, optical brighteners, suntan lotions, and photographic developing agents. In toluene nitration, three isomers are produced in a ratio of about 58.8% o-nitrotoluene, 36.8% p-nitrotoluene, and 4.4% m-nitrotoluene.1,2Nitrotoluenes (NTs) are toxic compounds in trace levels which are released into the atmosphere and environment from several industrial and chemical manufacturing applications.3,4 So, MNTs determination in various matrices at trace level is of great importance. Therefore, sample pretreatment is an essential analytical step for quantitation of trace levels of these compounds in various matrices.5 Conventional liquid–liquid extraction (LLE) has been the main method for enrichment of nitroaromatic compounds from aqueous solutions.6,7 Although LLE is widely used, it suffers from many disadvantages such as being a labor intensive and time-consuming method which requires the use of large amounts of high-purity solvents.8 Other techniques such as solid-phase extraction (SPE),9,10solid-phase microextraction (SPME),11,12single-drop microextraction (SDME),13 head space solvent microextraction (HSME),14 homogeneous liquid–liquid extraction (HLLE),15hollow-fiber liquid-phase microextraction (HF-LPME),16 dispersive liquid–liquid microextraction (DLLME),17,18 and molecular imprinted polymer extraction-dispersive liquid–liquid microextraction (MIP-DLLME)19 have also been reported for extraction of NTs from different matrices prior to final analysis either by gas chromatography-flame ionization detector (GC-FID) or high-performance liquid chromatography (HPLC). The major disadvantage of SPE is lack of selectivity, leading to co-extraction of matrix interference components with the target analytes. Also, MIP technique needs long extraction times and DLLME is performed with special equipment such as centrifuge and ultrasound instruments.20,21Recently, Khalili Zanjani et al.22 reported a new liquid–liquid microextraction method called solidification of floating organic droplet microextraction (SFODME) which was successfully used for the extraction and determination of polycyclic aromatic hydrocarbons (PAHs). In this method, small volume of an organic solvent with a melting point near room temperature (in the range of 10–30 °C) was floated on the surface of aqueous solution. The aqueous phase was stirred for a prescribed period of time, and then the sample was transferred into the ice bath. When the organic solvent was solidified (about 5 min), it was transferred into a small conical vial, and the melted organic solvent was used for analytes determination. The SFODME is a modified solvent extraction method which has the advantages of simplicity, short extraction time, minimum organic solvent consumption, achievement of high enrichment factor, and being very inexpensive.23–25
Factorial design is the use of factorial experiments instead of the one-factor-at-a-time method. These are efficient at evaluating the effects and possible interactions of several factors (independent variables). In statistics, a central composite design is an experimental design, useful in response surface methodology, for building a second order (quadratic) model for the response variable without needing to use a complete three-level factorial experiment.
In the present study, liquid-phase microextraction method based on SFODME followed by gas chromatography/flame ionization detector was applied for determination of MNTs in water samples. Several factors such as extraction time and temperature, volume of organic solvent, ionic strength and stirring rate were optimized by quarter fraction factorial design for screening and determination of significant factors influencing the extraction efficiency. Then, central composite design (CCD) was used for optimization of important factors and the response surface equations were obtained. Finally, the proposed method was successfully applied to the extraction and determination of these compounds in real samples.
Experimental
Reagents and materials
2-nitrotoluene, 3-nitrotoluene, 4-nitrotoluene, 1-undecanol, methanol and sodium chloride were of the highest purity available from Merck (Darmstadt, Germany). The well and sea water samples were collected from Shahid Beheshti University (Tehran, Iran) and the Caspian Sea, respectively. All of them were kept in polyethylene bottles and stored in dark at 4 °C and analyzed within 48 h after collection with no previous treatments.Preparation of standard solutions
A stock standard solution of the three mentioned nitrotoluenes was prepared in methanol at concentration level of 1000 μg mL−1. The working standard solutions were prepared in ultrapure water. All of these solutions were stored in a fridge (4 °C) and brought to ambient temperature just prior to use.Instrumentation
All of GC analysis was performed on a Finnigan TRACE GC (Waltham, MA, USA) with a flame ionization detector. Separation of nitrotoluenes was carried out using DB-1 fused-silica capillary column with a 30 m × 0.25 mm i.d. and 0.25 μm film thickness from J&W Scientific (Folsom, CA, USA). The GC split ratio was 1![[thin space (1/6-em)]](https://www.rsc.org/images/entities/char_2009.gif) :
:![[thin space (1/6-em)]](https://www.rsc.org/images/entities/char_2009.gif) 10 in which nitrogen gas with high purity (99.999%) was used as carrier gas (flow rate = 1.5 mL min−1). Both of the injector and detector temperatures were held at 270 °C. The column oven was initially held at 60 °C for 4 min and programmed to 200 °C at a rate of 10 °C min−1 and then to 250 °C at 20 °C min−1. For injection, 10 μL Hamilton syringe (Bonaduz, Switzerland) was used. In order to improve the precision and accuracy of the method in all of the experiments, one impurity of the extraction solvent during 20.1 min was selected as the internal standard. The analytical signal was taken as the ratio of analyte peak area to that of the internal standard.
10 in which nitrogen gas with high purity (99.999%) was used as carrier gas (flow rate = 1.5 mL min−1). Both of the injector and detector temperatures were held at 270 °C. The column oven was initially held at 60 °C for 4 min and programmed to 200 °C at a rate of 10 °C min−1 and then to 250 °C at 20 °C min−1. For injection, 10 μL Hamilton syringe (Bonaduz, Switzerland) was used. In order to improve the precision and accuracy of the method in all of the experiments, one impurity of the extraction solvent during 20.1 min was selected as the internal standard. The analytical signal was taken as the ratio of analyte peak area to that of the internal standard.
SFODME procedure
Eight millilitres of the aqueous sample solution containing the nitrotoluene compounds was transferred into an 11-mL vial. About 5 μL of the organic solvent (1-undecanol) was floated on the surface of sample solution using a 10 μL Hamilton syringe (Bondaduz, Switzerland) and stirred with an 8 mm × 4 mm magnetic stirring bar for 30 min at 60 °C at 600 rpm. After extraction, the vial was transferred into an ice bath and the organic solvent was solidified during 5 min. The solvent was then transferred to a conical vial and allowed to melt. Afterwards, one microlitre of the melted organic solvent was directly injected to GC using a 10-μL Hamilton syringe (Bondaduz, Switzerland) for analysis.Optimization strategy
In the present method, several factors such as sample solution temperature, volume of organic solvent, extraction time, stirring rate and ionic strength influence the extraction process. Experimental design based on quarter fraction design was performed to screen the variables and obtain the optimum conditions with saving time.After selecting the significant factors, CCD was used to study the interaction among variables. Analysis of variance (ANOVA) was used to evaluate the model and to obtain response surface methodology (RSM). All of the experiments were designed by StatGraphics plus 5.1 package.
Results and discussion
In this work, the SFODME followed by GC-FID was applied for extraction of MNTs from water samples. The effects of several factors such as sample solution temperature, volume of organic solvent, extraction time, stirring rate and ionic strength were investigated. Optimized conditions were obtained by screening design, and then central composite design was used for the evaluation of the interaction among factors.Several solvents such as 1-dodecanol, 1-undecanol, cyclohexanol, dodecan and dodecanol were checked for obtaining maximum extraction. 1-undecanol was chosen as the extracting solvent because it is immiscible with aqueous solution and its density is lower than water. Also, it has a high boiling-point to avoid solvent loss during extraction, a melting-point near room temperature (10–30 °C) for melting, and a suitable chromatographic behavior.
Screening design
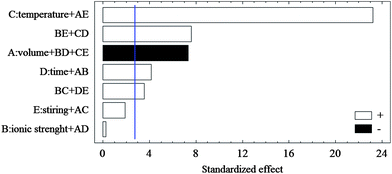
In the present method, screening designs were performed in order to obtain the significant variables. Quarter fraction factorial design was used for the screening step. At least five factors including the volume of organic solvent, ionic strength, solution temperature, extraction time and stirring rate might affect the experimental response. The levels of factors selected based on previous studies are provided in Table 1. The overall design matrix showed 8 runs plus 4 runs in center point to be carried out randomly in order to minimize the effect of unexplained variability in the observed responses due to systematic errors. The ANOVA result was used to evaluate the main effects. Only one chart was chosen as a representative example of the analytes because of similar results for the three compounds. The standard effect was estimated for computing a t-statistic for each effect. The vertical line on the plot (Fig. 1) shows the effects that are statistically significant. The bars, extending beyond the line, correspond to the effects that are statistically significant at the 95% confidence level.| Factors | Level | Level | |
|---|---|---|---|
| Low | High | ||
| Volume of organic solvent (μL) | A | 5 | 10 |
| Ionic strength (w/v, %) | B | 0 | 3 |
| Sample solution T/°C | C | 25 | 60 |
| Extraction time (min) | D | 15 | 30 |
| Stirring rate (rpm) | E | 100 | 600 |
 | ||
| Fig. 1 Pareto charts of the main effects obtained from the quarter fraction factorial design; A: solvent volume; B: ionic strength; C: temperature extraction; D: time extraction; E: stirring rate. AE, BE, CD, BD, CE, AB, BC, DE, AC and AD are the interaction effects between solvent volume and stirring rate, ionic strength and stirring rate, temperature and extraction time, ionic strength and extraction time, temperature and stirring rate, solvent volume and ionic strength, ionic strength and temperature, extraction time and stirring rate, solvent volume and temperature, solvent volume and time extraction, respectively. | ||
According to Fig. 1, temperature was the most significant factor with a positive effect on the extraction efficiency of all analytes. The next important negative significant variable was volume of extraction solvent. Extraction time was the third important variable with positive effect. Also, stirring rate and ionic strength had non-significant positive effects on the extraction efficiency. Higher stirring rates increased mass transfer to organic solvent. Due to salting-out effect, increasing the salt content of solution improves the extraction efficiency in the majority of extraction methods. Based on the results of the first screening study, to continue the optimization, two variables were fixed at suitable levels (stirring rate: 600 rpm; and NaCl concentration: 3% (w/v)).
Optimization design
According to screening design, the three factors (temperature, volume of extraction solvent, and extraction time) were chosen as the significant factors. The influence of selected parameters on calculation of the relative area was evaluated by a central composite design. The levels of the selected factors are provided in Table 2.| Factors | Level | Star points (α = 1.682) | |||
|---|---|---|---|---|---|
| Lower | Central | Upper | −α | +α | |
| A: extractionT/°C | 25 | 42.5 | 60 | 13.1 | 71.9 |
| B: organic solvent volume (μL) | 5 | 7.5 | 10 | 3.3 | 11.7 |
| C: extraction time (min) | 15 | 22.5 | 30 | 9. 9 | 35.1 |
This design permitted the response to be modeled by fitting a second-order polynomial, which can be expressed as the following equation:
| y = β0 + β1x1 + β2x2 + β3x3 + β12x1x2 + β13x1x3 + β23x2x3 + β11x21 + β22x22 + β33x23 |
 | ||
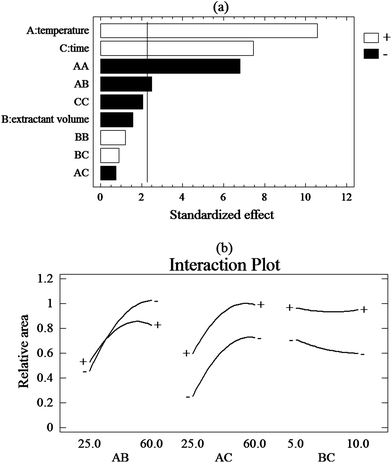
| Fig. 2 (a) Pareto charts of the main effects obtained from the central composite design: AA, BB and CC are the quadratic effects of the temperature extraction, extractant volume and extraction time, respectively. AB, BC and AC are the interaction effects between temperature and extractant volume, extractant volume and extraction time, temperature and extraction time, respectively; (b) interaction plot. | ||
 | ||
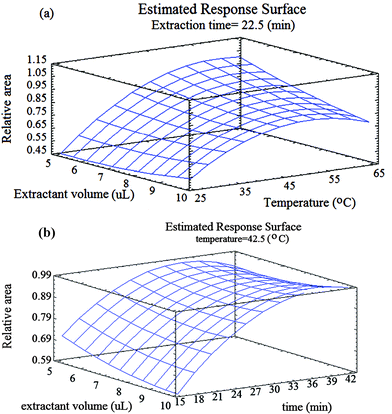
| Fig. 3 Response surfaces for MNTs using the central composite design obtained by plotting of: a) the extraction solvent volume vs. the extraction temperature; b) the extraction solvent volume vs. the extraction time. | ||
In the CCD design, the quadratic term of temperature (AA) and interactions between the temperature/volume of solvent (AB) had a significant effect on the extraction efficiency. Also, the interaction plot confirms the existence of a significant positive interaction between the extractant solvent/temperature and other insignificant interactions between factors as shown in Fig. 2B. Besides, the quadratic term of extraction time (CC) and volume of solvent (BB) and interactions between the volume/time and temperature/time have an insignificant effect on the extraction efficiency. Fig. 3 shows the response surface plot for interaction between the temperature and extractant solvent for the relative area. This interaction has negative significant influence on extraction. At temperatures higher than optimum and at lower volumes, solvent is perhaps dispersed in aqueous solution such that collecting the solvent is hard. Also, in lower temperatures and greater solvent volume, the driving force is decreased.
According to the overall results of the optimization study, the following experimental conditions were chosen: temperature, 60 °C; extraction time, 30 min; solvent volume, 5 μL.
Method performance
To evaluate the practical applicability of the proposed method, the figures of merit of this method including calibration curve, limit of detection (LOD), limit of quantification (LOQ), precision, accuracy, correlation coefficient (R2), preconcentration factor (PF), and recovery were investigated under the best conditions as listed in Table 3.| Analyte | Regression equation | R 2 | LOD (μg L−1) | DLR (μg L−1) | PF |
|---|---|---|---|---|---|
| 2-nitrotoluene | Y = 0.2956 X − 0.0865 | 0.998 | 0.3 | 0.5–200 | 572 |
| 3-nitrotoluene | Y = 0.2626 X − 0.0528 | 0.998 | 0.3 | 0.5–200 | 640 |
| 4-nitrotoluene | Y = 0.2280 X − 0.0982 | 0.994 | 0.5 | 1–200 | 535 |
LOD was determined using equation 3Sb/m; where Sb is the standard deviation of the blank signal and m is the slope of calibration curve after extraction which was in the range of 0.3–0.5 μg L−1. Correlation coefficient of the method was >0.99 for each of the three MNT compounds.
Extraction efficiency (EF) and preconcentration factor were calculated using the following equations:
| EF = (CorgVorg/Caq,initialVaq) × 100 |
| PF = (Corg/Caq) |
In order to calculate the preconcentration factors for the above-mentioned compounds, five-replicate extractions were conducted for solutions containing 25 μg L−1 of the MNT compounds. It was found that under optimal conditions, preconcentration factors in the range of 535–640 can be reached.
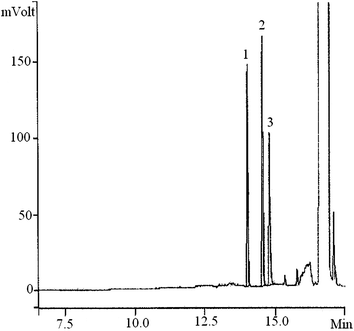
The efficiency of the proposed method was evaluated by determining the MNT compounds in well and sea water of Shahid Beheshti University (Tehran, Iran) and the Caspian Sea (Iran), respectively. According to the results, the two kinds of real water studied were MNT-free. These samples were spiked with the standard solution at different concentration levels to examine the matrix effects. The chromatogram of the sea water sample after the extraction with proposed method is illustrated in Fig. 4. The results of three-replicate analysis of each sample were obtained using the SFODME method of the spiked aqueous MNTs and are provided in Table 4 with satisfactory agreement.
 | ||
| Fig. 4 Chromatogram of the sea water sample (25 μg L−1 of MNT compounds) after extraction under the best conditions; (1) 2-nitrotoluene; retention time = 13.98 min, (2) 3-nitrotoluene; retention time = 14.62 min, (3) 4-nitrotoluene; retention time = 14.88 min. | ||
| Sample | Analyte | C added (μg L−1) | C found (μg L−1) | Relative standard deviation (%) | Recovery (%) |
|---|---|---|---|---|---|
| Well water | 2-nitrotoluene | 25 | 23.1 | 5.7 | 92.4 |
| 3-nitrotoluene | 25 | 23.9 | 4.1 | 95.6 | |
| 4-nitrotoluene | 25 | 22.7 | 6.8 | 90.8 | |
| Sea water | 2-nitrotoluene | 25 | 23.3 | 8.1 | 93.2 |
| 3-nitrotoluene | 25 | 22.9 | 9.8 | 91.6 | |
| 4-nitrotoluene | 25 | 22.4 | 9.1 | 89.6 |
Conclusion
In the proposed method, liquid-phase microextraction method based on SFODME followed by gas chromatography/flame ionization detector was demonstrated as a powerful tool for determination of trace levels of MNTs in wastewater samples. Several factors including the extraction time and temperature, volume of organic solvent, ionic strength and stirring rate were effective on extraction efficiency. Experimental design was applied for optimization of the factors. First, quarter fraction factorial design was used to determine the significant factors influencing the extraction efficiency. Afterwards, CCD was employed for optimization of important factors and the response surface equations were obtained. The main benefits of the system are its being environmentally friendly, rapid, and easy to use with no need for special equipment, as well as minimum organic solvent consumption, rejection of matrix constituent, low cost, and high preconcentration factor. Furthermore, this method can be directly performed with all chromatographic instruments with no need for dilution.References
- P. H. Groggins (Ed.), Unit Processes in Organic Synthesis, 5th ed., McGraw Hill, New York 1958 Search PubMed.
- R. Boopathy, C. F. Kulpa and J. Manning, Bioresour. Technol., 1998, 63, 81 CrossRef CAS.
- C. M. Peres and S. N. Agathos, Biotechnol. Annu. Rev., 2000, 6, 197 CrossRef CAS.
- P. Li, W. Yin, P. Li, X. Li, C. Zhang, F. Stagnitti and X. Xiong, J. Hazard. Mater., 2010, 182, 787 CrossRef CAS.
- Y. Saito, I. Ueta, M. Ogawa, M. Hayashida and K. Jinno, J. Pharm. Biomed. Anal., 2007, 44, 1 CrossRef CAS.
- SW-846, Method 8330 Nitroaromatics & Nitramines by High Performance Liquid Chromatography (HPLC), US Environmental Protection Agency, Office of Solid Waste and Emergency Response, Washington, DC 1994 Search PubMed.
- T. F. Jenkins, M. E. Walsh, P. H. Miyares, A. D. Hewitt, N. H. Collins and T. A. Raney, Thermochim. Acta, 2002, 384, 173 CrossRef CAS.
- I. Liska, J. Chromatogr., A, 2000, 885, 3 CrossRef CAS.
- M. E. Walsh, T. A. Raney, Determination of Nitroaromatic, Nitramine, and Nitrate Ester Explosives in Water using SPE and GC-ECD; Comparison with HPLC, Special Report 98–2, US Army Cold Regions Research and Engineering Laboratory, Hanover, NH 1998 Search PubMed.
- R. L. Marple and W. R. Lacourse, Talanta, 2005, 66, 581 CrossRef CAS.
- A. Gaurav, K. Malik and P. K. Rai, J. Hazard. Mater., 2009, 172, 1652 CrossRef CAS.
- J. Pörschmann, L. Blasberg, K. Mackenzie and P. Harting, J. Chromatogr., A, 1998, 816, 221 CrossRef.
- E. Psillakis and N. Kalogerakis, J. Chromatogr., A, 2001, 907, 211 CrossRef CAS.
- H. Ebrahimzadeh, Y. Yamini, F. Kamarei and M. Khalili-Zanjani, Talanta, 2007, 72, 193 CrossRef CAS.
- H. Ebrahimzadeh, Y. Yamini, F. Kamarei and S. Shariati, Anal. Chim. Acta, 2007, 59, 93 CrossRef.
- Y. Liu and B. Shi, Sep. Purif. Technol., 2009, 65, 233 CrossRef CAS.
- H. Ebrahimzadeh, Y. Yamini and F. Kamarei, Talanta, 2009, 79, 1472 CrossRef CAS.
- H. R. Sobhi, A. Kashtiaraya, H. Farahani, M. Javaheri and M. R. Ganjali, J. Hazard. Mater., 2010, 175, 279 CrossRef CAS.
- H. Ebrahimzadeh, H. Abedi, Y. Yamini and L. Adlnasab, J. Sep. Sci., 2010, 33, 3759 CrossRef CAS.
- M. C. Hennion, J. Chromatogr., A, 1999, 856, 3 CrossRef CAS.
- A. N. Anthemidis and K. G. Ioannou, Talanta, 2003, 80, 413 CrossRef.
- M. R. Khalili Zanjani, Y. Yamini, S. Shariati and J. A. Jonsson, Anal. Chim. Acta, 2007, 585, 286 CrossRef CAS.
- L. Adlnasab, H. Ebrahimzadeh, Y. Yamini and F. Mirzajeni, Talanta, 2010, 83, 370 CrossRef CAS.
- S. Dadfarnia, A. M. Salmanzadeh and A. M. H. Shabani, Anal. Chim. Acta, 2008, 623, 163 CrossRef CAS.
- H. Farahani, P. Norouzi, R. Dinarvand and M. R. Ganjali, J. Sep. Sci., 2009, 32, 314 CrossRef CAS.
- Q. X. Zhou, H. H. Bai, G. H. Xie and J. P. Xiao, J. Chromatogr., A, 2008, 1177, 43 CrossRef CAS.
| This journal is © The Royal Society of Chemistry 2012 |
