DOI:
10.1039/C0SM00855A
(Paper)
Soft Matter, 2011,
7, 137-146
Phase behavior of graft copolymers in concentrated solution
Received
25th August 2010
, Accepted 9th September 2010
First published on 9th October 2010
Abstract
The phase behavior of graft copolymers dissolved in a graft-selective solvent was studied by using self-consistent field theory. The effects of polymer concentration and molecular architecture, i.e., the number of junctions and the position of the first junction on the phase behavior were investigated. Phase diagrams were mapped out according to the calculation results. The detailed studies on the microstructures revealed that the graft copolymers can have either a local crosslinked structure or a global crosslinked structure, yielding a vital material for reversible physical gels. In addition, the density distributions and bridging fractions were calculated to understand the filling of solvents and packing of graft copolymers in the ordered structures of the gels. The understanding of the microstructures of graft copolymers in concentrated solution provides useful information for designing high-performance gels.
1 Introduction
Graft copolymers have attracted considerable attention because of their unique molecular architectures as well as their promising applications such as for coating and adhesive films.1–3 It is well established that the graft copolymers can self-assemble into classical microstructures, such as lamella, gyriod, hexagonally packed cylinders, and body-centered cubic spheres,4–10 as a consequence of microphase separation between backbones and graft arms. Within these microstructures, the continuous backbones provide the opportunities for the bridged chain conformations which combine different graft arm domains. The network resulted from bridged conformations can be applied to many structure designs. One application is that, when the network of graft copolymers is exposed to solvent, it is possible to generate a reversible physical gel in concentrated solution.11 On the grounds of this consideration, the interest of the present work turns to the study of the graft copolymers in concentrated solutions, based on our previous works.6,12–14
For two-component graft copolymers, the solvent is always selective due to different characteristics of the graft arms and the backbone. The solvent thus prefers to exist in the domain of one species rather than the other. This preference results in the formation of various microstructures, for example, micro-aggregates and physical gels. In addition, the particular architectures of graft copolymers also have an effect on the microstructures self-assembled from the copolymer/solvent system. Therefore, understanding the role of the solvent is important for clarifying the phase behavior of graft copolymer solutions. However, there are only limited studies on this issue. For example, Nagahama et al. have investigated the phase behavior of poly(depsipeptide-co-lactide)-g-poly(ethylene glycol) (PDG-DL-LA-g-PEG) copolymers in aqueous solution.15 Their concerns are focused on the sol–gel transitions. It was found that the sol–gel transition temperatures are greatly dependent on the concentration and the molecular architecture. In the theoretical study aspect, progress is less developed for explaining the phase behavior of graft copolymers in concentrated solution. Since graft copolymers have many influencing factors that determine their architectures, including the length of backbone, the length of graft arms, and the distribution of graft arms, a wide variation in hydrophobic–hydrophilic balance can be achieved and tuned to design the character of the systems. Due to their limited nature, the experiments can only give a narrow scope of the phase behavior of the graft copolymers in solution. Therefore, a comprehensive theoretical study is needed to provide a deep insight into the phase behavior of the graft copolymers in solution, and further guide the experimental studies.
SCFT (self consistent field theory) has emerged as a powerful tool to study the equilibrium thermodynamic features of polymer melts and concentrated polymer solutions.16–26 Drolet and Fredrickson have developed a numerical approach to solve the SCFT equations implemented in real space.4,27–30 Real-space SCFT is a highly expedient method for the study of copolymer phase behavior. The calculations can start from either random potential fields without a prior assumption about the mesophase symmetry27 or a deterministic initial field possessing symmetry of order phases for accurate calculation of free energy.31,32SCFT calculations for a blend can be performed in either the canonical ensemble or the grand-canonical ensemble.17,26,33 The combination of these two ensembles has a number of advantages on calculating the phase boundaries of the ordered phases and the two phase coexistence. The canonical algorithm is more stable because the volume fraction of each component is fixed, while the grand-canonical ensemble is more convenient to locate the two phase coexistence especially when the coexistence is narrow.26 In our group, SCFT has been successfully used to study graft copolymers, including bridged chain conformation, phase behavior, and aggregate morphologies in dilute solution.6,12,13 In this work, we focus on the phase behavior of graft copolymers in concentrated solution which people have not investigated yet.
The purpose of present work is to study the phase behavior of graft copolymers in a graft-selective solvent, particularly in concentrated solutions. SCFT performed in both canonical and grand-canonical ensembles was applied in this study. Phase diagrams were mapped out to understand the influence of polymer concentration on phase behavior. In addition, the effect of first junction positions and junction numbers on the microstructures was also investigated. The results revealed that these microstructures are essentially crosslinked due to the continuous nature of the backbone, and thereby the systems can be used to design reversible physical gels. With this consideration in mind, bridging fractions were calculated to gain insight into the degree of crosslinking, which could be related to the mechanical properties of the physical gels.
2 Theory
We consider an incompressible blending system with volume V containing nG graft copolymersAB and nSsolvent molecules S. Each copolymer is comprised of a flexible homopolymerA backbone along which m flexible homopolymerB graft arms are spaced. The position of ith graft arm located at τi is given by| |  | (1) |
The copolymers are assumed to be monodisperse with a statistical length of a. The degrees of polymerization of the A and B chains are NA and NB, respectively. Thus, the total degree of polymerization of graft copolymer NG is equal to NA + mNB. The volume fractions of A-type and B-type monomers of each copolymer chain are respectively denoted fA and fB. The volume fraction of graft copolymers in solution is cP and that of the solvent is 1 − cP.
Within the mean-field theory, the configurations of a single copolymer chain and the solvent are determined by a set of effective chemical potential fields wK(r) (K = A, B, S), replacing actual interactions within the solution. These potential fields are conjugated to the density field ϕK(r). We invoke an incompressibility (ϕA(r) + ϕB(r) + ϕS(r) = 1) by introducing a Lagrange multiplier ξ(r). For a graft copolymer solution, in the canonical ensemble, the free energy (in units of kBT), Fc, is given by
| |  | (2) |
and in the grand-canonical ensemble, the free energy (in units of
kBT),
Fgc, is
| |  | (3) |
where
z ![[triple bond, length as m-dash]](https://www.rsc.org/images/entities/char_e002.gif)
exp(
μ/
kBT), and
μ is the chemical potential.
Here, QS is the partition function for a solvent in the field wS(r), and is given by
| |  | (4) |
Q
G = ∫drqA(r,1) is the partition function for a single non-interacting, grafted chain subject to the fields wA(r) and wB(r) in terms of backbone propagator qA(r,s). The contour length s increases continuously from 0 to 1 as the block changes from one end of the chain to the other. The spatial coordinate r is in units of RA, where R2A = NAa2/6.
The backbone propagator is divided into m + 1 segments
| | qA(r,s) = q(j)A(r,s)for τj ≤ s<τj![[thin space (1/6-em)]](https://www.rsc.org/images/entities/char_2009.gif) + +![[thin space (1/6-em)]](https://www.rsc.org/images/entities/char_2009.gif) 1j = 0,1,…,m 1j = 0,1,…,m | (5) |
where each segment satisfies the modified diffusion equation
| |  | (6) |
and is subject to the following initial conditions:
| | | q(j)A(r,τj) = q(j−1)A(r,τj)qB(r,1) j = 1,2,…,m | (7) |
Here, qB(r,s) is a propagator for B graft that satisfies the following modified diffusion equation:
| |  | (9) |
and is subject to the initial condition
qB(
r,0) = 1 for the free end of the graft at
s = 0. We also define a back-propagator of the
jth
B chain,
qBj+ (
r,
s). It satisfies
eqn (9) and starts on the end of the
B chain tethered to the backbone. It is therefore subject to the initial condition
| |  | (10) |
In terms of these propagators, the densities are obtained by simple integration. They are obtained from
| |  | (11) |
| |  | (12) |
| |  | (13) |
in the canonical ensemble and from
| |  | (14) |
| |  | (15) |
| |  | (16) |
in the grand-canonical ensemble.
Finally, the minimization of the free energy F with respect to ϕA(r), ϕB(r), ϕS(r), and ξ(r) leads to the set of mean-field equations
| | | wA(r) = χABNGϕB(r)+χASNGϕS(r) + ξ(r) | (17) |
| | | wB(r) = χABNGϕA(r)+χBSNGϕS(r) + ξ(r) | (18) |
| | | wS(r) = χASNGϕA(r)+χBSNGϕB(r) + ξ(r) | (19) |
| | | ϕA(r) + ϕB(r) + ϕS(r) = 1 | (20) |
Next, we briefly describe the calculation method that determines the bridged and looped conformations of the backbones. Following the approach of Matsen34 and our previous work,12 we first evaluate the partition function,
| |  | (21) |
for the
A backbone with its
ith junction constrained to the first unit cell
D1. For example, for cylinders with an
A-forming matrix, the first unit cell
D1 can be obtained by performing a Voronoi tessellation with respective to the center of a cylindrical domain. The distribution can be now propagated by solving
eqn (6) as the initial condition at
s =
τi up to
s =
τi![[thin space (1/6-em)]](https://www.rsc.org/images/entities/char_2009.gif) +
+![[thin space (1/6-em)]](https://www.rsc.org/images/entities/char_2009.gif) 1
1. The fraction of looped conformation,
fi, where the blocks between the
ith junction and the (
i + 1)th junction have both ends in the cell
D1, is given by
35| |  | (22) |
The average looped fraction, floop, for the cellD1 is then obtained as
| |  | (23) |
The fraction of bridged conformation can be given by fbridge = 1 − floop. An average value of fbridge can be evaluated by repeating the calculation for all cells and calculating an arithmetic average.
To solve the SCFT equations, we used a variant of the algorithm developed by Fredrickson and co-workers.27–30 The diffusion equations were solved with the Baker–Hausdorff operator splitting formula proposed by Rasmussen et al.36,37 To accurately determine the stable state and phase boundaries, we then start calculations from a deterministic initial field constructed from functions proportional to harmonics for the structures including the lamellar, hexagonally packed cylindrical, body-centered spherical, and bicontinuous gyriod phases.31,32,38,39 The stable structures are obtained by exhaustively comparing the free energy of the computed structures with the free energies of other structures. Because the regions of two phase coexistence are narrow in the phase diagram, it is difficult to map out these regions by calculating the free energies in canonical ensemble. Therefore, the free energies were equated in grand-canonical ensemble around the phase boundaries which were calculated in canonical ensemble, to obtain the two phase coexisting solutions.
All of the simulations were carried out in three dimensions. The spatial resolution Δx is set to be smaller than 0.10RA. It was found that the free energy of the system can be well converged to a stable value when Δx is smaller than 0.10RA. Contour step sizes for the A backbone and B graft arms were set at 0.01. The numerical simulations proceeded until the relative free energy difference was smaller than 10−6 and the incompressibility condition was achieved. Adjustment of the box size was used to minimize the free energy, as suggested by Bohbot-Raviv and Wang.40 The box size corresponding to the lowest free energy upon convergence was chosen as the most appropriate one.
3 Results and discussion
As previous studied, the graft copolymer can self-assemble into aggregates such as vesicles and micelles in dilute solution.6 In the present work, we focused on another region where the solutions are in the concentrated state, by taking advantage of SCFT. SCFT was used to study the effect of polymer concentration on the phase behavior of graft copolymer solutions, and the corresponding phase diagrams were mapped out. Furthermore, detailed information such as density distribution and bridging fraction was analyzed to understand the role of polymer concentration in the ordered structures.
In the simulations, the polymerization degree of the graft copolymer NG is assumed to be 40, and the volume fraction fA of the backbone in each graft copolymer is taken to be 0.70. The backbone is hydrophobic to solventS with χASNG = 56.0, while the graft arm is hydrophilic to solventS with χBSNG= −4.0. In addition, the interaction strength between the backbone and graft arms is set to be χABNG = 40.0.
3.1 Phase diagram
Fig. 1 shows phase diagrams in relation to the first junction position and polymer concentration for the graft copolymer/solvent systems with m = 2 (Fig. 1a) and m = 3 (Fig. 1b). The phase diagrams contain four characteristic zones: a solvent-rich disordered phase (Dis1), a microphase (lamella, gyroid, cylinder, and sphere), a polymer-rich disordered phase (Dis2), and two phase coexistence (2Φ). When the volume fraction of polymer is very small, the graft copolymer is dissolved in solvent and a disordered solution rich in solvent is formed (Dis1). As the volume fraction of polymer increases, the two phase coexistence region (2Φ) is formed. In this 2Φ region, aggregates with various microstructures such as micelles and vesicles appear. The detailed studies of the aggregates are reported in our previous work.6 As polymer concentration continues to increase, the diagram shows a microphase region. Ordered microstructures are formed in this region, on which we mainly focus. This microphase consists of lamellae, gyroids, cylinders, and spheres. The 2Φ phases appear between the adjacent ordered phases, and these two phase coexistence regions are smaller in contrast with the ordered phases. After passing a narrower 2Φ region, further increasing the concentration, a disordered solution rich in polymer emerges due to weak segregation of the graft copolymers (Dis2). In the microphase region, when the polymer concentration cP is small, the graft copolymer solution allows the possibility of forming reverse structures, such as gyroids, GA, cylinders, CA, and spheres, SA. In these microstructures, the backbones are occupied in the minor domains, although the blocks of the backbone are the major component in the polymer. When the polymer concentration cP becomes larger, the graft copolymers in solution form ordered microstructures such as spheres, SB, cylinders, CB, and gyroids, GB, where the backbones form the continuous matrix and the grafts form the minor domains. Lamellar microstructures are found between GA and GB phases.
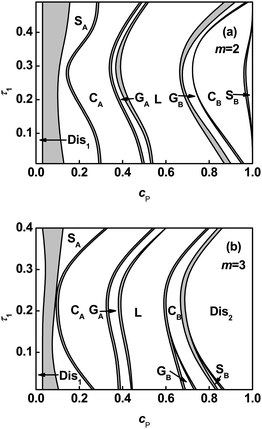 |
| | Fig. 1 Phase diagrams in τ1–cP space for ABgraft copolymers with m = 2 (a) and m = 3 (b) in solution. The ordered regions are denoted as S (body-centered cubic spheres), G (bicontinuous gyroid), C (hexagonally packed cylinders), and L (lamellae). The subscripts A and B in S, G, and C denote that the minority domains of ordered structure are formed by A and B blocks, respectively. The notes Dis1 and Dis2 refer to solvent-rich disordered phase and polymer-rich disordered phase, respectively. The light gray regions represent the region of two phase coexistence (2Φ). | |
From the phase diagram, it is noted that the phase boundaries in the microphase show marked shifts: first to the left and then to the right as the τ1 value increases. In the region of smaller τ1, with increasing τ1, the boundaries tend to shift toward small values of cP. On the contrary, increasing τ1 gives rise to a shift toward larger values of cP in the region of larger τ1. In the region of intermediate τ1, the effect of τ1 on the boundaries is not significant. This behavior can be rationalized by considering the stretching energy of the chains.13 As can be seen from Fig. 1a and 1b, the regions of ordered structures and phase boundaries also have a marked change as the junction number increases 2 to 3.
Since junction number exerts a marked effect on the phase behavior, phase diagrams in junction number m versuspolymer concentration cP plane were also plotted at various τ1 values. Fig. 2 illustrates phase diagrams for graft copolymers with τ1 = 0.1 and τ1 = 0.3. As shown in Fig. 2, the ordered region is shrunk with increasing m value due to dramatic enlargement of the polymer-rich disordered phase region. It can be attributed to the lower entropy of graft copolymer originated from the increasing of junction constraint.26 The phase boundaries of L–2Φ–GB, GB–2Φ–CB, CB–2Φ–SB, and SB–2Φ–Dis2 shift towards smaller values of cP as junction number m increases. The phase boundaries of CA–2Φ–GA and GA–2Φ–L show a unique characteristic. The boundaries first shift toward smaller cP values, then turn to larger cP values, and finally shift to smaller cP values as m increases when τ1 = 0.1(Fig. 2a). However, when τ1 = 0.3(Fig. 2b), the boundaries of CA–2Φ–GA and GA–2Φ–L shift toward larger values of cP as m increases from 2 to 4, and then toward smaller cP values as m further increases to 5.
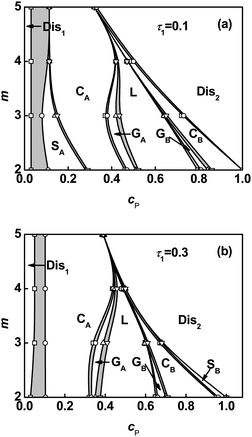 |
| | Fig. 2 Phase diagrams in m–cP space for ABgraft copolymers with τ1 = 0.1 (a) and τ1 = 0.3 (b) in solution. Labels appear as in Fig. 1. | |
In our previous work,13 we investigated the phase behavior of graft copolymer melts. It was found that the ordered phase transition of SA→CA→GA→L→GB→CB→SB occurs as volume fraction of graft arms decreases and a unique shift of phase boundary takes place as the position of the first junction changes (first to the left and then to the right as the value of τ1 increases). Comparing with the present phase diagrams (Fig. 1 and Fig. 2) it is found that, in the concentrated solution, the decrease of the solvent volume fraction acts in a manner that corresponds qualitatively to the decrease of the volume fraction of grafts in bulk. This can be due to the fact that solvents behave as the fillers of grafts in concentrated solutions.
3.2 Density distribution
As stated above, solvents act as the fillers of graft arms in the ordered phase. However, how the solvents fill in the space of graft arms and further influence the distribution of graft copolymers under different molecular architectures is unknown. To address this question, we examined the density distributions of solvent, backbone, and graft arms for graft copolymer solutions. Fig. 3 shows the volume fraction profiles in a lamellar phase of graft copolymer with m = 2 and τ1 = 0.1 at various polymer concentrations cP. The deviation of volume fraction profiles is ΔϕK = ϕK − ![[small phi, Greek, macron]](https://www.rsc.org/images/entities/i_char_e0d6.gif) K, where
K, where ![[small phi, Greek, macron]](https://www.rsc.org/images/entities/i_char_e0d6.gif) is the average volume fraction of component K (K = A, B, S). As shown in Fig. 3a, the solvents prefer to be distributed in the centers of B graft arm domains. It was found that the local deviation in solvent volume fraction in the center of B domains decreases with increasing polymer concentration. Fig. 3b shows the density distributions of B graft arms. When the polymer concentration is high, the density profile of B blocks has almost a plateau in the center regions. As the polymer concentration decreases, a cave in the center and two protrusions near the interface appear due to the increased amount of solvent in the center of the graft arm domains. In addition, the local deviation of A volume fraction in the center of its domains shows a decrease as the polymer concentration increases (Fig. 3c).
is the average volume fraction of component K (K = A, B, S). As shown in Fig. 3a, the solvents prefer to be distributed in the centers of B graft arm domains. It was found that the local deviation in solvent volume fraction in the center of B domains decreases with increasing polymer concentration. Fig. 3b shows the density distributions of B graft arms. When the polymer concentration is high, the density profile of B blocks has almost a plateau in the center regions. As the polymer concentration decreases, a cave in the center and two protrusions near the interface appear due to the increased amount of solvent in the center of the graft arm domains. In addition, the local deviation of A volume fraction in the center of its domains shows a decrease as the polymer concentration increases (Fig. 3c).
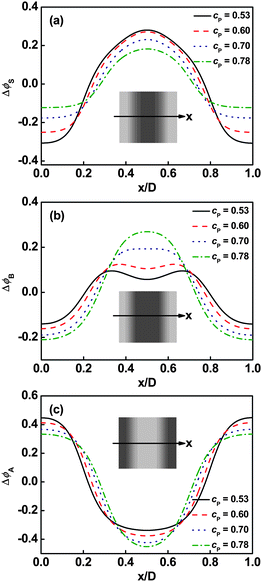 |
| | Fig. 3 Deviation of volume fraction profiles Δϕ for Ssolvent (a), B blocks (b), and A blocks (c) on a cross section of the lamellar phase marked with an arrow in the inset at m = 2 and τ1 = 0.1. The inserts show the two-dimensional density distributions of Ssolvent (a), B graft arms (b), and A backbone (c). The colors ranging from black to gray in the inserts represent the densities from higher to lower. | |
When the molecular architecture is varied, the graft copolymer distributions are also changed under the effect of the solvent. Fig. 4 shows the effect of the position of first junction τ1 on the density distributions in the lamellar phase. As shown in Fig. 4a, the A block distributions are slightly broader at the intermediate value of τ1 (0.30) relative to that at larger (0.45) or smaller (0.01) values, indicating the segregation between A domains and swollen B domains (B and S) are weaker at intermediate τ1 values. A cave and two protrusions in B graft arm distribution curves were observed at smaller or larger τ1 values due to the repulsion of solvent in the center of the B domains. However, plateau distribution is found at the intermediate τ1 value (see Fig. 4b). This is due to the fact that the influence of solvent becomes less marked when the graft copolymer solutions are weakly segregated (τ1 = 0.30). The solvent distributions are also affected by τ1. The local deviation of solvent volume fraction in the center of B domains shows a slight decrease with increasing τ1 from 0.01 to 0.3 and then turns to increase as τ1 increases from 0.3 to 0.45 (see Fig. 4c).
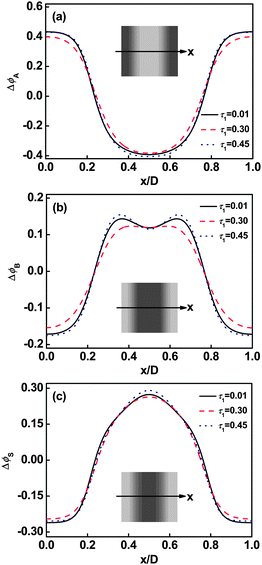 |
| | Fig. 4 Deviation of volume fraction profiles Δϕ for A blocks (a), B blocks (b), and Ssolvents (c) on a cross section of the lamellar phase marked with an arrow in the inset at m = 2 and cP = 0.6. The inserts show the two-dimensional distributions of A backbone (a), B graft arm (b), and Ssolvents (c). The colors ranging from black to gray in the inserts represent the densities from higher to lower. | |
The effect of the junction number on the density distribution is further examined. A representative result of the dependence of the deviation of volume fraction profiles Δϕ in cylindrical phase CA on m is shown in Fig. 5. As shown in Fig. 5a, with increasing m, the A distributions are broader and the local deviations of volume fraction in the center of its domains are decreased. For the deviations of B volume fraction, when m is small, a cave in the center and two protrusions near the interface are clearly viewed (Fig. 5b). However, when m is large, the protrusions in B distribution become flat and the nearly homogeneous B distribution was observed. It is attributed to weak segregation of the graft copolymer which results from the decreasing in the average interaction strength χABN/m,13,26 as the value of m increases. The weak segregation of graft copolymer leads to the broad distributions of A and B blocks in solution when m is larger. Moreover, the solvent distributions are also broader and the local deviation of volume fraction in the center of B domains decreases as m increases, which is shown in Fig. 5c.
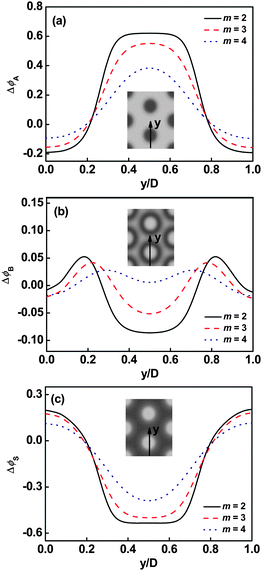 |
| | Fig. 5 Deviation of volume fraction profiles Δϕ for A blocks (a), B blocks (b), and Ssolvent (c) on a cross section of the cylindrical phase marked with an arrow in the inset at τ1 = 0.1 and cP = 0.3. The inserts show the two-dimensional density distributions of A backbone (a), B graft arm (b), and Ssolvents (c). The colors ranging from black to gray in the inserts represent the densities from higher to lower. | |
3.3 Domain spacing
Domain spacing is also used to characterize the packing of graft copolymers and the filling of solvents. The results of the dependence of the domain spacing on the architecture parameter are presented in Fig. 6. Fig. 6a shows domain size D/aNA1/2 as a function of polymer concentration for graft copolymers with m = 2 at different values of τ1. The periods of the lamellar phase, gyroid phase, cylindrical phase, and spherical phase respectively are D, 61/2D, (4/3)1/2D, and (3/2)1/2D (D is the period of lamella, the size of the unit cell, the spacing between cylinders, and the spacing between the spheres, respectively). For each structure, the domain spacing tends to decrease with increasing polymer concentration, implying that the filling of solvents in graft arm domains increases the domain spacing. In addition, the domain sizes relatively decreases as τ1 increases from 0.10 to 0.30. Fig. 6b illustrates the effect of junction number on the domain size D/aNA1/2. It is shown that a decrease in the domain size takes place as the junction number m increases. The variations of τ1 and m values lead to the change of backbone asymmetry and thus the domain size. Furthermore, varying the polymer concentration is somewhat similar to changing volume fraction of graft arms.
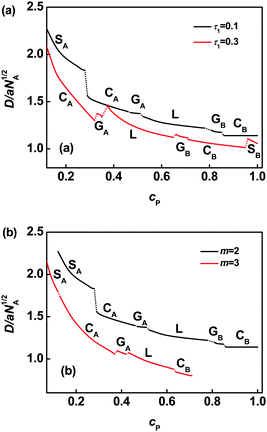 |
| | Fig. 6 Characteristic domain size D/aNA1/2 as a function of cP for graft copolymers with m = 2 (a) and τ1 = 0.10 (b) in solution. Labels appear as in Fig. 1. The dash lines are drawn to link the solid lines when the graft copolymer solution is in the two phase coexistence state. | |
3.4 Bridging fraction
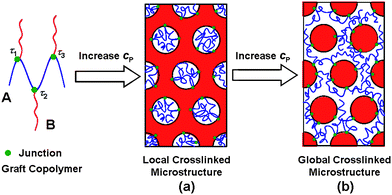
Owing to the architectural characteristic of graft copolymers, the backbone can provide an association in the system. When the backbone occupies the minor domains, the graft copolymers form a local crosslinked structure with a connected core in swollen matrix, as shown in the scheme in Fig. 7a. The local crosslinked structures can be regarded as physical gels.15 Formation of such physical gels is supported by some experimental evidence. Nagahama et al. prepared a series of graft copolymers composed of hydrophilic poly(ethylene glycol) side-chains and a hydrophobic poly(depsipeptide-co-lactide) backbone (PDG-DL-LA-g-PEG).15 When the graft copolymers are dissolved in water, physical gels can be observed above a certain concentration. This is well in line with our prediction. As can be seen in Fig. 7a, the graft copolymers form physical gels when they are in concentrated solutions. The work of Nagahama et al. also suggests that the gels have hydrophobic PDG-DL-LA cores with hydrophilic PEG shells extended outside. The structural features of these physical gels are consistent with our theoretical predictions. As shown in the insets of Fig. 5, the hydrophobic backbone forms local crosslinked cores surrounded by swollen graft polymers, and simultaneously pack into an ordered structure that was observed in the experiments. In addition to these agreements with the experimental data, we predicted some behavior which have not yet been found. For example, the gel can separate into various microstructures, such as lamellae, cylinders, spheres, etc., and the order–order transitions occur with increasing polymer concentration. These findings may provide a useful guidance for the further experimental observations.
With increasing graft copolymer concentration, a global crosslinked structure is formed, where the backbone exists in the matrix, as shown in Fig. 7b. The global crosslinking gives rise to a network, and thus a conventional polymer gel is formed. Crosslinking is the main feature of gels, and determines the properties such as mechanical properties and rheological behavior.11 Therefore, it is important to understand the crosslinking in the global gels. As previous stated,12 the backbone of graft copolymer can take chain conformations including tangles, loops whose junctions localize in the same domain, and bridges whose junctions are anchored to different interface. In these conformations, only the bridged conformation makes contributions to global crosslinking. Therefore, the bridging fractions were calculated to clarify the structure of global crosslinked gels. Fig. 8 shows the equilibrium bridging fraction fbridge plotted as function of the polymer concentration with m = 2. Typical results, for lamellar, cylindrical, and spherical structures, are presented. As the polymer concentration increases, the bridging fraction decreases slightly for each ordered structures. This implies that the effect of solvent on bridging fraction is less marked. In addition, the bridging fraction decreases with increasing τ1.
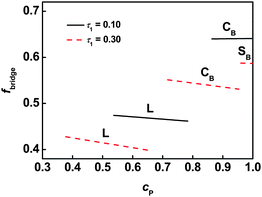 |
| | Fig. 8 Bridging fraction fbridge as a function of the polymer concentration cP for graft copolymer with m = 2 in solution. | |
The bridging behavior can be further viewed in Fig. 9a where fbridge is plotted against the first graft position τ1 for graft copolymers with m = 2. It can be seen that fbridgeversus τ1 has a slow drop over the range 0.01 ≤ τ1 ≤ 0.33, and a rapid drop as τ1 increases beyond 0.33 within a given ordered phase. The bridging fraction in the cylindrical phase (cP = 0.96) is larger than that in the lamellar phase (cP = 0.60). It is said that in phase CB with smaller domain size, the backbone chains can take the bridging conformation more easily than when in phase L with larger domain size. As shown in Fig. 9b, the bridging fraction for gels decreases with increasing junction number at the same polymer concentration. This is because increasing the junction number shortens the block length between neighbor junctions on the backbone.
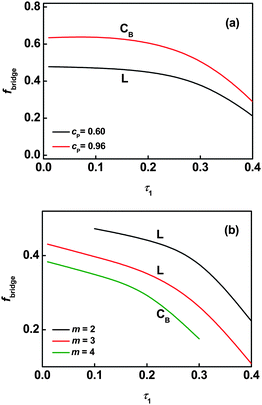 |
| | Fig. 9 Bridging fraction fbridge as a function of the position of the first junction τ1 in the lamellar phase (cP = 0.60) and the cylindrical phase (cP = 0.96) for graft copolymers with m = 2 (a). Bridging fraction fbridge as a function of the position of the first junction τ1 in the lamellar phase (m = 2 and 3) at cP = 0.60 and the cylindrical phase (m = 4) at cP = 0.48 for graft copolymer solutions (b). | |
In general physical gels, such as the gels formed by triblock copolymers, each molecular chain can only provide a two-domain connection because the molecule only contains two crosslink points.41–43 The particular feature of graft copolymer gels is that the backbone of graft copolymer consists of multiple junctions, which can offer a multipoint connection more than two domains. Thus, a question arises about the maximum number of domains to which a single backbone is capable of connecting. To address this question, we calculated the possible junction point distributions in ordered phases. Fig. 10 shows a representative result obtained for the CB phase with m = 4. We first determined the distribution of the first junction that is confined to a single minority B domain (0). This result is displayed in Fig. 10a. The associated second junction distribution was then obtained by propagating that of the first junction (Fig. 10b). The bridges are formed, which starts from (0) domain and ends in other adjacent domains such as the (1), (2), and (3) domains. The third junction distribution was calculated with the second junctions confined to domain (1) (green frame in Fig. 10b), as shown in Fig. 10c. It was found that the third junctions appeared in the (2) and (6) domains as well as back to the (0) domain and the (1) domain itself. The forth junction can also be propagated from the third junctions confined in domain (2) (blue frame in Fig. 10c). The forth junction can exist in the new domain of (7) except for (0), (1), and (2) itself (Fig. 10d). These results indicate: the maximum number of the domains that a single backbone is able to connect is four and a possible conformation for the backbones to link four different domains is in the sequence of (0)–(1)–(2)–(7), as sketched in Fig. 10d. However, the volume fraction of forth junction in the (7) domain is much lower, suggesting that the probability of simultaneously linking four distinct domains is small.
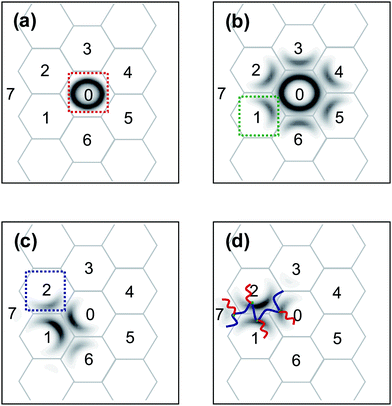 |
| | Fig. 10 Density plots of the first junction distributions that confined to a particular minority B domain (a), the second junction distributions (b) with the first junction confined in the domain (0) marked with the red frame shown in (a), the third junction distributions (c) with the second junction confined in the domain (1) marked with the green frame shown in (b), and the forth junction distributions (d) with the third junction confined in the domain (2) marked with the blue frame shown in (c) for a cylindrical structure at m = 4, cP = 0.48, and τ1 = 0.1. In (d), a possible conformation that the backbone links four different domains is sketched. | |
To further understand the crosslinking behaviors in the ordered structures, we calculated the probabilities of forming the bridged conformations that can respectively attach two, three, and more different swollen graft arm domains (ndomains), for each molecule. Fig. 11 shows a typical result for CB phases. Obviously, the probabilities decrease as ndomains increases. For m = 4, it is almost impossible to link four different domains, suggesting that the backbone of graft copolymer is hard to take the complete bridged conformations. In addition, the increase in the value of τ1 shows a marked effect on the decrease in the probability of bridges to link three domains. This means that the decrease in τ1 is helpful for improving the total crosslinking. From the results of Fig. 10 and Fig. 11, we learned that for the CB phase a single backbone is easy to connect three adjacent domains such as (0), (1) and (2) but difficult to connect an additional domain such as (7). The possibility of a graft copolymer chain simultaneously linking the three adjacent domains and other nearby domains is low.
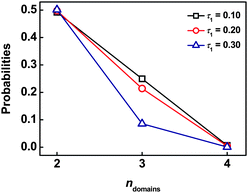 |
| | Fig. 11 Probabilities of simultaneously forming bridged connection for two, three, and four swollen B domains (ndomains) with m = 4 and cP = 0.48 (for each backbone chain). | |
The graft copolymers have attracted considerable attention because of their unique molecular architectures as well as their promising applications in various fields. The backbones of the graft copolymer in the gel provide the opportunities for the bridged chain conformation which combines different graft arm domains, resulting in various special usages such as enhanced mechanical properties. Our calculation results revealed that the graft copolymers can have either a local crosslinked structure or a global crosslinked structure in concentrated solution. The molecular architecture and polymer concentration exert a profound effect on the microstructures. So far the theoretical understanding of the gel structure is limited, and most concern block copolymers such as linear multiblock copolymers which are capable of forming gels. Only very limited theoretical work is available for the phase behavior of the graft copolymers in concentrated solution. In comparison with the linear multiblock copolymers, the graft copolymers exhibit distinct advantages: 1) the microstructures of the linear multiblock copolymers always have global bridges, whichever component occupies the major domains. However, the graft copolymer chain can take either local bridged or global bridged conformation depending on the molecular architecture and polymer concentration. Therefore, the graft copolymer gel could have more controllable properties. 2) Comparing with the linear multiblock copolymers, the graft copolymers possess many more dangling graft arms, which are useful for further functionalization through connecting special chemical groups to the end of graft arms. This property is important in the applications in biomedical fields.
The unique characteristics of backbones can also be used to design more advanced materials, such as multicompartment physical gels, (the concept originated from the triblock copolymer gels44) by attaching two or more dissimilar types of graft arms to the backbone. In such kind of gels, the backbones are forced to bridge two different types of micelles due to the mutually incompatible graft arms. Relative to present gel systems, the bridging fractions can be dramatically increased, resulting in an improvement of mechanical properties and rheological behavior. Additionally, introducing two mutual types of graft arms to the graft copolymers could enrich the microstructures of gels, thereby contributing to functional applications, for example, delivering simultaneously two drugs. The importance of the present work is that it not only helps us understand the nature of graft copolymer in concentrated solution but also offers useful information for designing high-performance gels.
4 Conclusions
We have studied the phase behavior of graft copolymers in a selective solvent using the self-consistent field theory. The influence of polymer concentration and molecular architectures was studied. Phase diagrams were mapped by comparing the free energy of different structures. It is found that the region of ordered phases is dependent on the architecture parameters (τ1 and m), and regions of two phase coexistence appear between adjacent phases. When the polymer concentration increases, a sequence of Dis1→ SA→CA→GA→L→GB→CB→SB→Dis2 transitions, conjoined with two phase coexistence existed between two adjacent phases, was observed. In these phase transitions, the structures transform from local crosslinking to global crosslinking, exhibiting an interesting character related to physical gels. The detailed information regarding microscopic structures, including density distributions, domain size, and bridging fraction, was also reported for various molecular architectures. It was found that the graft copolymers can provide an opportunity for multi-point crosslinking due to the fact that the backbone consists of multiple junctions, which may be helpful to enhance the mechanical properties of the physical gels, relative to widely-used physical gels such as triblock copolymer gels.
Acknowledgements
This work was supported by National Natural Science Foundation of China (50925308). Support from Projects of Shanghai Municipality (09XD1401400, 0952nm05100, B502, and 08DZ2230500) are also appreciated.
References
- N. Hadjichristidis, M. Pitsikalis, H. Iatrou and S. Pispas, Macromol. Rapid Commun., 2003, 24, 979 CrossRef CAS.
- A. J. Ryan, Nat. Mater., 2002, 1, 8 CrossRef CAS.
- M. B. Runge, S. Dutta and N. B. Bowden, Macromolecules, 2006, 39, 498 CrossRef CAS.
- D. M. Patel and G. H. Fredrickson, Phys. Rev. E: Stat., Nonlinear, Soft Matter Phys., 2003, 68, 051802 CrossRef.
- K. H. Kim, S. H. Kim, J. Huh and W. H. Jo, J. Chem. Phys., 2003, 119, 5705 CrossRef CAS.
- L. Zhang, J. Lin and S. Lin, J. Phys. Chem. B, 2007, 111, 9209 CrossRef CAS.
- O. V. Borisov and E. B. Zhulina, Macromolecules, 2005, 38, 2506 CrossRef CAS.
- D. J. Pochan, S. P. Gido, S. Pispas, J. W. Mays, A. J. Ryan, J. P. A. Fairclough, I. W. Hamley and N. J. Terrill, Macromolecules, 1996, 29, 5091 CrossRef CAS.
- C. Lee, S. P. Gido, M. Pitsikalis, J. W. Mays, N. B. Tan, S. F. Trevino and N. Hadjichristidis, Macromolecules, 1997, 30, 3732 CrossRef CAS.
- M. Xenidou, F. L. Beyer, N. Hadjichristidis, S. P. Gido and N. B. Tan, Macromolecules, 1998, 31, 7659 CrossRef CAS.
- F. Lafleche, D. Durand and T. Nicolai, Macromolecules, 2003, 36, 1331 CrossRef CAS.
- L. Zhang, J. Lin and S. Lin, J. Phys. Chem. B, 2007, 111, 351 CrossRef CAS.
- L. Zhang, J. Lin and S. Lin, J. Phys. Chem. B, 2008, 112, 9720 CrossRef CAS.
- L. Zhang, J. Lin and S. Lin, Soft Matter, 2009, 5, 173 RSC.
- K. Nagahama, Y. Imai, T. Nakayama, J. Ohmura, T. Ouchi and Y. Ohya, Polymer, 2009, 50, 3547 CrossRef CAS.
- S. F. Edwards, Proc. Phys. Soc., 1965, 85, 613 CrossRef CAS.
- K. M. Hong and J. Noolandi, Macromolecules, 1981, 14, 727 CrossRef CAS.
- J. D. Vavasour and M. D. Whitmore, Macromolecules, 1992, 25, 5477 CrossRef CAS.
- X. Ye, T. Shi, Z. Lu, C. Zhang, Z. Sun and L. An, Macromolecules, 2005, 38, 8853 CrossRef CAS.
- X. Ye, X. Yu, Z. Sun and L. An, J. Phys. Chem. B, 2006, 110, 12042 CrossRef CAS.
- D. Kou, Y. Jiang and H. Liang, J. Phys. Chem. B, 2006, 110, 23557 CrossRef CAS.
- P. Chen, H. Liang and A.-C. Shi, Macromolecules, 2007, 40, 7329 CrossRef CAS.
- J. Ma, X. Li, P. Tang and Y. Yang, J. Phys. Chem. B, 2007, 111, 1552 CrossRef CAS.
- F. Xu, T. Li, J. Xia, F. Qiu and Y. Yang, Polymer, 2007, 48, 1428 CrossRef CAS.
- Y. Jiang, T. Chen, F. Ye, H. Liang and A.-C. Shi, Macromolecules, 2005, 38, 6710 CrossRef CAS.
- M. W. Matsen, Macromolecules, 2003, 36, 9647 CrossRef CAS.
- F. Drolet and G. H. Fredrickson, Phys. Rev. Lett., 1999, 83, 4317 CrossRef CAS.
- F. Drolet and G. H. Fredrickson, Macromolecules, 2001, 34, 5317 CrossRef CAS.
- V. Ganesen and G. H. Fredrickson, Europhys. Lett., 2001, 55, 814 CrossRef CAS.
- G. H. Fredrickson, V. Ganesan and F. Drolet, Macromolecules, 2002, 35, 16 CrossRef CAS.
- E. W. Cochran, C. J. Garcia-Cervera and G. H. Fredrickson, Macromolecules, 2006, 39, 2449 CrossRef CAS.
-
G. H. Fredrickson, The Equilibrium Theory of Inhomogeneous Polymers, Oxford University Press, Oxford, 2006 Search PubMed.
- M. W. Matsen, Phys. Rev. Lett., 1995, 74, 4225 CrossRef CAS.
- M. W. Masten and R. B. Thompson, J. Chem. Phys., 1999, 111, 7139 CrossRef CAS.
- K. Ch. Daoulas, D. N. Theodorou, A. Roos and C. Creton, Macromolecules, 2004, 37, 5093 CrossRef CAS.
- G. Tzeremes, K. Ø. Rasmussen, T. Lookman and A. Saxena, Phys. Rev. E: Stat., Nonlinear, Soft Matter Phys., 2002, 65, 041806 CrossRef CAS.
- K. Ø. Rasmussen and G. Kalosakas, J. Polym. Sci., Part B: Polym. Phys., 2002, 40, 1777 CrossRef CAS.
- L. Leibler, Macromolecules, 1980, 13, 1602 CrossRef CAS.
- M. Wohlfemuth, N. Yufa, J. Hoffman and E. L. Thomas, Macromolecules, 2001, 34, 6083 CrossRef CAS.
- Y. Bohbot-Raviv and Z.-G. Wang, Phys. Rev. Lett., 2000, 85, 3428 CrossRef CAS.
- R. E. Bras and K. R. Shull, Macromolecules, 2009, 42, 8513 CrossRef CAS.
- M. E. Seitz, W. R. Burghardt and K. R. Shull, Macromolecules, 2009, 42, 9133 CrossRef CAS.
- M. S. Shim, H. T. Lee, W. S. Shim, I. Park, H. Lee, T. Chang, S. W. Kim and D. S. Lee, J. Biomed. Mater. Res., 2002, 61, 188 CrossRef CAS.
- R. R. Taribagil, M. A. Hillmyer and T. P. Lodge, Macromolecules, 2009, 42, 1796 CrossRef CAS.
|
| This journal is © The Royal Society of Chemistry 2011 |
Click here to see how this site uses Cookies. View our privacy policy here. 


![[triple bond, length as m-dash]](https://www.rsc.org/images/entities/char_e002.gif) exp(μ/kBT), and μ is the chemical potential.
exp(μ/kBT), and μ is the chemical potential.

![[thin space (1/6-em)]](https://www.rsc.org/images/entities/char_2009.gif) +
+![[thin space (1/6-em)]](https://www.rsc.org/images/entities/char_2009.gif) 1j = 0,1,…,m
1j = 0,1,…,m![[triple bond, length as m-dash]](https://www.rsc.org/images/entities/char_e002.gif) 0 τm
0 τm![[thin space (1/6-em)]](https://www.rsc.org/images/entities/char_2009.gif) +
+![[thin space (1/6-em)]](https://www.rsc.org/images/entities/char_2009.gif) 1
1 ![[triple bond, length as m-dash]](https://www.rsc.org/images/entities/char_e002.gif) 1
1


![[thin space (1/6-em)]](https://www.rsc.org/images/entities/char_2009.gif) +
+![[thin space (1/6-em)]](https://www.rsc.org/images/entities/char_2009.gif) 1. The fraction of looped conformation, fi, where the blocks between the ith junction and the (i + 1)th junction have both ends in the cellD1, is given by35
1. The fraction of looped conformation, fi, where the blocks between the ith junction and the (i + 1)th junction have both ends in the cellD1, is given by35


![[small phi, Greek, macron]](https://www.rsc.org/images/entities/i_char_e0d6.gif) K, where
K, where ![[small phi, Greek, macron]](https://www.rsc.org/images/entities/i_char_e0d6.gif) is the average volume fraction of component K (K = A, B, S). As shown in Fig. 3a, the solvents prefer to be distributed in the centers of B graft arm domains. It was found that the local deviation in solvent volume fraction in the center of B domains decreases with increasing polymer concentration. Fig. 3b shows the density distributions of B graft arms. When the polymer concentration is high, the density profile of B blocks has almost a plateau in the center regions. As the polymer concentration decreases, a cave in the center and two protrusions near the interface appear due to the increased amount of solvent in the center of the graft arm domains. In addition, the local deviation of A volume fraction in the center of its domains shows a decrease as the polymer concentration increases (Fig. 3c).
is the average volume fraction of component K (K = A, B, S). As shown in Fig. 3a, the solvents prefer to be distributed in the centers of B graft arm domains. It was found that the local deviation in solvent volume fraction in the center of B domains decreases with increasing polymer concentration. Fig. 3b shows the density distributions of B graft arms. When the polymer concentration is high, the density profile of B blocks has almost a plateau in the center regions. As the polymer concentration decreases, a cave in the center and two protrusions near the interface appear due to the increased amount of solvent in the center of the graft arm domains. In addition, the local deviation of A volume fraction in the center of its domains shows a decrease as the polymer concentration increases (Fig. 3c).


