Effect of flexoelectricity and order electricity on defect cores in nematic droplets
Tine
Porenta
*a,
Miha
Ravnik
ab and
Slobodan
Zumer
acd
aFaculty of Mathematics and Physics, University of Ljubljana, Jadranska 19, 1000, Ljubljana, Slovenia. E-mail: tine.porenta@fmf.uni-lj.si
bRudolf Peierls Centre for Theoretical Physics, University of Oxford, 1 Keble Road, Oxford, OX13NP, United Kingdom
cJ. Stefan Institute, Jamova 39, 1000, Ljubljana, Slovenia
dCenter of Excellence NAMASTE, Jamova 39, 1000, Ljubljana, Slovenia
First published on 11th October 2010
Abstract
Macroscopic polarization, induced in a strongly deformed nematic director field, is shown to strongly affect the stability of defect structures. We present a numerical study which addresses the role of flexoelectricity and order electricity in confined nematic liquid crystals, more specifically in nematic droplets with planar and homeotropic surface anchoring. Electrostatic potential induced by flexo- and order electricity are calculated in the droplets taking into the account full anisotropy of the nematic director profile. Potentials as high as 1 V are found in 200 nm droplets with flexoelectric constant e = 40 pC m−1. Spatial profiles of contributions to the total free energy are calculated to identify flexo- and order elasticity relevant regions. For different flexoelectric coupling strengths and different anchoring strengths, changes in the core of the defects are examined. Their stability is discussed. Finally, flexo- and order electricity driven transitions between point defect, ring defect and axial structure are demonstrated in homeotropic droplets.
Long ago, Meyer indicated that distortions in the nematic director field can induce macroscopic polarization.1 Two mechanisms are possible. The first effect, called flexoelectricity, is analogous to piezoelectricity in solid crystals. Asymmetric molecules (pear-like or banana-like) with permanent dipole moment orientationally order into specific splay or bend deformation modes and thus effectively produce macroscopic electric polarization of the medium. The second mechanism is order electricity2 where polarization arises from variation in nematic order. Both, deformation of nematic field and variations in nematic order, induce macroscopic electric polarization capable of inducing electric potential in the distorted regions. New bismesogenic and bent-core materials were synthesised,3 with flexoelectric coefficient comparable or even higher as the elastic coefficient opening routes for novel structures in nematic liquid crystals. Recently, flexoelectric effect in this materials was shown to stabilise blue phases and strongly widen their temperature range.4,5
Effects of the flexoelectricity are typically small in absence of external fields, but become of importance in confined geometries, such as nematic droplets. Flexoelectric polarization is induced by splay and bend elastic deformation of director field and is given by gradients of director field. Consequently, the electric potential induced by flexoelectricity is largest in strongly deformed regions of nematic director, like liquid crystal defects. Changes in director caused by electric field induced via flexoelectricity could also profoundly affect resonant Whispering Gallery modes in recently discovered optical resonators of nematic droplets.6
In a nematic droplet, confining surface leads to formation of defects, as it imposes a net non-zero topological charge inside the droplet. The magnitude of topological charge in a spherical droplet is one, therefore, topology limits the number of types of defects that can exist in the droplet. Planar anchoring imposed at the surface of droplet gives a nematic structure with two boojum surface defects at the opposite poles. (Fig. 1a). If radial (perpendicular) anchoring is imposed, three structures can form: radial hedgehog, ring defect and axial structure with ring defect formed on the waist of the droplet (Fig. 1b, c, d). The split core defect7 structure was not stable in our simulations. A closer look at the structure with a ring defect and radial hedgehog structure shows the characteristic splay and bend deformations susceptible to flexoelectricity, whereas the axial structure lacks elastic deformation in nematic profile to induce substantial flexoelectric polarization. Note that no twist deformation is present in the considered structures. Sub-micrometre nematic droplets can be to a good approximation assumed to be spherical, as their shape is primarily determined by the surface tension. Estimating surface tension energy as Fs ≈ 4πγR2 (γ is surface tension, R is particle size) for a typical nematic droplet8 and R = 200 nm sized droplet one gets Fs ≈ 10−14 J, whereas the typical energy of the nematic droplet is ∼ 10−17 J (e.g., see Fig. 5). Clearly, this shows that in sub-micrometre droplets the orientational degree of freedom of the nematic droplet is effectively 3 orders of magnitude smaller than the surface tension and therefore cannot change the ideal spherical shape of the droplet.
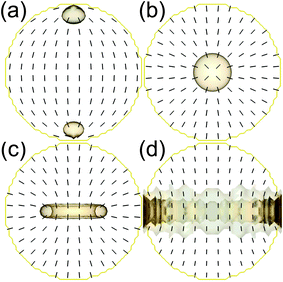 | ||
| Fig. 1 Nematic droplets with diameter of 200 nm. Defects are drawn as isosurfaces of nematic degree of order S = 0.4. The director is shown in black. The surrounding spherical confining surface is drawn in yellow. (a) Planar anchoring on the surface of the droplet leads to two surface boojum defects with topological charge of +1/2. Homeotropic anchoring leads to either (b) a radial hedgehog point defect, (c) a ring defect, or (d) a defect ring lying on the surface. | ||
The electric potential induced by the material itself via flexoelectric or order electric effect can affect the stability of the nematic structures and even change the equilibrium structure. In our study, we demonstrate the change in stability of hedgehog and point defect structures in homeotropic nematic filled spheres for different strengths of flexoelectric coupling between induced polarization and internal electric field. Changes in defect cores are observed and quantified for ring defect structures. Induced electric potential is explored for various coupling strengths between induced polarization and internal electric field. Stability of different defect structures for different anchoring strengths is considered. Spatial distributions of main contributions to total free energy density are shown.
1 Theory and method
Extended Landau–de Gennes (LdG) free energy F is used to describe liquid crystal elasticity, flexoelectricity, order electricity, and possible formation of defects.9 It is convenient to divide F in distortion Fe, surface FW, dielectric FD, and combined flexo- and order electric FG contributions. In one elastic constant approximation, distortion free energy is expanded in powers of order parameter tensor Qij and its first derivates | (1) |
Interaction of liquid crystal with surrounding surfaces is described by Rapini-Papoular like surface free energy:10
| FW = ½W0∫SURF(Qij − Q0ij)2dS | (2) |
Polarization induced by flexoelectricity and order electricity arises from distortion in the nematic profile and is therefore proportional to gradients of order parameter tensor:
| (PG)i = Gijkl(∂Qjk/∂xl) | (3) |
| PG = e1n(∇·n) + e3(n × (∇ × n)) + e2n(n·∇S) + e0∇S | (4) |
The flexoelectric and order electric polarization in nematic produces in general a non-uniform electric potential Φ, that reflects the underlying profile of the nematic. The corresponding flexoelectric and order electric free energy reads:11
 | (5) |
Electric potential couples to a nematic via dielectric interaction of induced dipoles in the nematic molecules and the corresponding electric field. Within the LdG framework (with no external electric field), the dielectric coupling is introduced as an additional free energy density contribution
 | (6) |
εij = ![[small epsilon, Greek, macron]](https://www.rsc.org/images/entities/i_char_e0c6.gif) δij + ⅔(εm∥ − εm⊥)Qij δij + ⅔(εm∥ − εm⊥)Qij | (7) |
![[small epsilon, Greek, macron]](https://www.rsc.org/images/entities/i_char_e0c6.gif) = Tr(ε)/3 is macroscopic permittivity and εim are molecular dielectric permittivities measured parallel and perpendicular to the nematic director, respectively. The potential at the surface of droplets was, for convenience, taken as constant which effectively acts as an electrode at the surface of the droplet. For simplicity, we set the potential at the surface to zero. For asymmetric profiles of the nematic within the droplet, assuming such electrode affects the detailed profile of the electric potential. Note, that dielectric potential Φ directly relates to the electric field as E = −∇Φ. The above electric coupling can in principle be affected by the inherently presence of mobile ions that effectively screen the electric field. In typical 5CB material, the number density of ions is 1020ions m−3, which gives for our 200 nm sized droplets order-of-magnitude 1 ion per droplet.14 Clearly, this shows that the role of ions can be omitted.
= Tr(ε)/3 is macroscopic permittivity and εim are molecular dielectric permittivities measured parallel and perpendicular to the nematic director, respectively. The potential at the surface of droplets was, for convenience, taken as constant which effectively acts as an electrode at the surface of the droplet. For simplicity, we set the potential at the surface to zero. For asymmetric profiles of the nematic within the droplet, assuming such electrode affects the detailed profile of the electric potential. Note, that dielectric potential Φ directly relates to the electric field as E = −∇Φ. The above electric coupling can in principle be affected by the inherently presence of mobile ions that effectively screen the electric field. In typical 5CB material, the number density of ions is 1020ions m−3, which gives for our 200 nm sized droplets order-of-magnitude 1 ion per droplet.14 Clearly, this shows that the role of ions can be omitted.
Dielectric interaction provides coupling between the nematic distortion field and electric potential and needs to be constructed accordingly to the relevant changes in the state of body. The thermodynamic potential for dielectric coupling discriminates between the regimes with fixed voltage or fixed charge.15 If there is no external field and the possible electrodes and material do not exchange charge with the surroundings, the system has fixed charge regime. This is the situation with our droplets that have only one electrode (the surface of the droplet), whereas the electric potential in the centre of the droplet can adjust freely according to the flexoelectric polarization. Effectively, the dielectric potentials for fixed charge or fixed voltage are different only by sign (+ or − in eqn (5) and (6)), but this makes a crucial difference on the overall energetics of nematic. Indeed, we observe the decrease of the total free energy of our droplets by flexolectricity (G ≠ 0) only if we assume potentials for fixed charge regime (+ sign in eqn (6)).
Our numerical relaxation method was developed to calculate effects of flexoelectricity and order electricity in nematic liquid crystal. Total free energy F = Fe + FW + FD + FG is minimised using Euler-Lagrange formalism.18 Governing equations for both order parameter tensor Qij and electric potential Φ are obtained. Note that minimisation of total free energy with respect to Φ is equivalent to solving Maxwell's equation for electric potential in anisotropic medium. The electric potential and nematic order parameter tensor are alternatively computed, until converged to stable or metastable solution. An absolute minimum in the free energy corresponds to the equilibrium state, whereas possible higher value minima give metastable solutions. The set of coupled partial differential equations is solved numerically by using an explicit Euler finite difference algorithm on a cubic mesh.16 Surface of the spherical confinement is modelled as a shell of mesh points with thickness of mesh resolution.
Material constants L, A, B, C of 5CB are used.17,19 If not stated otherwise, numerical values of parameters are as follows: strong anchoring of W0 = 10−2 J m−2, sphere diameter of 200 nm, macroscopic permittivity ![[small epsilon, Greek, macron]](https://www.rsc.org/images/entities/i_char_e0c6.gif) = 10.3, and single flexoelectric coefficient e from 0 to 50 pC m−1. Anisotropic media is assumed with ε‖m = 33.3 and ε⊥m = 12.4, which corresponds to the anisotropy of 5CB.19 Mesh resolution varies from 5 nm to 10 nm.
= 10.3, and single flexoelectric coefficient e from 0 to 50 pC m−1. Anisotropic media is assumed with ε‖m = 33.3 and ε⊥m = 12.4, which corresponds to the anisotropy of 5CB.19 Mesh resolution varies from 5 nm to 10 nm.
2 Electric potential and free energy in defect cores
Fig. 2 a,b,c shows electric potential induced in liquid crystal droplets with strong planar and strong homeotropic anchoring. All potential profiles reflect the underlying nematic profile symmetry and details of ordering. In the planar droplet (Fig. 2a) and homeotropic ring defect droplet (Fig. 2c) electric potential is anisotropic whereas in the radial hedgehog structure (Fig. 2b) it is spherically symmetric. Interestingly, flexoelectricity and order electricity can lead to potentials as large as ∼1 V in 0.2 μm droplets, which gives local electric field of ∼5 V μm−1. The electric potential caused by flexo- and order electricity is highest/lowest in the core region of defects. Likewise, flexoelectric contribution to the total free energy density is expected to be largest in the core regions of the defects.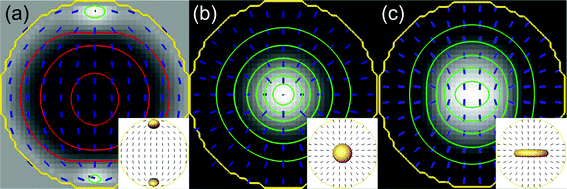 | ||
| Fig. 2 Electric potential and restructuring of nematic droplets. (a) Black represents maximum electric potential of 0.32 V induced for planar anchoring (white corresponds to −0.18 V). (b) The white region represents minimum electric potential induced in the middle of droplet of −0.67 V for the radial hedgehog structure and (c) −0.55 V for the ring defect structure (black corresponds to 0 V for both cases). Flexoelectric coefficient of e = 25 pC m−1 is used. Isolines in green and red differ by 0.1 V and indicate negative and positive electric potential, respectively. Insets in (a,b,c) show director field and corresponding defects visualised as isosurfaces of S = 0.4. | ||
The flexoelectric contribution to the total free energy can be calculated analytically for a droplet with a radial hedgehog structure and a constant degree of order if anisotropy in the dielectric constant of material is neglected (εij = ![[small epsilon, Greek, macron]](https://www.rsc.org/images/entities/i_char_e0c6.gif) δij). Only the splay term is relevant, which leads to
δij). Only the splay term is relevant, which leads to
 | (8) |
Quadratic dependence on flexoelectric coefficient e1 and linear dependence on droplet radius R is obtained. Indeed, free energy calculated numerically in the specific hedgehog structure with constant degree of order differs from the analytical estimate in eqn (8) for less than 5%.
Flexoelectric and dielectric contributions (eqn (5) and (6)) change the total free energy of distorted nematic. The flexoelectric contribution can stabilise distorted areas, that are not stable in materials with no or low flexoelectric coefficients. Regions in a nematic field that are strongly distorted, like defects, typically cost substantial amounts of elastic and order free energy that can be compensated by negative flexoelectric free energy contribution. Various contributions to the total free energy depend differently on liquid crystal deformations. Therefore, their spatial profile differs and their maxima do not necessarily coincide. In Fig. 3 spatial distribution of elastic, dielectric and flexoelectric free energy densities are shown for the nematic structures presented in Fig. 1.
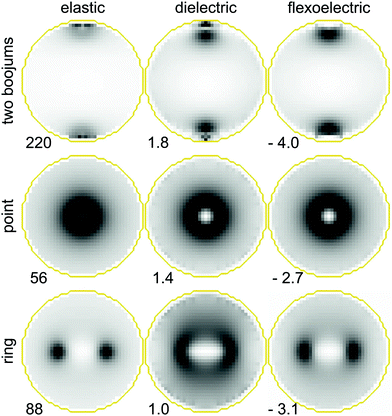 | ||
| Fig. 3 Spatial profiles of elastic, dielectric, and flexoelectric free energy volume density contributions for three defect structures (two boojums, point, and ring) presented in Fig. 1(a,b,c). The darker areas represent high absolute value of free energy density. Numbers at each figure gives maximum absolute value of free energy density measured in unit values of kJ m−3. White areas correspond to areas with zero free energy density. e = 10 pC m−1 is used. | ||
Contribution to the total free energy caused by flexoelectricity increases quadratically with the flexoelectric coefficient (see eqn (8)). Therefore, for a flexoelectric coefficient a few times larger than the coefficient of 5CB, the sum of the dielectric and flexoelectric contributions to the total free energy in the distorted regions can be of the same order as the elastic contribution. For example, in a homeotropic nematic droplet, the ratio of free energy contributions η = |(FD + FG)/Fe| for e = 10 pC m−1 is η ≈ 0.03, for e = 25 pC m−1 is η ≈ 0.16, while for e = 40 pC m−1 it reaches η ≈ 0.43. Clearly, flexo- and order electricity makes distorted regions less costly in terms of stabilisation and can thus play important role in the stability of defects. Recently, this has been shown for highly distorted blue phases.5
3 Stable structures and phase diagrams
The stability of the ring defect or radial hedgehog structure depends strongly on the strength of flexoelectric coupling. For given flexoelectric coupling, the energetically favourable structure can be found by comparing the total free energies of the two structures. The phase diagram in Fig. 4 shows the preference of the radial hedgehog structure over the defect ring structure for droplets with higher flexoelectric constant e. Distortion in a nematic droplet with higher flexoelectric coupling induces larger electric potential which makes hedgehog energetically more favourable. Indeed, in radial hedgehog a maximum splay deformation is established, which is favoured by flexoelectricity.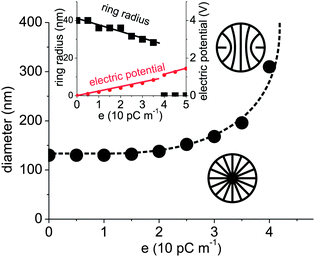 | ||
| Fig. 4 Phase diagram of nematic droplets with strong homeotropic anchoring. Stability regions of structures with either defect ring or radial hedgehog point defect are shown as functions of the flexoelectric constant e and diameter of the droplet. In the inset, radius of ring defect and maximum absolute value of electric potential as functions of flexoelectric coefficient e in the droplet are calculated. The defect ring shrinks and the electric potential linearly increases with increasing e. At e ≈ 40 pC m−1 ring defect becomes unstable and transforms into radial hedgehog. | ||
Distortions in nematic profile lead to electric potential induced by flexoelectricity, however the electric potential affects back the nematic profile. The back effect is most efficient in the core regions of defects where electric potential is largest. Role of this back-effect can be clearly extracted, if observing changes in ring defect structure of homeotropic droplet upon increasing the flexoelectric coefficient. Inset to Fig. 4 shows linear increase of the maximum value (in the centre of the droplet) of the electric potential, which follows from proportionality of flexoelectric polarization to flexoelectric coefficient e. Interestingly, upon increase in the potential caused by increase in the flexoelectric constant, the radius of defect ring in nematic droplet changes. We observe a qualitatively linear decrease in radius of the defect ring with increasing e. Observing sizes of defect loops or rings, therefore offers also means for testing strength of flexoelectric and order electric coupling in liquid crystal materials.
In confined geometries, such as droplets or colloids, stability of nematic structures and defects is, in addition to physical size, also controlled by the strength of bulk nematic–surface interactions, i.e. the strength of surface anchoring. To understand how the flexo- and order electricity respond to the changes in size and anchoring strength, the full phase diagram of homeotropic droplets is calculated in Fig. 5 for non-flexoelectric material (e = 0) and flexoelectric material (e = 40 pC m−1). First order transitions between axial, ring defect and radial hedgehog structures are predicted. The stability ranges of all three structures meet in the triple point. Nematic droplets with weak surface anchoring prefer axial structure where the defect line encircles the waist of the droplet. For droplets with diameters less than 1 μm relatively strong anchoring is required to stabilise bulk (radial hedgehog or ring defect) structures. In flexoelectric material, the phase region of point defect expands significantly towards weaker anchoring strengths and larger droplets. Qualitatively interpreting the results, flexo- and order electricity are able to partially substitute the role of surface anchoring by imposing dielectric bulk-imposed stabilisation of deformed structures via flexo electric field.
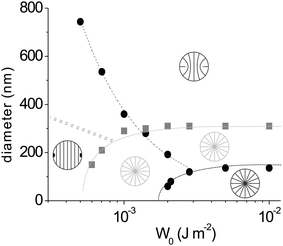 | ||
| Fig. 5 The stability of nematic structures in homeotropic droplets for various sizes and anchoring strengths with and without flexoelectric effect. Phase diagram for non-flexoelectric droplets (e = 0) is shown in black. The relative anchoring strength curve20r = W0RL−1 = 9.4 fits well with the phase line between ring defect and axial structure (black dashed line). In grey, phase diagram of strongly flexoelectric droplets (e = 40 pC m−1) is shown. Note how the stability region of the strongly distorted structures (point defect and ring defects) has shifted towards smaller anchoring strengths in flexoelectric droplets, as the result of flexo- and order electricity induced stabilisation of defects. Grey dotted line is estimated by qualitatively extrapolating the free energy profiles of axial and ring structure. | ||
4 Conclusions
A coupled numerical method based on the Landau–de Gennes framework was developed to study the flexoelectric effect in a nematic liquid crystal. In confined geometries with strong distortions of nematic, effects of flexoelectricity and order electricity can become of substantial importance. In particular, within defect regions, electric potential induced by flexo- and order electricity becomes large enough to change size and structure of the defect cores. The potential can be as high as 1 V in 200 nm droplets. In the ring structure, the defect ring shrinks with increasing flexolectric coupling to maximise the splay mode of elastic distortion.Flexoelectricity lowers the total free energy of defect configurations which makes them less costly. These regions can have flexoelectric free energy density comparable to distortion free energy density. Consequently, flexoelectricity can change the stability of the defects in homeotropic droplets, switching between radial nematic structure and defect ring structure. This flexoelectricity-induced stabilisation of defects opens new route for designing stable complex nematic profiles based on defect configurations, offering an alternative to currently established approaches using confinement, surface anchoring, and temperature. For more detailed modeling one must certainly take into account differences in elastic constants and possible effects of free charges that can assemble in defect cores. New effects could arise with application of external electrical field and extension to inverted geometries like nematic colloids that have great potential for photonics.
Acknowledgements
This research was financially supported by the Slovenian Office of Science (P1-0099), EU network HIERARCHY, and Center of Excellence NAMASTE. Miha Ravnik acknowledges support of the EC under the Marie Curie Programme ACTOIDS; content reflects only the author's views and not the views of the EC. The authors would also like to thank Flynn Castles and Gregor Skacej for valuable discussion.References
- R. B. Meyer, Phys. Rev. Lett., 1969, 22, 918 CrossRef CAS.
- G. Barbero, I. Dozov, I. Palierne and G. Durand, Phys. Rev. Lett., 1986, 56, 2056 CrossRef CAS.
- S. M. Morris, M. J. Clarke, A. E. Blatch and H. J. Coles, Phys. Rev. E: Stat., Nonlinear, Soft Matter Phys., 2007, 75, 041701 CrossRef CAS.
- H. J. Coles and M. N. Pivnenko, Nature, 2005, 436, 997–1000 CrossRef CAS.
- F. Castles, S. M. Morris, E. M. Terentjev and H. J. Coles, Phys. Rev. Lett., 2010, 104, 157801 CrossRef CAS.
- M. Humar, M. Ravnik, S. Pajk and I. Musevic, Nat. Photonics, 2009, 595, 95–600.
- S. Mkaddem and E. C. Gartland, Phys. Rev. E: Stat. Phys., Plasmas, Fluids, Relat. Interdiscip. Top., 2000, 62, 6694–6705 CrossRef CAS.
- S. Vhandrasekhar, Liquid Crystals, Cambridge University Press, Cambridge, 1992 Search PubMed.
- P. G. de Gennes and J. Prost, The Physics of Liquid Crystals, Oxford University Press, Oxford, 2nd edn, 1993 Search PubMed.
- B. Jerome, Rep. Prog. Phys., 1991, 54, 391 CrossRef CAS.
- W. J. A. Goossens, Liq. Cryst., 1989, 5, 1083–1097 CrossRef.
- S. A. Tatarkova, D. R. Burnham, A. K. Kirby and G. D. Love, Phys. Rev. Lett., 2007, 98, 157801 CrossRef CAS.
- C. Blanc, D. Svensek, S. Zumer and M. Nobili, Phys. Rev. Lett., 2005, 95, 097802 CrossRef CAS.
- A. Sawada, K. Tarumi and S. Naemura, Jpn. J. Appl. Phys., 1999, 38, 1418 CrossRef CAS.
- L. D. Landau, E. M. Lifchitz and L. P. Pitaevskii, Electrodynamics of Continuous Media, Nauka, Moscow, 2nd edn, 1982 Search PubMed.
- W. H. Press, B. P. Flannery, S. A. Teukolsky, and W. T. Vetterling, Numerical Recipes, Cambridge University Press, Cambridge, 1986 Search PubMed.
- M. Ravnik, M. Skarabot, S. Zumer, U. Tkalec, I. Poberaj, D. Babic, N. Osterman and I. Musevic, Phys. Rev. Lett., 2007, 99, 247801 CrossRef CAS.
- M. Ravnik and S. Zumer, Soft Matter, 2009, 5, 269–274 RSC.
- P. J. Collings and M. Hird, Introduction to Liquid Crystals, Taylor & Francis, London, 1997 Search PubMed.
- S. Zumer and S. Kralj, Liq. Cryst., 1992, 12, 613–624 CrossRef.
| This journal is © The Royal Society of Chemistry 2011 |
