The impact of the amide connectivity on the assembly and dynamics of benzene-1,3,5-tricarboxamides in the solid state
Martin
Wegner
a,
Dmytro
Dudenko
ab,
Daniel
Sebastiani
b,
Anja R. A.
Palmans
c,
Tom F. A.
de Greef
d,
Robert
Graf
*a and
Hans W.
Spiess
a
aMax-Planck-Institut für Polymerforschung, Postfach 3148, DE-55021, Mainz, Germany. E-mail: graf@mpip-mainz.mpg.de
bFreie Universität Berlin, Arnimallee 14, DE-14195, Berlin, Germany
cLaboratory of Macromolecular and Organic Chemistry, Eindhoven University of Technology, P. O. Box 513, 5600 MB, Eindhoven, The Netherlands
dInstitute for Complex Molecular Systems, Eindhoven University of Technology, P. O. Box 513, 5600 MB, Eindhoven, The Netherlands
First published on 3rd August 2011
Abstract
Solid-state NMR experiments as well as extensive Car–Parrinello Molecular Dynamics simulations are used to study the dependence of supramolecular self-organization of benzene-1,3,5-tricarboxamides (BTA) on the local orientation of the amide functionality. Unlike the known symmetric co-planar helical arrangement of CO-centered BTAs found in supramolecular architectures like supramolecular polymers in gels, N-centered BTAs adopt an asymmetric helical arrangement in the solid-state. The resulting tilt angle between the aromatic cores of neighboring BTA molecules leads to a breaking of the three-fold molecular symmetry and thus causes a splitting of 1H MAS NMR signals. At elevated temperatures, motional averaging of the split 1H MAS NMR signals is observed, which can be attributed to certain dynamics on the ms time scale of individual BTA molecules in the columnar packing arrangement.
Introduction
The control of the local molecular packing as well as the design of tailored supramolecular ordered nano-structures is one of the key challenges for the rational design of novel functional materials with unique mechanical,1,2 electronic,3–5 and biological6 properties. The self-assembly of these systems is accomplished by a delicate balance of attractive forces between individual molecules, such as hydrogen bonding7,8 or van der Waals interactions,9,10 and highly flexible side chains, providing sufficient disorder to prevent spontaneous crystallization. In many cases, these side chains own additional properties as for instance polarity differences11 or chiral centers12 to further control the self-assembly into one-dimensional nanostructures. Here we study the local solid-state packing of benzene-1,3,5-tricarboxamides (BTAs), a relatively simple C3 symmetric molecule (see Fig. 1). The BTA molecules self-assemble into one-dimensional aggregates in dilute solutions via strong three-fold, cooperative hydrogen bonding as evident by X-ray diffraction, FTIR, circular dichroism, UV-vis, and DFT studies.13–17 The directionality and strong association of BTA monomers into ordered hydrogen-bonded columns with intrinsic large dipole moments has been exploited to construct supramolecular materials,18 nucleating agents for isotactic polypropylene,19 and organic thin films with a large remnant polarization which are of great interest for the construction of organic diodes.20 For these type of applications, structural information on the molecular level of the BTA molecules in the solid-state is essential. A recent solid-state study of the self assembly of a supramolecular monomer based on a BTA core but owning sterically much more demanding dendritic side groups showed that the supramolecular organization was mainly driven by the packing of the side groups and almost independent of the intermolecular hydrogen bonding of the BTA cores.21 Due to the simplicity of the side chains, however, this finding will not be relevant here. Our solid-state investigation on the local packing of BTAs is performed on two structurally distinct molecules, a carbonyl-centered (CO-centered) BTA with (S)-3,7-dimethyloctyl side chains and a nitrogen-centered (N-centered) BTA with (S)-2,6-dimethylheptyl side chains. Previous solution-based studies have shown that switching the amide connectivity from a carbonyl to a nitrogen centered topology only results in weaker self-association. However, as shown in this work, the solid-state supramolecular morphology of the N-centered and CO-centered BTAs show remarkable differences. By combining solid-state NMR experiments22,23 with extensive Car–Parrinello Molecular Dynamics simulations (CPMD)24,25 and DFT computations of chemical shifts, a solid-state model for the N-centered BTA could be identified, with a clearly different, helical-like packing. This demonstrates, that subtle modifications of the molecules, like changing the amide connectivity from CO-centered to N-centered monomers, may cause a substantial variation in the supramolecular organization. In particular the relative orientation of the π-electron systems between neighboring molecules is affected, which is crucial for molecular electronics applications.26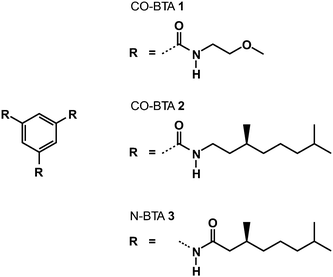 | ||
| Fig. 1 Structures of the three investigated compounds. | ||
Methods
Solid-state NMR experiments
1H Magic angle spinning (MAS) NMR spectra were recorded on a Bruker Avance I spectrometer operating at a Larmor frequency of 700.13 MHz. All spectrometers were equipped with commercial MAS double resonance probes supporting zirconia rotors with an outer diameter of 2.5 mm. The MAS frequency was 30 kHz and the additional heating due to air friction under fast spinning conditions has to be taken into account. The temperature was corrected according to a standard procedure using the 207Pb resonance of Pb(NO3)2 as a chemical shift thermometer.27 All spectra were referenced to adamantane (1.63 ppm for 1H, 29.5 ppm for 13C).28 The pulse length was set to 2.5 μs and a general recycle delay of 2 s was used. Rotor-synchronized 1H–1H double quantum–single quantum (DQ–SQ) correlation spectra, 1H exchange spectroscopy, and dipolar 1H–13C correlation spectra have been recorded on an Avance III spectrometer operating at Larmor frequencies of 850.27 MHz (1H) and 213.80 MHz (13C). 1H–1H DQ–SQ correlation was performed at 30 kHz MAS using the BABA29,30 sequence with an excitation time of one rotor period (i.e., τex = 33.6 μs). 50 complex data points have been recorded in the indirect dimension averaging 32 transients per data point. 1H–13C correlation has been achieved via the 13C{1H} REPT-HSQC method31,32 with excitation times of τex = 40.0 μs or τex = 33.6 μs depending on the MAS frequency (i.e., 25 kHz or 30 kHz, respectively). For the REPT-HSQC spectra, 32 complex data points have been recorded in the indirect dimension and 384 (CO-BTA 1) or 576 (N-BTA 3) transients have been averaged per data point. 1H exchange spectroscopy has been carried out recording 256 complex data points with 16 transients each and a mixing time of 3 ms. Due to polarization transfer via strong dipolar couplings during the mixing period, homonuclear decoupling was applied using the PMLG method.33 The magnetization was aligned at the magic angle by a high power pulse of 1.5 μs length. According to Leskes et al.,34 the exact specification of the sequence is PMLG5xm which was applied on-resonance (irradiation at 6 ppm) for the full length of the mixing time. All 2D spectra have been recorded and processed according to the States-TPPI35 method. Exchange line shapes were simulated with a homemade MATLAB routine following a treatment given elsewhere.36 Assuming a three-site exchange of respective protons, the time evolution of the initial transverse magnetization could be calculated evaluating the modified Bloch equation. Subsequent Fourier transformation led to simulated frequency domain spectra, which were used to fit the experimental spectra in order to determine temperature-dependent rate constants.
Molecular dynamics simulations and NMR chemical shift calculations
Different model stacks of CO- and N-centered BTAs were designed for complementary ab initio simulation under periodic boundary conditions assuming infinite stacks of coaxial BTA molecules. The molecules were simplified by truncating the alkyl chains leaving only a methyl group. This modification does not affect the direct interactions of the aromatic cores and the amide groups of adjacent molecules.Conformational fluctuations in the real BTA system might have time scales of nanoseconds, which is beyond the picosecond scale of the ab initio MD simulations. Nevertheless, a good part of the local phase space can be sampled realistically with this technique. In order to allow all local degrees of freedom to relax, while limiting the amplitude of low-frequency modes of the system, the simulation temperature was set to 150 K. For the analysis of NMR shielding effects originating from the close proximity of the neighboring aromatic rings in the column, Nucleus Independent Chemical Shift map37 (NICS map) calculations of the stacked structures were calculated. Generally, NICS maps allow an estimation to which extent the local magnetic fields are shielded (or deshielded) by the neighboring molecules in the stack, hence providing a valuable approach to the experimentally observed offset between solution and solid-state NMR chemical shifts.38,39 Furthermore, NMR chemical shifts were computed explicitly by averaging the corresponding chemical shifts of a subset of 40 randomly selected configurations which were extracted from the CPMD trajectories. Such conformational sampling has been shown previously to enable the accurate characterization of local structural features and non-covalent interactions in soft matter and supramolecular assemblies.40–42 Related work has been able to elucidate spectroscopic fingerprints of hydrogen bonding in molecular crystals and pharmaceuticals.43–48 Very recent work along these lines has even been able to compute spectroscopic evidence for very weak van der Waals binding of molecular nitrogen to a metal–organic center from first principles electronic structure methods.49 The actual calculation of nuclear shielding tensors was performed with DFT under the same periodic boundary conditions as used for the generation of the molecular dynamics trajectories. This method is implemented in the CPMD package50,51 using the continuous gauge transformation approach.38,39
The simulations were carried out in a tetragonal unit cell with a = b = 1.3 nm and c = 2.1 nm. After an initial thermalization MD run of 6 ps, a production MD run of 4 ps was performed for each model. All calculations were done with the CPMD package52 in the framework of dispersion-corrected DFT (DC-DFT)53 using the gradient-corrected exchange and correlation functionals (BLYP)54,55 and a plane wave cutoff of 70 Ry.
Results and discussion
NMR studies of the solid-state assembly of CO-and N-centered BTAs
In order to reveal the characteristic differences of CO- and N-centered BTAs, 1H MAS NMR has been applied on a compound with methoxyethyl side chains (CO-BTA 1) for which the crystal structure is known56 and two more compounds with different amide connectivity but otherwise similar side chains. CO-BTA 2 is CO-centered, equipped with (S)-3,7-dimethyloctyl side chains, whereas N-BTA 3 is N-centered bearing (S)-2,6-dimethylheptyl side chains (Fig. 1). The crystal structure of CO-BTA 1 shows a highly symmetric coplanar arrangement of adjacent BTA molecules with an intermolecular distance of 3.6 Å. The stability of the stack arises from a symmetric self-complementary hydrogen bonding between amide groups of the stacked BTA molecules and from π–π-interactions of adjacent benzene rings. Due to the geometry of the amide motif, neighboring BTA molecules are rotated by an angle of 60° about the stacking axis. Compounds 2 and 3 do not offer a single crystal structure, however, previous wide-angle X-ray measurements indicated a columnar liquid-crystalline phase above 120 °C and 91 °C, respectively,15,16 with an intermolecular distance of 3.5 Å. To obtain structural insight into the local order of CO-BTA 2 and N-BTA 3, solid-state NMR was employed and the results were compared with the chemical shifts of the structurally known sample CO-BTA 1. All compounds had been annealed at 150 °C, well above the melting points, for 30 min before 1H MAS NMR spectra were recorded at 23 °C. Apart from the signals of the side chain protons, the compounds provide a different number of signals in the low-field region. While both CO-centered BTAs have only two low-field peaks at 9.0 ppm and 6.8 ppm, as well as at 9.6 ppm and 6.5 ppm (Fig. 2a), the spectrum of N-BTA 3 shows one resonance at 9.5 ppm but three distinct resonances at 7.0 ppm, 5.5 ppm, and 4.8 ppm (Fig. 2b). The narrower NMR lines observed for sample CO-BTA 2 and sample N-BTA 3 in comparison to sample CO-BTA 1, result from more pronounced molecular fluctuations which finally lead to the LC transitions reported before.15,16 Moreover, all solid-state NMR spectra differ substantially from the corresponding solution NMR (CDCl3) chemical shifts (vide infra).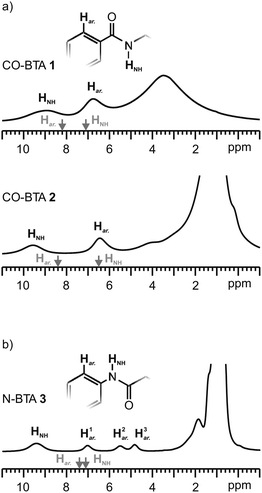 | ||
| Fig. 2 1H NMR spectra of (a) CO-BTA 1, CO-BTA 2, and (b) N-BTA 3 recorded at 23 °C. The grey arrows indicate 1H chemical shifts determined in CDCl3. Solution NMR spectra of CO-BTA 1 and N-BTA 3 were measured. Values of CO-BTA 2 were taken from Stals et al.16 The assignment of solid-state NMR spectra has been achieved by 1H–13C correlation spectroscopy (see text). | ||
A straight spectral assignment by best matching of solid-state and solution NMR chemical shifts of CO-BTA 1 (i.e., H1NH at 6.8 ppm and Har. at 9.0 ppm) seemed inappropriate since the amide proton resonance was expected to be significantly shifted to higher ppm-values due to evident hydrogen bonding. Alternatively assigning the low-field peak to the amide resonance implies a remarkable high-field shift of the aryl proton resonance. A reliable spectral assignment was thus essential to further interpret the 1H MAS NMR spectra.
To this end 13C{1H} REPT-HSQC experiments have been carried out, making use of the more definite peak assignment in the solid-state 13C MAS NMR spectrum. Irrespective of the amide connectivity, the carbonyl (CO) signal is observed at around 170 ppm, the quaternary aromatic carbon (Cq.) signal at 138 ppm, and the ternary aromatic carbon (CH) signal below 130 ppm, as indicated by the 13C{1H} CP/MAS spectra (Fig. 3a and c). Due to the nature of the REPT method, short dipolar recoupling times generally give rise to the observation of the strongest heteronuclear dipolar couplings only. In this manner, the 13C{1H} REPT-HSQC experiment presented here probes bonded (close) 13C–1H pairs, although the method is actually designed for through-space correlation experiments.32 Consequentially, apart from the 13C–1H spin pairs of the side chains, only coherences of the ternary carbon atom (CH) and the attached aryl proton are visible in the 2D pattern.
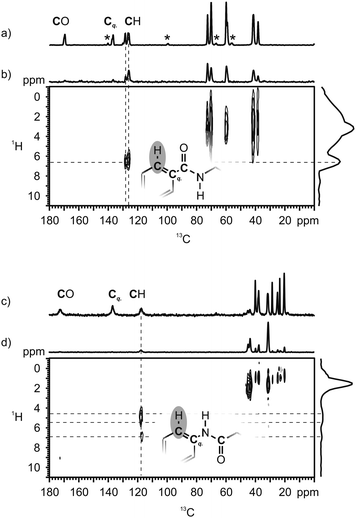 | ||
| Fig. 3 (a) and (c): 13C{1H} CP/MAS spectra of CO-BTA 1, and N-BTA 3 which have been included for clarity. The spinning side-bands in (a) are marked with asterisks. Due to distinct side chain conformations in the crystal structure of CO-BTA 1,56 side chain signals and the ternary carbon signal (CH) are split into at least two components. (b) and (d): 2D REPT-HSQC spectra of CO-BTA 1 and N-BTA 3. The 1D spectra above and on the right are skyline projections of the displayed 2D area. | ||
As indicated by the correlation spectra of CO-BTA 1 and N-BTA 3 the proton peaks at 6.8 ppm (CO-BTA 1, Fig. 3b) as well as the three peaks at 7.0, 5.5, and 4.8 ppm (N-BTA 3, Fig. 3d) can be unambiguously assigned to aryl proton sites. In addition, the correlation spectrum of N-BTA 3 shows a minor resonance at 172 ppm (13C) and around 9 ppm (1H), due to weak through-space couplings of amide protons and the carbonyl carbon atoms. An identical experiment has been conducted for CO-BTA 2 (not shown) which consistently confirmed a high-field shifted aryl proton resonance in the solid state, compared to solution NMR spectra.
Since the origin of the high-field signals in BTAs 1 to 3 has been verified, the remaining signal at higher ppm-values, can be assigned to the low-field shifted resonances of the amide protons. The chemical shift offset (1.9 ppm) of BTA 1 is partially due to the unusually high chemical shift of the amide proton measured in solution which is, in turn, caused by weak hydrogen bonds between the polar methoxyethyl side chains and the amide groups in CDCl3. The other two values of 3.1 ppm (CO-BTA 2) and 2.4 ppm (N-BTA 3) (Table 1, rel. shift) are indicative of strong hydrogen bonds.39,57
| Solution (obs.) | Solid (obs.) | Rel. shifta (obs.) | NICS | CPMD (sym.) | CPMD (asym.) | ||
|---|---|---|---|---|---|---|---|
| a δ solid − δsolution. b Corresponds to the NICS map of the simplified CO-centered BTA given in Fig. 4left. c Corresponds to the NICS map of the asymmetric model N-BTA asym given in Fig. 4right. d The values refer to the isolated monomers having the same geometry as the molecules within the stack. | |||||||
| CO-BTA 1 | NH | 7.1 | 9.0 | +1.9 | |||
| CH | 8.2 | 6.8 | −1.4 | ||||
| CO-BTA 2 | NH | 6.5 | 9.6 | +3.1 | 10.7 | ||
| CH | 8.4 | 6.5 | −1.9 | −1.8b | 6.3 | ||
| N-BTA 3 | NH1 | | | | | | | | | 9.7 | |
| NH2 | 7.1 | 9.5 | +2.4 | 9.6 | 9.5 | ||
| NH3 | | | | | | | | | 9.8 | ||
| CH1 | | | 7.0 | −0.6 | −0.8c | | | 7.2 (8.1)d | |
| CH2 | 7.6 | 5.5 | −2.1 | −1.5c | 5.8 (7.2)d | 5.6 (6.9)d | |
| CH3 | | | 4.8 | −2.8 | −1.8c | | | 4.7 (6.4)d |
The slightly higher hydrogen-bond induced chemical shift offset of the CO-centered BTA is in line with a previous DFT study predicting a higher interaction energy for the CO-centered motif.17 The small line width of the amide resonances in the 1H MAS NMR spectra of all BTAs including N-BTA 3 suggests a narrow distribution of hydrogen bond lengths. This means that besides the hydrogen bond strength and the presence of three bonds per BTA molecule, the uniformity of the hydrogen bonds also contribute to the high stability of the BTA stacks. In contrast to the amine resonance, however, the presence of three distinct aryl proton peaks for N-BTA 3 indicates a breaking of the molecular symmetry in the solid-state assembly as it has been observed in columnar systems before, e.g. in the case of hexabenzocoronenes.58,59
Simulations of packing models for columnar BTA stacks
Generally, in all BTAs, the aryl protons are drastically shifted to high-field due to the packing effect within columnar arrangement. To understand this effect in more detail, NICS maps of CO- and N-centered model stacks have been calculated (Fig. 4). These stacks were obtained by CPMD simulations of simplified BTA molecules with methyl groups instead of longer side chains. The color code specifies the impact on a nuclear spin of a probe molecule within the stack due to the intracolumnar shielding effect (shown in-plane). For example, the blue color in the middle indicates a strong ring current effect of benzene rings in the columnar assembly of the CO-centered molecule (Fig. 4, left). The depicted NICS map reveals almost equally strong high-field shifts of the aryl proton resonances by about −1.8 ppm due to the shielding of adjacent BTA molecules. This value nicely agrees with the experimental difference between the chemical shifts of the aryl protons in solution and in the solid state (Table 1, rel. shift). Thus, in case of the CO-centered BTAs the NICS map sufficiently accounts for packing effects in the 1H NMR spectrum of the solid sample.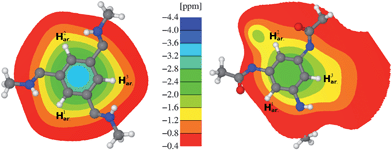 | ||
| Fig. 4 NICS map describing the influence of the two neighboring BTA molecules on the chemical shift of the inner BTA molecule: CO-BTA 1 (left) and N-BTA 3 (right). | ||
For the sake of completeness, a CPMD simulation including an NMR chemical shift calculation has also been performed for a symmetric stack of the CO-centered model compound. As expected, the calculated chemical shift of the aryl protons (6.3 ppm) are well in line with the NMR measurement (6.5 ppm). However, for the amide protons the calculation yielded a higher value of 10.7 ppm, compared to 9.6 ppm in the experiment. The reason for this deviation is twofold. Firstly, for reasons of stability, the temperature of the simulation was set to 150 K. Thus, due to temperature-dependent mean hydrogen bond length, the amide proton resonances are generally shifted to low-field by a few tenths of a ppm. Secondly, by replacing the (S)-3,7-dimethyloctyl side chain in the simulation by a methyl group, the amide proton becomes slightly deshielded, which also contributes to a higher ppm-value. The latter effect should be negligible for N-centered models since the carbonyl group is located between the nitrogen and the methyl group.
Although the general order of proton signals in the solid-state NMR spectra of N-BTA 3 and the CO-centered BTAs is identical (i.e., amide proton signals are shifted to low-field, aryl proton signals are shifted to high-field) the existence of three aryl proton signals indicates a symmetry-breaking in the molecular organization in the solid state. For this reason, a simple coplanar arrangement of the benzene rings as found for the CO-centered BTAs can be ruled out. Nevertheless, previous results on the liquid-crystalline phase of N-BTA 3 found a hexagonal columnar organization of molecules and an intermolecular distance of 3.5 Å, which coincides with the values determined for liquid-crystalline CO-BTA 2.15,16
In order to explain the remarkable features observed in the NMR experiments, CPMD simulations were performed. In the course of this theoretical study, two simplified stacking models were compared, which represent two possible local packing motifs: N-BTA-sym and N-BTA-asym (Fig. 5). The crystal structure of CO-BTA 1 has been taken as a template for the composition of model stacks.56 Compound 1 forms an infinite helical stack with adjacent molecules having a pitch angle of 60°. In the N-BTA-sym model, similarly to CO-BTA 1, all three carbonyl groups are oriented in the same direction (Fig. 5a and b). Thus, the molecules maintain their C3-symmetry with respect to the stacking axis. In the N-BTA-asym model one of the three carbonyl groups is pointing in the opposite direction by flipping one amide group about the Ph-NH bond axis by 180°. The resulting stack differs from the N-BTA-sym arrangement in a hydrogen-bonded spiral of inverted amide groups, winding in an opposite direction about the columnar axis (Fig. 5c and d). According to the CPMD simulations, the N-BTA-sym model will mostly retain its coplanar arrangement, while N-BTA-asym will partially lose the coplanarity of benzene rings. The modeled stack rather corresponds to a quasi-helical structure with six molecules per complete winding. Moreover, the arrangement of the initial segments of the side chains are different for the hydrogen bonds with anti-parallel orientation, leading to the most pronounced differences between the N-BTA-sym and the N-BTA-asym in Fig. 5b and 5c.
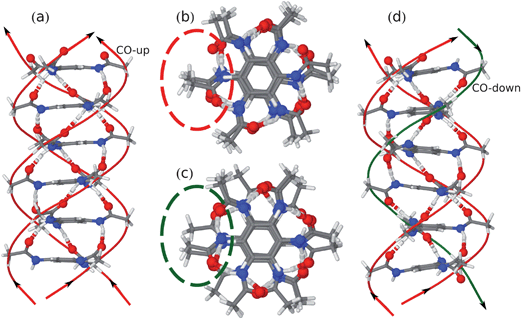 | ||
| Fig. 5 (a) Complete unit cell of N-BTA-sym; (b) topview on N-BTA-sym stack; (c) topview on N-BTA-asym stack; and (d) sideview on N-BTA-asym. | ||
For both N-centered model stacks, the CPMD simulations reveal different NMR spectroscopic signatures (Table 1, CPMD (sym.) and (asym.)). It appears that the experimental chemical shifts of the amide protons are quite well described by both models resulting in chemical shifts only slightly higher than the experimental value of 9.5 ppm. However, the splitting of the aryl resonance cannot be explained by the symmetric model N-BTA-sym as it results in three equal chemical shifts around 5.8 ppm for H1ar., H2ar., and H3ar. (Table 1, CPMD (sym.)). Yet, the asymmetric model N-BTA-asym is in good agreement with the experimental observations. The NMR chemical shift calculation of N-BTA-asym yielded chemical shifts of 7.2 ppm, 5.6 ppm, and 4.7 ppm (Table 1, CPMD (asym.)) and are well in line with the observed values of 7.0 ppm, 5.5 ppm, and 4.8 ppm (Table 1, solid (obs.)). The distinct resonances can be explained by the diverse environments of the aryl protons. In contrast to the CO-centered BTAs, however, the 1H NMR spectrum cannot be understood by shielding effects only, as it is vividly demonstrated by the corresponding NICS map (Fig. 4, right). The shielding indeed varies between the positions of the aryl protons, though not as much as found in the NMR spectrum of N-BTA 3. Rather, the asymmetric amide conformation of a single N-BTA 3 monomer itself gives rise to a substantial splitting of the aryl proton resonance. This can be shown by the NMR chemical shift calculation performed on a single molecule taken from the stack (Table 1, CPMD (asym.), values in brackets). The remarkable distribution of chemical shifts between 6.4 and 8.1 ppm is due to the differently oriented amide groups. It is well-known that CO and NH groups have opposite polarization effects on protons located in relatively close proximity.39,60,61 Hence it becomes evident why, for instance, proton H1ar., surrounded by two CO-groups, exhibits the highest chemical shift of about 7.2 ppm in the simulation. The same interpretation applies to the H2ar. and H3ar. protons as well. For that reason, the computed chemical shift values of the N-centered BTA model are due to a combined effect of the induced field created by neighboring molecules and a marked polarization effect of close amide groups.
Naturally, both models have been investigated regarding their relative stability. To that end, the entire CPMD trajectory of 4 ps has been analyzed. It was found that the model N-BTA-asym is more favorable by 3.0 kJ mol−1, compared to the symmetric model N-BTA-sym15 which, in principle, led to a hypothetical ratio of 77![[thin space (1/6-em)]](https://www.rsc.org/images/entities/char_2009.gif) :
:![[thin space (1/6-em)]](https://www.rsc.org/images/entities/char_2009.gif) 23 in favor of the asymmetric assembly at ambient conditions. These energy differences however, are too small to enable conclusions about the preferred arrangement, especially as the energy fluctuation in the simulation (i.e., a measure of the thermal energy of the system) was about ten times higher. Moreover, in order to study the arrangement on grounds of MD simulations, the impact of the alkyl chains within the hexagonal packing would have to be considered explicitly, which is beyond the scope of this study. Nonetheless, the intercolumnar organization of N-BTA 3 could be clarified by its characteristic 1H NMR features and its convincing agreement with the asymmetric model N-BTA-asym.
23 in favor of the asymmetric assembly at ambient conditions. These energy differences however, are too small to enable conclusions about the preferred arrangement, especially as the energy fluctuation in the simulation (i.e., a measure of the thermal energy of the system) was about ten times higher. Moreover, in order to study the arrangement on grounds of MD simulations, the impact of the alkyl chains within the hexagonal packing would have to be considered explicitly, which is beyond the scope of this study. Nonetheless, the intercolumnar organization of N-BTA 3 could be clarified by its characteristic 1H NMR features and its convincing agreement with the asymmetric model N-BTA-asym.
The proposed asymmetric arrangement of N-BTA 3 gives rise to a non-uniform distribution of proton–proton distances. In such a case, additional confirmation of the asymmetric structure can be achieved by 1H–1H DQ–SQ correlation spectroscopy (Fig. 6a). The 2D spectrum of N-BTA 3 indicates dipolar couplings between all proton sites which points to a high degree of local order within the material. Couplings of the aryl protons are of particular interest since their distinct chemical shifts allow the assignment of all peaks to particular spin pairs. Here it should be pointed out, that the presence of strong intra-molecular dipolar couplings such as those between the amine and the aryl protons is supposed to truncate weak dipolar couplings between more remote proton sites. However, it has been shown that relative intensities of weak double quantum coherences can be used to estimate relative dipolar couplings although the absolute intensities are substantially reduced by dipolar truncation effects.62,63 Thus, the amplitudes of the weak double quantum signals consequently enable an estimation of relative intermolecular distances between the aryl protons. Generally, couplings between like protons are indicated by autopeaks, located at the diagonal (blue, yellow, and purple marked peaks), whereas couplings between unlike protons give rise to pairs of off-diagonal cross-peaks (connected by horizontal bars). The intensities of the three autopeaks are rather similar while the intensities of the cross-peaks differ and were particular strong for the H1ar.–H2ar. spin pair. The relative intensities can better be assessed by comparing the amplitude profiles along the solid vertical lines in the 2D pattern (Fig. 6b). In this figure, autopeaks are marked blue, while cross-peaks are red. The observation of a uniformly weak coupling between the like proton species is fully in line with the CPMD results suggesting a distance of 4.2 Å to 4.3 Å between like spins (i.e., as depicted for the yellow species in Fig. 6c). The reason for the more intense H1ar.–H2ar. correlation signal is the significantly smaller distance of 3.8 Å between these protons due to the tilt of adjacent benzene rings. It should be noted that autopeaks in this case are due to intermolecular couplings only, whereas cross-peaks are based on inter- as well as intramolecular couplings across the ring plane. However, the distances between protons of a single benzene ring are identical (4.32 Å), and hence cannot account for intensity differences of double quantum coherences. The excess intensity of the H1ar.–H2ar. coherence is therefore direct experimental proof for the specific inclination of neighboring N-BTA 3 molecules in the asymmetric columnar stacks proposed by the CPMD simulations.
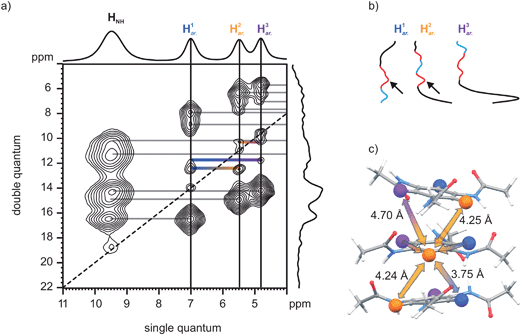 | ||
| Fig. 6 (a) 1H–1H DQ–SQ correlation NMR spectrum of N-BTA 3. (b) Intensity profiles of the aryl resonances along the DQ dimension (blue: autopeaks, red: cross-peaks). Arrows indicate the especially high intensity of the H1ar.–H2ar. coherence. (c) The model N-BTA-asym and a couple of representative distances. | ||
Solid-state dynamics of N-BTA
As described above, CO-BTA 2 and N-BTA 3 exhibit a columnar, hexagonally ordered mesophase (Colho) at higher temperatures. While compound 2 has distinct phase transitions between a solid low-temperature phase and the mesophase, as well as the mesophase and the isotropic melt,16 compound 3 only shows an isotropization point above 200 °C. N-BTA 3 rather transforms gradually into a liquid-crystalline phase without evident enthalpy changes in the second heating run of a DSC measurement.15 For this reason N-BTA 3 was studied by variable temperature 1H MAS NMR in order to analyze the transition from the liquid-crystalline phase to the solid phase. Starting at 146 °C at which N-BTA 3 is in the Colho mesophase, the temperature was successively lowered to a minimum temperature of 13 °C in steps of approximately 10 °C (Fig. 7a). In contrast to the spectrum at ambient conditions, at 146 °C, a single aryl resonance is observed, thus the three aryl protons appear equivalent. On cooling the compound, the single aryl signal first broadens and subsequently splits into three distinct resonances. At 80 °C, the three peaks reach a maximum dispersion and narrow slightly upon further cooling. Besides that, the amide proton resonance gradually shifts from 8.9 to 9.5 ppm at 13 °C, which can be interpreted as a reduction of vibrational N–H bond length fluctuations48,64 suggesting a strengthening of the intermolecular hydrogen bonds upon cooling. In fact, many hydrogen bonded systems exchanging between the hydrogen-bonded and non-bonded state exhibit a similar behavior in combination with temperature dependent variations of the 1H NMR line width.65,66 The exchange analysis of the HNH signal, however, has not been performed, because a significant broadening of the signal has been observed only at the highest temperatures accessible to our NMR hardware and the high temperature narrowing could not be recorded.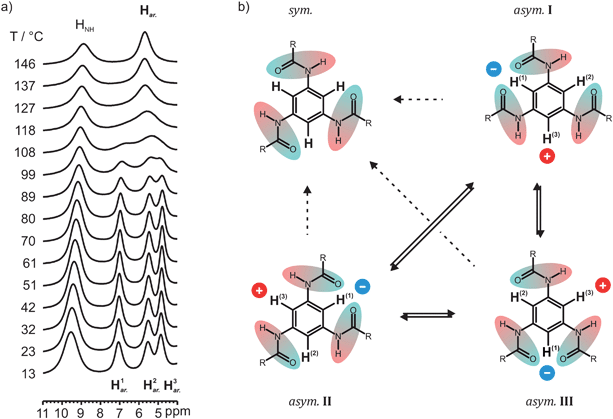 | ||
| Fig. 7 (a) Variable temperature 1H NMR spectra of N-BTA 3 in the low field region from 11 to 4 ppm. (b) Schematic illustration of the two possible mechanisms which would lead to indistinguishable aryl protons in the 1H NMR of N-BTA 3. First, a conversion of asymmetric configurations into a symmetric stack (sym.) with even orientation of hydrogen bonds (dashed arrows). Second, a fast interconversion of three asymmetric configurations asym.I to III (solid arrows). In the second mechanism, the inverted amide group shifts the position, which, in turn, changes the polarization impact on the aryl protons represented by the blue and red dots. It should be noted that the molecules are uniformly hydrogen-bonded and intermolecular shielding effects in the column also affect the bulk chemical shifts. However, other molecules and the explicit representation of hydrogen bonds have been omitted in this figure for clarity. | ||
Two possible mechanisms can be invoked to rationalize the merging of aryl proton lines at higher temperature (Fig. 7b). On the one hand, a gradual transition may occur in which the N-BTA 3 molecules adopt a symmetric bonding scheme with all three hydrogen bonds pointing to the same side of the benzene ring (i.e., similar to the model N-BTA-sym, Fig. 5a). In this case the high-temperature assembly of N-BTA 3 would be similar to the organization of the CO-centered BTAs. On the other hand, the merging might be due to a conversion between equivalent asymmetric arrangements that differ only in the position of the reversed amide group per ring. This rearrangement transforms the three protons species into each other leading to a single, motional averaged NMR signal, provided the kinetics of the process is fast enough. Although the protons are fixed to the molecular frame, this mechanism can be seen as an exchange process since the resonance frequencies of the proton spins are affected by alternating environments of the aryl protons. The latter process can be probed by exchange spectroscopy, accordingly. In this kind of experiment, proton exchange would be indicated by the occurrence of cross-peaks between the chemical shift values of the three presumably exchanging aryl protons. In comparison, a conversion into a symmetric arrangement would not give rise to cross-peaks between the three proton species (for example between H1ar. and H3ar.). An 1H exchange experiment with a mixing time of 3 ms was conducted at 100 °C, a temperature which just allows the observation of distinct aryl proton signals (Fig. 7a). The interpretation of the straightforward 1H exchange experiment, however, is complicated by the existence of a dense proton network and evident spin diffusion. In this case cross-peaks may originate from exchange phenomena as well as from dipolar couplings between the protons. This problem is clearly encountered in Fig. 8a in which cross-peaks indicate polarization transfer even between amide and aryl protons. In order to make the method selective for exchange only and to avoid these ambiguities, a second experiment was performed, applying PMLG decoupling during the entire mixing time of the experiment. This homonuclear decoupling sequence effectively suppresses spin diffusion between the protons and consistently allows the identification of cross-peaks resulting from chemical exchange processes. This is demonstrated by the PMLG-decoupled exchange spectrum recorded at the same temperature (Fig. 8b). Evidently, cross-peaks of amide and aryl protons were prevented, while the cross-peaks of aryl proton sites remain, thus proving the exchange of aryl protons (Fig. 7b, solid arrows).
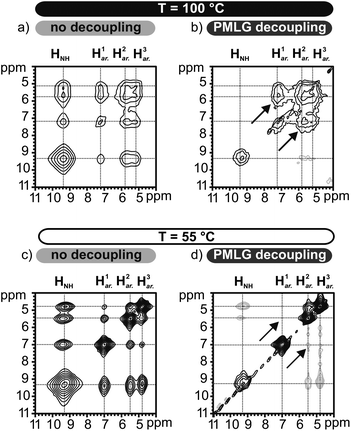 | ||
| Fig. 8 (a–d) Different 1H–1H 2D exchange spectra recorded at 100 °C and at 55 °C. The mixing time was kept constant at 3 ms in all experiments. | ||
For the sake of integrity, both experiments were repeated at 55 °C. The usual exchange experiment without decoupling shows strong cross-peaks between all protons (Fig. 8c), whereas the decoupled experiment does not indicate cross-peaks at all (Fig. 8d). As expected, at lower temperature, the dynamics is slower leading to a spectrum that has not yet been affected by chemical exchange on the time scale of the mixing time (3 ms).
The unambiguously identified exchange process can now be studied in more detail. To this end, the proton line shapes under MAS conditions were analyzed via a homemade MATLAB routine evaluating the modified Bloch equation36 for changes in resonance frequencies and line widths depending on the exchange rate k of the three site exchange process. In addition to the chemical shift values of the three proton signals, the simulation required the apparent T2 relaxation times, which were extracted from the experimental data recorded at ambient temperature using the program DMFIT67 and assumed to be temperature independent. The determined rate constants k provided an Arrhenius activation energy of 82.9 ± 3.9 kJ mol−1 by plotting ln(k) as a function of T−1 (Fig. 9). This value is in good agreement with activation energies of 92 kJ mol−1 and 59 kJ mol−1 found for local reorganization processes of hydrogen bonds of single CO-centered BTA molecules20 as well as other hydrogen bonding stabilized columnar systems.65 It should be noted that the conversion from one asymmetric assembly into another involves a flipping of the amide groups, which requires a breaking and reforming of hydrogen bonds. In this regard, a symmetric transition state with hydrogen bonds pointing in the same direction seems plausible, but could not be verified by means of solid-state NMR. We point out, however, that once the exchange dynamics are fast enough to make the three proton positions equivalent, the alternating asymmetric arrangements can no longer be distinguished from the symmetric arrangement by NMR. This is because in the symmetric model, the NMR calculation yields a chemical shift of 5.8 ppm for aryl protons (Table 1, CPMD (sym.)), which coincides with the average value of the three distinct proton resonances (Table 1, CPMD (asym.)). Thus, a trend towards a symmetric configuration could be possible at higher temperatures. Moreover, the proposed model suggests a transition of extended columnar sections since localized inversions of amide groups give rise to non-bonded defects along the hydrogen bonded column. Possibly, these non-bonded amide protons contribute to the drift of the amide resonance observed in the temperature dependent proton spectra in Fig. 7a. However, this could also be ascribed to the increased hydrogen bond length, hence a general weakening of the hydrogen bonds higher temperatures.
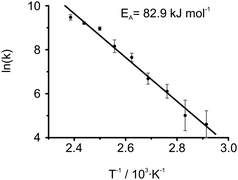 | ||
| Fig. 9 Arrhenius plot of determined rate constants gained by independent line shape analyses of the 1H MAS NMR spectra from 70 °C to 146 °C. The error bars were defined by the limiting values, which clearly over- or underestimated k. Values of k for temperatures below 70 °C have not been used in the fit since further cooling caused only little changes in the spectrum, hence high uncertainties. The uncertainties did not show a significant impact on either the activation energy and or its standard error, thus have been discarded. A non-weighted linear regression yielded an activation energy of 82.9 ± 3.9 kJ mol−1. | ||
Conclusion
In this paper, the local molecular packing of three different benzene-1,3,5-tricarboxamides with either CO-centered or N-centered amide groups have been investigated by means of solid-state NMR as well as extensive Car–Parrinello Molecular Dynamics simulations. It was shown that the 1H NMR spectra vary between the solution and the solid state due to the shielding impact of neighboring molecules and intramolecular polarization effects. Our study demonstrates that solid-state NMR in combination CPMD simulations and DFT calculations of NMR chemical shift is highly suited to elucidate the geometry of supramolecular assemblies. Furthermore, solid-state NMR provided unique insight into the dynamics of the presented N-centered BTA.The signal assignment in the 1H MAS NMR spectra of the BTAs has been achieved by 1H–13C correlation spectroscopy indicating a high-field shift of the aryl proton resonances and a low-field shift of the amide proton resonances. The hydrogen-bond-induced shift offset of up to + 3.1 ppm for the amide protons in the solid compared to the solution indicates strong intermolecular hydrogen bonds between the BTA molecules. For CO-centered BTAs, the high-field shift of the aryl protons can readily be explained on the basis of a calculated NICS map, illustrating the marked shielding effect of neighboring molecules in the columnar assembly. In the N-centered BTA, three distinct proton signals are observed at ambient conditions which gradually merge upon heating, leading to a single resonance at elevated temperatures. The obvious inequality of the aryl protons at ambient temperatures has been addressed by CPMD simulations focusing on the intercolumnar interaction of adjacent BTA molecules. It was found that in contrast to the coplanar symmetric arrangement of the CO-centered BTAs, the N-centered counterpart N-BTA 3 exhibits an asymmetric arrangement with amide groups pointing in opposite directions of the benzene ring. The proposed asymmetric assembly has been supported by the quite good agreement of the calculated and experimental NMR chemical shifts and by a characteristic pattern of dipolar couplings between aryl protons in a DQ–SQ correlation experiment. According to the CPMD simulation, the distinct resonance frequencies of the three aryl protons are due to a combination of intramolecular polarization effects imposed by differently oriented amide groups and position-dependent shieldings of adjacent benzene rings. Within our model, the asymmetric arrangement turned out to be slightly more stable, compared to the symmetric stack, however, the energy differences are probably too small to determine the morphology of the packing directly. Therefore, it must be assumed that the main reasons for the presence of the asymmetric arrangement is due to favorable side chain interactions and an improved intercolumnar packing of the asymmetric stacks.
Finally, VT 1H MAS NMR enabled insight into the dynamics of the N-centered BTA. The merging of the aryl proton resonances at higher temperature was examined by 1H decoupled 1H exchange spectroscopy and could be attributed to a specific exchange dynamics. The mechanism involves a fast conversion between three equivalent asymmetric arrangements, which leads to motional averaging of proton lines starting above 70 °C. A lines shape analysis determined an activation energy of 82.9 ± 3.9 kJ mol−1 for the underlying mechanism.
Acknowledgements
We would like to thank Prof. E. W. Meijer and Carel Fitié for various stimulating discussions as well as Patrick Stals for synthesizing the BTA compounds discussed here. Also, many thanks to Dr Pawel Bednarek from the Informatikdienst der Universität Freiburg (Switzerland) for computational support. This work was financially supported by the DFG in the framework of the SFB 625 and under grant Se 1008/5.References
- B. J. B. Folmer, R. P. Sijbesma, R. M. Versteegen, J. A. J. van der Rijt and E. W. Meijer, Adv. Mater., 2000, 12, 874–878 CrossRef CAS.
- J. A. A. W. Elemans, A. E. Rowan and R. J. M. Nolte, J. Mater. Chem., 2003, 13, 2661–2670 RSC.
- Y. Yamamoto, T. Fukushima, Y. Suna, N. Ishii, A. Saeki, S. Seki, S. Tagawa, M. Taniguchi, T. Kawai and T. Aida, Science, 2006, 314, 1761–1764 CrossRef CAS.
- A. C. Grimsdale and K. Mullen, Angew. Chem., Int. Ed., 2005, 44, 5592–5629 CrossRef CAS.
- V. Percec, M. Glodde, T. K. Bera, Y. Miura, I. Shiyanovskaya, K. D. Singer, V. S. K. Balagurusamy, P. A. Heiney, I. Schnell, A. Rapp, H. W. Spiess, S. D. Hudson and H. Duan, Nature, 2002, 419, 384–387 CrossRef CAS.
- J. D. Hartgerink, E. Beniash and S. I. Stupp, Science, 2001, 294, 1684–1688 CrossRef CAS.
- A. R. A. Palmans, J. A. J. M. Vekemans, H. Fischer, R. A. Hikmet and E. W. Meijer, Chem.–Eur. J., 1997, 3, 300–307 CrossRef CAS.
- R. P. Sijbesma and E. W. Meijer, Curr. Opin. Colloid Interface Sci., 1999, 4, 24–32 CrossRef CAS.
- J. Wu, W. Pisula and K. Muellen, Chem. Rev., 2007, 107, 718–747 CrossRef CAS.
- F. J. M. Hoeben, P. Jonkheijm, E. W. Meijer and A. P. H. J. Schenning, Chem. Rev., 2005, 105, 1491–1546 CrossRef CAS.
- T. F. A. de Greef, M. M. L. Nieuwenhuizen, P. J. M. Stals, C. F. C. Fitie, A. R. A. Palmans, R. P. Sijbesma and E. W. Meijer, Chem. Commun., 2008, 4306–4308 RSC.
- A. R. A. Palmans and E. W. Meijer, Angew. Chem., Int. Ed., 2007, 46, 8948–8968 CrossRef CAS.
- K. Hanabusa, C. Koto, M. Kimura, H. Shirai and A. Kakehi, Chem. Lett., 1997, 5, 429–430 CrossRef.
- M. M. J. Smulders, A. P. H. J. Schenning and E. W. Meijer, J. Am. Chem. Soc., 2008, 130, 606–611 CrossRef CAS.
- P. J. M. Stals, J. C. Everts, R. de Bruijn, I. A. W. Filot, M. M. J. Smulders, R. Martin- Rapun, E. A. Pidko, T. F. A. de Greef, A. R. A. Palmans and E. W. Meijer, Chem. Eur. J, 2010, 16, 810–821 CAS.
- P. J. M. Stals, M. M. J. Smulders, R. Martin-Rapun, A. R. A. Palmans and E. W. Meijer, Chem.–Eur. J., 2009, 15, 2071–2080 CrossRef CAS.
- I. A. W. Filot, A. R. A. Palmans, P. A. J. Hilbers, R. A. van Santen, E. A. Pidko and T. F. A. de Greef, J. Phys. Chem. B, 2010, 114, 13667–13674 CrossRef CAS.
- J. Roosma, T. Mes, P. Leclere, A. R. A. Palmans and E. W. Meijer, J. Am. Chem. Soc., 2008, 130, 1120–1121 CrossRef CAS.
- M. Blomenhofer, S. Ganzleben, D. Hanft, H.-W. Schmidt, M. Kristiansen, P. Smith, K. Stoll, D. Mader and K. Hoffmann, Macromolecules, 2005, 38, 3688–3695 CrossRef CAS.
- C. F. C. Fitié. Hydrogen Bonded Columnar Liquid Crystals for Nanostructured Functional Materials. Ph.D. thesis, TU Eindhoven, 2010 Search PubMed.
- T. Metzroth, A. Hoffmann, R. Martin-Rapun, M. M. J. Smulders, K. Pieterse, A. R. A. Palmans, J. A. J. M. Vekemans, E. W. Meijer, H. W. Spiess and J. Gauss, Chem. Sci., 2011, 2, 69–76 RSC.
- S. P. Brown, Prog. Nucl. Magn. Reson. Spectrosc., 2007, 50, 199–251 CrossRef CAS.
- S. P. Brown and H. W. Spiess, Chem. Rev., 2001, 101, 4125–4155 CrossRef CAS.
- R. Car and M. Parrinello, Phys. Rev. Lett., 1985, 55, 2471–2474 CrossRef CAS.
- J. Hutter and A. Curioni, ChemPhysChem, 2005, 6, 1788–1793 CrossRef CAS.
- X. Feng, V. Marcon, W. Pisula, M. R. Hansen, J. Kirkpatrick, F. Grozema, D. Andrienko, K. Kremer and K. Muellen, Nat. Mater., 2009, 8, 421–426 CrossRef CAS.
- A. Bielecki, A. C. Kolbert and M. H. Levitt, Chem. Phys. Lett., 1989, 155, 341–346 CrossRef CAS.
- C. R. Morcombe and K. W. Zilm, J. Magn. Reson., 2003, 162, 479–486 CrossRef CAS.
- M. Feike, D. E. Demco, R. Graf, J. Gottwald, S. Hafner and H. W. Spiess, J. Magn. Reson., Ser. A, 1996, 122, 214–221 CrossRef CAS.
- I. Schnell and H. W. Spiess, J. Magn. Reson., 2001, 151, 153–227 CrossRef CAS.
- K. Saalwachter, R. Graf and H. W. Spiess, J. Magn. Reson., 1999, 140, 471–476 CrossRef CAS.
- K. Saalwachter, R. Graf and H. W. Spiess, J. Magn. Reson., 2001, 148, 398–418 CrossRef CAS.
- E. Vinogradov, P. K. Madhu and S. Vega, Chem. Phys. Lett., 1999, 314, 443–450 CrossRef CAS.
- M. Leskes, P. K. Madhu and S. Vega, J. Chem. Phys., 2006, 125, 124506 CrossRef.
- D. Marion, M. Ikura, R. Tschudin and A. Bax, J. Magn. Reson, 1989, 85, 393–399 CAS.
- R. R. Ernst; G. Bodenhausen; A. Wokaun. Principles of Nuclear Magnetic Resonance in One and in Two Dimensions, 1st ed.; Oxford University Press, Chapter 2.4.2.1 Search PubMed.
- D. Sebastiani, ChemPhysChem, 2006, 7, 164–175 CrossRef CAS.
- D. Sebastiani and K. N. Kudin, ACS Nano, 2008, 2, 661–668 CrossRef CAS.
- J. Schmidt, A. Hoffmann, H. W. Spiess and D. Sebastiani, J. Phys. Chem. B, 2006, 110, 23204–23210 CrossRef CAS , PMID: 17107166.
- B. G. Pfrommer, F. Mauri and S. G. Louie, J. Am. Chem. Soc., 2000, 122, 123–129 CrossRef CAS.
- M. R. Hansen, R. Graf, S. Sekharan and D. Sebastiani, J. Am. Chem. Soc., 2009, 131, 5251–5256 CrossRef CAS.
- M. Fritzsche, A. Bohle, D. Dudenko, U. Baumeister, D. Sebastiani, G. Richardt, H. W. Spiess, M. R. Hansen and S. Hoeger, Angew. Chem., Int. Ed., 2011, 50, 3030–3033 CrossRef CAS.
- C. Gervais, R. Dupree, K. J. Pike, C. Bonhomme, M. Profeta, C. J. Pickard and F. Mauri, J. Phys. Chem. A, 2005, 109, 6960–6969 CrossRef CAS.
- J. R. Yates, T. N. Pham, C. J. Pickard, F. Mauri, A. M. Amado, A. M. Gil and S. P. Brown, J. Am. Chem. Soc., 2005, 127, 10216–10220 CrossRef CAS.
- J. R. Yates, S. E. Dobbins, C. J. Pickard, F. Mauri, P. Y. Ghi and R. K. Harris, Phys. Chem. Chem. Phys., 2005, 7, 1402–1407 RSC.
- J. M. Griffin, D. R. Martin and S. P. Brown, Angew. Chem., Int. Ed., 2007, 46, 8036–8038 CrossRef CAS.
- K. Bouchmella, S. G. Dutremez, B. Alonso, F. Mauri and C. Gervais, Cryst. Growth Des., 2008, 8, 3941–3950 CAS.
- A. L. Webber, B. Elena, J. M. Griffin, J. R. Yates, T. N. Pham, F. Mauri, C. J. Pickard, A. M. Gil, R. Stein, A. Lesage, L. Emsley and S. P. Brown, Phys. Chem. Chem. Phys., 2010, 12, 6970–6983 RSC.
- D. Kurzbach, A. Sharma, D. Sebastiani, K. W. Klinkhammer and D. Hinderberger, Chem. Sci., 2011, 2, 473–479 RSC.
- D. Sebastiani and M. Parrinello, J. Phys. Chem. A, 2001, 105, 1951–1958 CrossRef CAS.
- D. Sebastiani, G. Goward, I. Schnell and H. W. Spiess, THEOCHEM, 2003, 625, 283–288 CrossRef CAS.
- Hutter et al. , J. Computer code CPMD, version 3.9, 1990-2004. Copyright IBM Corp. and MPI-FKF Stuttgart, http://www.cpmd.org Search PubMed.
- O. A. Von Lilienfeld, I. Tavernelli, U. Rothlisberger and D. Sebastiani, Phys. Rev. Lett., 2004, 93, 153004 CrossRef.
- A. D. Becke, Phys. Rev. A: At., Mol., Opt. Phys., 1988, 38, 3098–3100 CrossRef CAS.
- C. Lee, W. Yang and R. G. Parr, Phys. Rev. B, 1988, 37, 785–789 CrossRef CAS.
- M. P. Lightfoot, F. S. Mair, R. G. Pritchard and J. E. Warren, Chem. Commun., 1999, 1945–1946 RSC.
- K. Yamauchi, S. Kuroki, K. Fujii and I. Ando, Chem. Phys. Lett., 2000, 324, 435–439 CrossRef CAS.
- S. P. Brown, I. Schnell, J. D. Brand, K. Mullen and H. W. Spiess, J. Am. Chem. Soc., 1999, 121, 6712–6718 CrossRef CAS.
- C. Ochsenfeld, S. P. Brown, I. Schnell, J. Gauss and H. W. Spiess, J. Am. Chem. Soc., 2001, 123, 2597–2606 CrossRef CAS.
- G. Brunklaus, A. Koch, D. Sebastiani and H. W. Spiess, Phys. Chem. Chem. Phys., 2007, 9, 4545–4551 RSC.
- G. Goward, D. Sebastiani, I. Schnell and H. W. Spiess, J. Am. Chem. Soc., 2003, 125, 5792–5800 CrossRef CAS.
- J. P. Bradley, C. Tripon, C. Filip and S. P. Brown, Phys. Chem. Chem. Phys., 2009, 11, 6941–6952 RSC.
- M. Deschamps, F. Fayon, S. Cadars, A.-L. Rollet and D. Massiot, Phys. Chem. Chem. Phys., 2011, 13, 8024–8030 RSC.
- J.-N. Dumez and C. J. Pickard, J. Chem. Phys, 2009, 130 CrossRef CAS.
- S. P. Brown, I. Schnell, J. D. Brand, K. Mullen and H. W. Spiess, Phys. Chem. Chem. Phys., 2000, 2, 1735–1745 RSC.
- U. Akbey, S. Granados-Focil, E. B. Coughlin, R. Graf and H. W. Spiess, J. Phys. Chem. B, 2009, 113, 9151–9160 CrossRef CAS.
- D. Massiot, F. Fayon, M. Capron, I. King, S. L. Calve, B. Alonso, J. O. Durand, B. Bujoli, Z. H. Gan and G. Hoatson, Magn. Reson. Chem., 2002, 40, 70–76 CrossRef CAS.
| This journal is © The Royal Society of Chemistry 2011 |
