A new mechanism for the selectivity to C1 and C2 species in the electrochemical reduction of carbon dioxide on copper electrodes
K. J. P.
Schouten
,
Y.
Kwon
,
C. J. M.
van der Ham
,
Z.
Qin
and
M. T. M.
Koper
*
Leiden Institute of Chemistry, Leiden University, PO Box 9502, 2300 RA, Leiden, the Netherlands. E-mail: m.koper@chem.leidenuniv.nl
First published on 21st July 2011
Abstract
We have investigated the reaction mechanism of the electrochemical reduction of carbon dioxide to hydrocarbons on copper electrodes. This reaction occurs via two pathways: a C1 pathway leading to methane, and a C2 pathway leading to ethylene. To identify possible intermediates in the reduction of carbon dioxide we have studied the reduction of small C1 and C2 organic molecules containing oxygen. We followed the formation and consumption of intermediates during the reaction as a function of potential, using online mass spectrometry. For the C1 pathway we show that it is very likely that CHOads is the key intermediate towards the breaking of the C–O bond and, therefore, the formation of methane. For the C2 pathway we suggest that the first step is the formation of a CO dimer, followed by the formation of a surface-bonded enediol or enediolate, or the formation of an oxametallacycle. Both the enediol(ate) and the oxametallacycle would explain the selectivity of the C2 pathway towards ethylene. This new mechanism is significantly different from existing mechanisms but it is the most consistent with the available experimental data.
1 Introduction
The emission of carbon dioxide into the atmosphere due to our combustion of fossil fuels and the decreasing reserves of fossil fuels are forcing us to look for new energy sources and energy carriers. A possible solution would be to find a way to reduce carbon dioxide back to fuels. This would enable a carbon energy cycle, in which renewable energy sources are used to reduce carbon dioxide back to hydrocarbons.1 The main advantage of such a carbon energy cycle compared to, for example, a hydrogen based economy would be that we can keep on using our existing fuel infrastructure, provided the generated fuel is a liquid. One of the most promising ways to reduce carbon dioxide is to do this electrochemically, and to ultimately integrate such a process in a photoelectrochemical device.A landmark discovery in this area was made by Hori in 1985, who found that on copper electrodes carbon dioxide can be reduced to hydrocarbons, mainly ethylene and methane.2 Since then ample research has been performed to characterize and understand this reaction, not in the least by Hori himself.3–7 With the renewed interest in solar fuels, carbon dioxide reduction has become a topical subject of interest again in recent years. In spite of the extensive literature on carbon dioxide reduction on copper electrodes, many aspects of the molecular-level details of the mechanism of this reaction are still unclear.6 It is known that ethylene and methane are formed through a different reaction mechanism and that carbon monoxide is a key intermediate in the formation of both ethylene and methane.3,4,8 The exact reaction mechanism of carbon monoxide reduction to either ethylene or methane is still debated. One of the important remaining questions is what determines the selectivity of the reaction to form first ethylene at relatively low cathodic potentials and, at more negative potentials, methane. Also one would like to determine which intermediates are involved in the pathways to either C1 or C2 species.
To identify possible intermediates in the reduction of carbon dioxide we studied the reduction of small C1 and C2 organic molecules containing oxygen. Previous work using similar strategies has all been performed using long term electrolysis.4,9 However, using online electrochemical mass spectrometry, one can measure the reduction of the various species online while changing the potential and, therefore, follow the formation and consumption of intermediates during the reaction.10–13 The possible intermediates we investigate are formaldehyde, methoxy (methanol at high pH), glyoxal, glycolaldehyde, ethylene glycol, and ethylene oxide. Based on our results, in combination with what is already known about the mechanism from experimental and computational results in the literature, we will propose a new model for the overall reaction mechanism. Especially, our suggested pathway for C2 formation is significantly different from previous proposals. Our mechanism will be compared to existing mechanisms and important remaining issues will be identified.
2 Experimental
All experiments were carried out in an electrochemical cell using a three-electrode assembly at room temperature. The cell and glassware were first cleaned by boiling in a mixture of 1![[thin space (1/6-em)]](https://www.rsc.org/images/entities/char_2009.gif) :1 concentrated sulfuric and nitric acid and before each experiment by boiling in ultra clean water (Millipore MilliQ gradient A10 system, 18.2 MΩ cm). A gold wire was used as counter electrode and a reversible hydrogen electrode (RHE) in the same electrolyte was used as reference electrode. All potentials in this paper are referred to this electrode.
:1 concentrated sulfuric and nitric acid and before each experiment by boiling in ultra clean water (Millipore MilliQ gradient A10 system, 18.2 MΩ cm). A gold wire was used as counter electrode and a reversible hydrogen electrode (RHE) in the same electrolyte was used as reference electrode. All potentials in this paper are referred to this electrode.
The copper electrodes used were 99.999% copper cylinders with a diameter of 5 mm and cut from the same rod (Matek), embedded in Teflon or used in the hanging meniscus configuration. Prior to each experiment the electrode was polished mechanically using alumina pastes with subsequent decreasing particle diameter down to 0.3 μm, after which the electrode was sonicated in ultra pure water. After this mechanical polishing, the electrode was electropolished in a 10:5:2 mixture of H3PO4:H2O:H2SO4 at 2.3 V for two periods of 2 s with an interval of 30 s at open circuit potential.14,15 Blank cyclic voltammograms at a sweep rate of 50 mV s−1 were recorded after each surface preparation until a stable voltammogram was obtained, in order to reduce possible surface oxides created during electropolishing, and to verify a clean state of the surface. The potential was controlled using an Ivium A06075 potentiostat.
The experiments were carried out in 0.1 M K2HPO4 + 0.1 M KH2PO4 (pH 7) prepared from high purity reagents (Merck Suprapur, Sigma-Aldrich TraceSelect) and ultra clean water. Argon (Air Products, 5.0) bubbling was used to de-air the electrolyte. The deactivation of the Cu electrode, as reported in literature during long term electrolysis measurements was not observed, except in the case of CO2 reduction, probably because we are using high purity reagents and are not working at constant negative potentials as is required for the long term electrolysis measurements.16 The CO2 used was of less purity (2.5) so probably contamination, most likely of iron carbonyls, causes the deactivation of the electrode.
Online Electrochemical Mass Spectrometry (OLEMS) was used to detect the gaseous products formed during the reaction. The reaction products at the electrode interface were collected with a small tip positioned close (∼10 μm) to the electrode.17 The tip is a 0.5 mm diameter porous Teflon cylinder with an average pore size of 10–14 μm in a Kel-F holder. This tip is connected to a mass spectrometer with a PEEK capillary. The tip configurations were cleaned in a solution of 0.2 M K2Cr2O7 in 2 M H2SO4 and rinsed with ultra pure water before use. An SEM voltage of 2400 V was used, except for hydrogen (m/z = 2) where an SEM voltage of 1200 V was used. The products were measured while changing the potential of the electrode from 0.0 to −1.0 V and back at 1 mV s−1. Because the equilibration of the pressure in the system after introduction of the tip in the electrolyte takes a very long time, all mass fragments show a small decay during the measurement. We corrected for this background by fitting a double exponential function to the data in the potential regions were no change in activity is observed and subtracted this fit from the data. All mass fragments shown in this paper are background corrected in this way.
Non-volatile reaction products were detected with high-performance liquid chromatography (HPLC). While changing the potential, samples of the electrolyte were collected with a similar tip as used for OLEMS, positioned close to the center of the electrode surface.18 The main difference between this tip and the tip used for OLEMS is that this tip does not have the hydrophobic porous Teflon cylinder, but is instead open to allow electrolyte to pass through. Samples were collected with a rate of 60 μL min−1 and each sample had a volume of 60 μL. Since we changed the potential at 1 mV s−1, each sample contained the average reaction products of a potential change of 60 mV. Samples collected during voltammetry were analyzed afterwards by HPLC (Prominence HPLC, Shimadzu; Aminex HPX 87-H column, Biorad).
3 Results
The reaction products formed during the reduction of saturated CO2 (∼33 mM) and CO (∼1 mM) on copper in a phosphate buffer are shown in Fig. 1, together with the measured current density. From 0.0 V to −0.4 V there is no reduction current for both reduction reactions, nor any product detected by HPLC and OLEMS. From −0.4 V the current increases due to the formation of H2 as can be seen by the increase of m/z = 2 in the mass spectrometer. At lower potentials the H2 formation continues to increase, resulting in the formation of hydrogen gas bubbles starting at −0.6 V which causes the fluctuations in the current below this potential. The amount of hydrogen gas formed is about 10 times lower in the case of CO reduction. At −0.5 and −0.6 V m/z = 26 appears in the mass spectrometer for CO and CO2, respectively. This is C2H+2 and could be a fragment of ethane and ethylene. Since we did not observe a similar increase in m/z = 29 and 30 (fragments of ethane) we could relate this C2H+2 fragment to the formation of ethylene. The absence of ethane formation is in agreement with the earlier results of Hori.5 The amount of ethylene produced from CO2 is about 20 times higher than from CO, mainly caused by the difference in solubility and hence solution concentration of CO and CO2. At −0.8 V m/z = 15 is detected for both reactions. This CH+3 fragment represents the formation of methane. The only non-volatile reaction product measured by HPLC is formic acid, from the reduction of CO2, which is observed at −0.6 V and increases at lower potentials.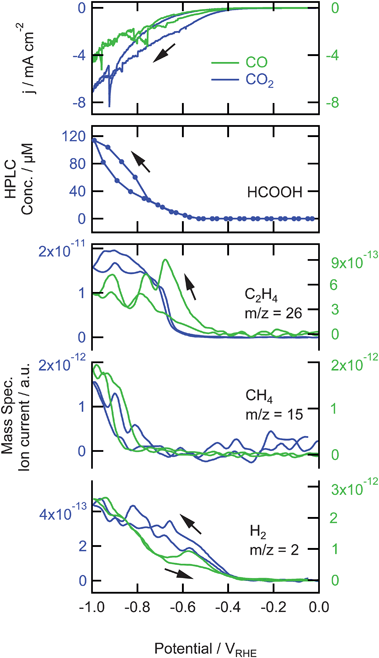 | ||
| Fig. 1 Top: Cyclic voltammograms for the reduction of saturated CO2 (∼33 mM) and CO (∼1 mM) on copper in a phosphate buffer (pH 7) at a scan rate of 1 mV s−1. Middle: associated non-volatile products measured with HPLC. Bottom: associated mass fragments of volatile products measured with OLEMS. Data for CO2 is shown in blue and plotted against the left axis, data for CO is shown in green and plotted against the right axis. | ||
In Fig. 2 the results are shown for the reduction of 0.05 M formaldehyde in the phosphate buffer. The current, shown in the top panel, is larger than the current observed during CO2 reduction which cannot only be explained by the difference in concentration. At −0.3 V m/z = 31 is detected, followed by the formation of H2 at −0.4 V (m/z = 2). Fragment m/z = 31 (CH2OH+) is very typical for alcohols. In this measurement this alcohol is methanol, since no fragments of bigger alcohols are observed. As methanol itself is not reduced on copper electrodes,9,19 it is clear that methanol must be the end product of the reduction of formaldehyde. The formation of methanol shows a small plateau at −0.5 V, becomes stable at −0.7 V and is higher on the back scan. We also measured the other main fragments of methanol, m/z = 15, 29, and 30 as shown in Fig. 3. The signals in this figure are normalized to allow for a direct comparison, which is not possible on the real scale. The normalization was done by dividing each signal (after the background correction) by its highest value, thereby obtaining a signal that has its minimum at 0 and its maximum at 1. It can be seen that m/z = 29, 30, and 31 show the same trend after normalization, which clearly shows that they are fragments of the same molecule. To a large extent, m/z = 15 follows the same trend except at −0.5 V in the negative-going scan and, with a smaller deviation, at −0.4 V in the positive-going scan. This shows that at these potentials a product is formed, different from methanol, with CH+3 as one of its mass fragments. This peak is not found in any mass fragment higher than 15 (m/z = 16 we cannot measure because this is a fragment of water, that dominates the signal). Therefore, this peak must be related to the formation of methane.
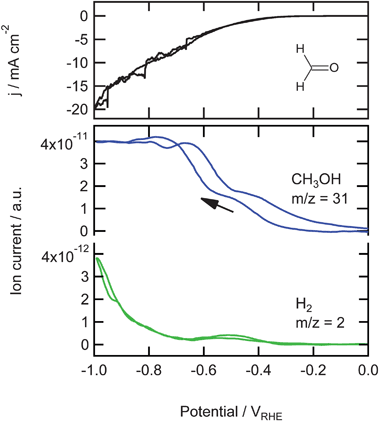 | ||
| Fig. 2 Top: Cyclic voltammogram for the reduction of 0.05 M formaldehyde on copper in a phosphate buffer (pH 7) at a scan rate of 1 mV s−1. Bottom: Associated mass fragments measured with OLEMS. | ||
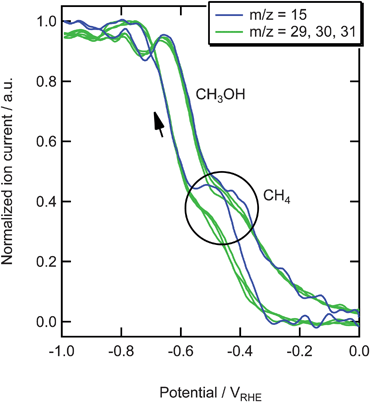 | ||
| Fig. 3 Normalized mass signals for the reduction of 0.05 M formaldehyde on copper in a phosphate buffer (pH 7). | ||
Since DFT calculations suggest methoxy to be the precursor to methane,20 we tried to reduce methanol at high pH. Methanol at high pH will be deprotonated, resulting in the formation of methoxide in solution. However, we did not observe any formation of methane nor any reduction activity.
The results of the reduction of glyoxal ((HCO)2) and glycolaldehyde (OHCCOH) are shown in Fig. 4. The currents, shown in the top panel of this figure, are higher than the current for the reduction of CO2 but lower than for the reduction of formaldehyde. The production of H2 is severely delayed and becomes only significant at −0.7 V. The peak in H2 production at −0.55 V observed during the reduction of CO and formaldehyde is much smaller for glyoxal reduction and not observed for the glycolaldehyde reduction. For both reactions, at −0.35 V the formation of a reduction product with one of its main fragments at m/z = 29 is observed. This mass fragment shows two reproducible peaks at −0.5 V and −0.7 V. These peaks are also observed in the back scan, but at lower potentials. The intensity of the signal is also lower in the back scan. Mass fragments m/z = 41 and 44 (data not shown) showed the same trend as m/z = 29 and from the relative intensities it was clear that acetaldehyde is formed here. At −0.6 V the formation of an alcohol starts, as shown by the increase of m/z = 31. The formation of this alcohol is higher in the positive going scan. Mass fragment m/z = 46 (C2H5OH+, data not shown) showed the same trend as m/z = 31, which means that the alcohol formed here is ethanol. This clearly shows that both glyoxal and glycolaldehyde are first reduced to acetaldehyde starting at −0.35 V, which is then further reduced to ethanol at −0.6 V. Only during the reduction of glycolaldehyde did we observe bigger mass fragments, m/z = 57, 62, and 70, which are indicative of C4 species (only m/z = 57 is shown). These fragments are not observed during the reduction of glyoxal. The most likely candidates, if we assume that this C4 species is formed by the combination of two reaction products or intermediates of glycolaldehyde, are 1,4-butanediol (m/z = 57, 62) and 1,4-butenediol (m/z = 57, 70).
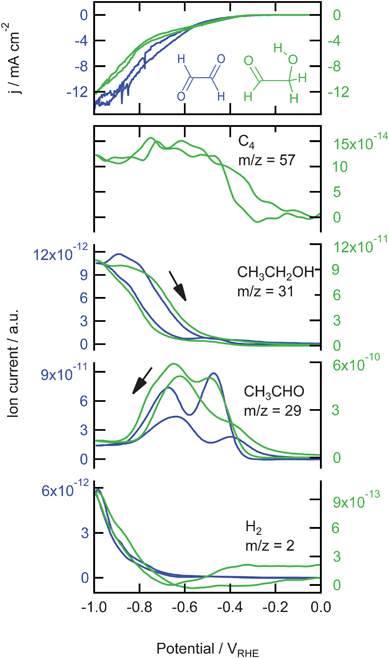 | ||
| Fig. 4 Top: Cyclic voltammograms for the reduction of 0.05 M glyoxal and 0.05 M glycolaldehyde on copper in a phosphate buffer (pH 7) at a scan rate of 1 mV s−1. Bottom: Associated mass fragments measured with OLEMS. Data for glyoxal is shown in blue and plotted against the left axis, data for glycolaldehyde is shown in green and plotted against the right axis. | ||
Another interesting molecule to reduce, if we consider that glyoxal and glycolaldehyde both are reduced to ethanol, is ethylene glycol. We tried to reduce 0.05 M ethylene glycol in 0.1 M phosphate buffer but did not observe any reduction product. We also tried oxalic acid, but did not observe any reduction products either.
The possible formation of an epoxide as the intermediate in the formation of ethylene was investigated by the reduction of ethylene oxide, the results of which are shown in Fig. 5. The exact concentration was unknown since ethylene oxide is highly soluble in water but it was dosed as gas bubbles in the solution. We followed the increase of ethylene oxide concentration with OLEMS during dosing and after a significant increase we stopped bubbling and started the reduction. During the reduction, the formation of hydrogen (m/z = 2) was lower compared to the other measurements (10−13vs. 10−12) and showed a peak at −0.55 V as observed before in the other measurements. Around −0.5 V we observe an increase in m/z = 26. We only observed the same increase in m/z = 27 (not shown), indicating that the product formed here is ethylene. The other mass fragments measured (m/z = 15, 29–31, 43–45) also increased (data not shown) but with relative intensities that were exactly the same as observed during the dosing of ethylene oxide, which means that with the formation of (gas bubbles of) hydrogen and ethylene at the electrode, ethylene oxide from the solution also enters the tip of the OLEMS. In the positive going scan the formation of m/z = 26 is higher than the negative going scan and disappears around −0.3 V.
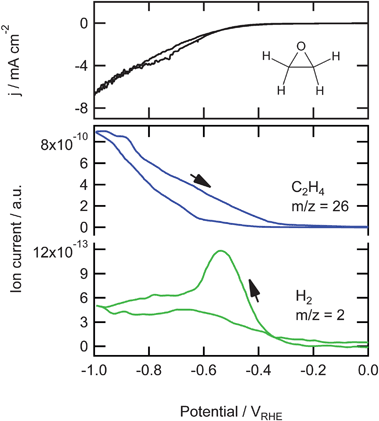 | ||
| Fig. 5 Top: Cyclic voltammogram for the reduction of ethylene oxide on copper in a phosphate buffer (pH 7) at a scan rate of 1 mV s−1. Bottom: Associated mass fragments measured with OLEMS. | ||
4 Discussion
4.1 Hydrogen and hydrogenation
From Fig. 1 it is clear that, when lowering the potential at the copper electrode in a CO2 or CO saturated solution at pH 7, first hydrogen gas is formed from water. Then, at −0.5 V and −0.6 V ethylene is formed from CO and CO2, respectively, and finally at −0.8 V methane is formed. The currents are mainly determined by the water reduction and do not give any specific information about the reduction reactions. The currents observed during the reduction of the other organic molecules are all higher than the current observed during the CO and CO2 reduction. The current of the CO reduction is most likely the lowest because the concentration of CO (∼1 mM) is much lower than the concentrations of the other species (0.05 M). The concentration of ethylene oxide might be even higher, since the observed intensity of m/z = 26 is higher (10−10vs. 10−11) and the hydrogen production lower (10−13vs. 10−12) compared to the other measurements at 0.05 M. The current for the reduction of CO2 is most likely lower because CO2 is a very stable molecule and, therefore, hard to reduce as appears from the observations that the rate determining step in the overall CO2 reduction is the first electron transfer.6In almost all cases there is a peak in the hydrogen production around −0.55 V. It is also around this potential that, for all reductions performed in this study, the first reduction products are measured. From this we can conclude that, as might be expected since we are hydrogenating small organic molecules, there is a relation between the hydrogen concentration or hydrogen coverage at the surface and the reduction reaction taking place. Previous research also showed the relation between the hydrogen and carbon monoxide adsorption at the electrode as a function of potential. It is known that the hydrogen evolution is suppressed by CO adsorption, i.e. the surface is blocked by CO.6,21 This could also explain the lower currents observed during the reduction of CO and CO2, since the current is mainly determined by the hydrogen evolution, which is partly blocked by the presence of CO. The adsorption of CO has also been suggested to be accompanied by hydrogen, resulting in the formation of a surface hydridocarbonyl complex.8
4.2 The C1 pathway: route to methane
From Fig. 2 and 3 we can conclude that formaldehyde is not an intermediate in the reduction of carbon dioxide, since its main reduction product is methanol which is not a product observed during the reduction of carbon dioxide. We can exclude that the methanol is formed by a chemical, so-called Cannizzaro, reaction.22,23 In this reaction, aldehydes without an α-hydrogen such as formaldehyde, are disproportionated into a carboxylic acid and an alcohol. Since we do not observe formic acid with HPLC during formaldehyde reduction, methanol must be formed by the electrochemical reduction of formaldehyde.The observed peak in m/z = 15 around −0.5 V during the reduction of formaldehyde can only be explained by the formation of methane, since no larger mass fragments are observed. This is in agreement with the literature, in which the formation of small amounts of methane during the reduction of formaldehyde using long term electrolysis has been observed.4,9,24 These and our results indicate the presence of an intermediate related to formaldehyde which can be reduced to methane. The most likely candidate for this intermediate is formyl (CHOads).
Formyl has been studied in detail because of its importance for the mechanism of the Fischer–Tropsch process. From these studies it is known that with formaldehyde in solution formyl is formed.9,25 In addition, quantum chemical calculations have been performed on adsorbed CO and formyl to elucidate the mechanism of the Fischer–Tropsch process. These calculations show that on Co and Ru, the most frequently used metals for this process, the dissociation of adsorbed carbon monoxide can be activated by the assistance of hydrogen, i.e. through the formation of formyl.26–29 This, so-called “hydrogen assisted CO activation”, is only the optimum pathway on flat surfaces whereas at defects on the surface the direct dissociation of CO is favored. Recently, density functional theory (DFT) calculations of CO on Cu(100) performed in our research group showed that also on Cu(100) the C–O bond breaking in adsorbed carbon monoxide may be facilitated by the formation of formyl.30
These DFT calculations also suggest that there will be a relation between the surface structure of the copper electrodes and the mechanism of the CO reduction. This is in agreement with the work of Hori et al. on Cu single crystals, which showed that on the Cu(100) surface more ethylene is formed whereas the Cu(111) surface produces more methane.31 Moreover, with the introduction of steps in Cu(111) and, to a lesser extent in Cu(100), ethylene becomes the major product. Therefore, one could speculate that the formation of methane through the indirect dissociation of CO is likely to happen on atomically flat (111) parts of the electrode or steps and defects in such a surface, whereas ethylene will be formed at (100) sites, and (100)-type defects in the (111) terraces. We are currently studying this issue in more detail using copper single crystals.
Using DFT, Peterson et al. suggested that the key “potential-determining” step in the formation of both methane and ethylene is the hydrogenation of adsorbed CO to form CHOads.20 Although we do not have any experimental proof that CHOads is the precursor to ethylene, these calculations support our suggestion that CHOads is the intermediate in the formation of methane. These calculations, on the other hand, also suggest that the energetically favored route to methane is through adsorbed formaldehyde and methoxy. This appears in conflict with the experimental observations that the main reduction product of formaldehyde is methanol and that methoxy cannot be reduced to methane on copper electrodes.
Since the reduction of CO does not result in the formation of methanol whereas the reduction of formaldehyde does, there must be a precursor formed during the reduction of formaldehyde that is not formed during the reduction of CO, which can be further reduced to methanol. We suggest that the formation of CHOads lowers the energy needed to break the C–O bond and, therefore, facilitates the formation of methane. The pathway to methanol, in which the C–O bond is kept intact, will then probably occur via CH2OHads because formaldehyde already has two hydrogen atoms bonded to the carbon and, therefore, CH2OHads only needs to be protonated to form methanol.24,32,33 These two pathways are shown in the top part of Fig. 6. In this figure, we suggest that CHOads is the intermediate that leads to methane, whereas CH2OHads leads to the formation of methanol.
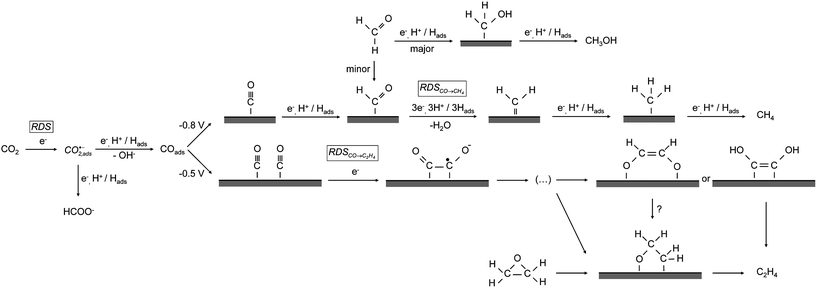 | ||
| Fig. 6 Proposed mechanism for the electrochemical reduction of carbon dioxide on copper. | ||
It is interesting to compare our mechanism for the electrochemical reduction of carbon dioxide to the mechanism proposed for the methanol synthesis process, for which a copper based (Cu/ZnO/Al2O3) catalyst is used. Methanol, however, is not observed during the electrochemical reduction of CO2. This indicates that the C–O bond is broken early in the electrochemical reaction mechanism. In the case of methanol synthesis, it is generally accepted that formate is the key intermediate to methanol.34,35 This formate is further reduced to formaldehyde and finally to methanol. The latter reaction also takes place under electrochemical conditions, but the former does not. We speculate that the inactivity of formate to being further reduced in our experiments could be primarily due to the lower temperature, lower pressure, and different catalyst properties compared to methanol synthesis, but clearly this subject would require further scrutiny.
If we compare our route to methane to the mechanism proposed by Hori, we observe that the routes to methane are quite similar.4 Hori et al. also proposed that, in agreement with our findings, CO is protonated before the C–O bond is broken. However, they suggest the “hypothetical intermediate COH” is the precursor to methane. We have shown that it is more likely that this intermediate is CHO.
4.3 The C2 pathway: route to ethylene
To find intermediates in the reduction of carbon monoxide to ethylene we investigated the reduction of C2 species containing one or two oxygen atoms. Comparing the reduction of C2 species containing two oxygen atoms, namely glyoxal and glycolaldehyde (Fig. 4) and ethylene glycol (data not shown), we observe that glyoxal and glycolaldehyde are reduced to acetaldehyde. Ethylene glycol cannot be reduced at all. Acetaldehyde is reduced to ethanol, which is in agreement with previous work.4 From these measurements we can conclude that neither glyoxal or glycolaldehyde is an intermediate in the reduction of carbon monoxide, since their reduction products, acetaldehyde and ethanol, are not observed during CO2 reduction.The difference in reducibility between the various C2 species can partly be explained by the various adsorption geometries. It is known that both glyoxal and glycolaldehyde are adsorbed on platinum with one or two carbons bonded to the surface, depending on the coverage.36,37Ethanol and acetaldehyde, on the other hand, are adsorbed with the oxygen towards the surface.38–41 This indicates that for the breaking of the C–O bond the carbon atom needs to be coordinated to the surface. However, this does not explain why ethylene glycol cannot be reduced since it is known to also adsorb with the carbon atoms to the surface.42
A more consistent explanation is that the breaking of a C–O or C–OH bond is only possible if the next (α) carbon is an aldehyde. If the α-carbon is an alcohol the bond remains intact. If the α-carbon is a methyl group (acetaldehyde, ethanol), the C–O bond cannot be broken but only reduced to an alcohol. The chemical environment of the C–O bond within the molecule, therefore, appears to be very important for the activation of the C–O bond.
Another important observation is that the C–O bonds for both the aldehyde in glyoxal and the alcohol in glycolaldehyde are broken at the same potential, which suggest that it is in fact the alcohol in which the C–O bond breaking occurs. One of the aldehydes of glyoxal is probably reduced to an alcohol first and this intermediate is directly further reduced to acetaldehyde by C–OH bond breaking.
Fig. 4 shows that only during the reduction of glycolaldehyde a very small amount of C4 species is formed. The reason that a C–C bond can only be formed between glycolaldehyde molecules might be that it is mostly in the cis-configuration whereas both ethylene glycol and glyoxal are mostly in the trans-configuration. This cis-configuration could cause an adsorption configuration where two glycolaldehyde molecules can adsorb close to each other, which makes the formation of a C–C bond more feasible. For the trans-isomers the formation of the C–C bond would then be sterically hindered by the oxygen atoms.
The final possible intermediate in the reduction of carbon dioxide we studied was ethylene oxide (Fig. 5). The only product observed is ethylene, no alcohols or aldehydes. The potential range in which ethylene is formed is in very good agreement with the potential range where ethylene is formed from CO, shown in Fig. 1. This suggests that an epoxide is a possible intermediate in the CO reduction to ethylene. However, ethylene oxide itself is never observed as a reduction product of CO or CO2. Therefore, we propose adsorbed ethylene oxide to be a possible intermediate in the reduction of CO. Strongly adsorbed epoxide, in the form of an oxametallacycle, is a possible precursor to ethylene formation, and thereby a possible intermediate in the CO2 reduction to ethylene. These oxametallacycles are known as key intermediates in the ethylene epoxidation.43,44 We have attempted to ‘trap’ such oxametallacycle intermediates by quickly transferring a copper electrode from an ethylene oxide-containing solution to a clean solution, but without success. Presumably, it is very unstable.
Although we now have a hint for a possible intermediate for the formation of ethylene from CO, we still do not know how the C–C bond is formed. Hori et al. suggested two routes to ethylene: the combination of two adsorbed CH2 species, and a Fischer–Tropsch like combination of adsorbed CH2 and CO (‘CO insertion’). The latter route results in the formation of CHxCO species. However, of the CHxCO species we tried only ethylene oxide resulted in the formation of ethylene, suggesting that it is a different mechanism that leads to the formation of ethylene.
It is very likely that the C–C bond is formed very early in the reaction in a pathway separate from methane production. Two important indications for this are that (i) it is known that for the formation of ethylene from CO the rate determining step (RDS) is the first electron transfer (whereas the second electron transfer is the RDS for methane formation), and (ii) the ethylene formation pathway is pH independent whereas the methane formation pathway involves a proton in or before the RDS.4 Therefore, the pH-independent RDS for ethylene formation is probably the formation of the C–C bond. We suggest that the C–C bond is formed by the formation of a dimer of two CO molecules, and that this dimer is the first intermediate to the formation of ethylene. This CO dimer was also proposed as an intermediate to ethylene by Gattrell et al.6
Dimer formation is well known and accepted in the reduction of NO, a molecule similar to though more reactive than CO. The involvement of NO dimer formation has been evidenced for NO reduction to N2O in the gas-phase heterogeneous catalysis literature45,46 as well as in the electrochemical literature.47,48 A potential link in mechanism between CO and N2reduction has also been suggested by Lee et al.49
The next important step in the reduction of the dimer, the breaking of the first C–O bond, may happen in analogy with the reduction of glyoxal and glycolaldehyde, where –OH is shown to be the leaving group if the α-carbon is an aldehyde. Since we show that ethylene oxide reduction only results in ethylene, we suggest that the remaining intermediate is an oxametallacycle. This leads to the pathway shown in Fig. 6.
Another possibility, shown in Fig. 6, is that the C![[double bond, length as m-dash]](https://www.rsc.org/images/entities/char_e001.gif) C double bond in ethylene is formed by so-called McMurry coupling.50,51 In the McMurry reaction a reducing agent is used to make a bond between two carbonyl groups. This reducing agent, which would be the copper surface in our reaction, creates carbonyl radicals which react to form a CC bond. The next step is the removal of the oxygen atoms by the reducing agent, with a double CC bond as the end product. Since we have ethylene as the main C2 product, a McMurry-like reaction would very well explain the observed selectivity towards ethylene. The distinguishing feature of the McMurry mechanism is that the CC bond is formed before C–O bond breaking, leading to an enediol or enediolate intermediate. Such a McMurry mechanism has, for example, been observed during the coupling of carbon monoxide to acetylene and ethylene on UO2(111) surfaces as well as uranium complexes.52,53 In these studies it has been shown that an enediolate is formed from CO and hydrogen, which reacts to form acetylene and ethylene. In addition, it is known that enediols can be formed by the reduction of α-dicarbonyl species, e.g. as happens in the reduction of quinone to catechol.54,55 Therefore, we propose the enediol or enediolate as a possible intermediate to ethylene in Fig. 6.
C double bond in ethylene is formed by so-called McMurry coupling.50,51 In the McMurry reaction a reducing agent is used to make a bond between two carbonyl groups. This reducing agent, which would be the copper surface in our reaction, creates carbonyl radicals which react to form a CC bond. The next step is the removal of the oxygen atoms by the reducing agent, with a double CC bond as the end product. Since we have ethylene as the main C2 product, a McMurry-like reaction would very well explain the observed selectivity towards ethylene. The distinguishing feature of the McMurry mechanism is that the CC bond is formed before C–O bond breaking, leading to an enediol or enediolate intermediate. Such a McMurry mechanism has, for example, been observed during the coupling of carbon monoxide to acetylene and ethylene on UO2(111) surfaces as well as uranium complexes.52,53 In these studies it has been shown that an enediolate is formed from CO and hydrogen, which reacts to form acetylene and ethylene. In addition, it is known that enediols can be formed by the reduction of α-dicarbonyl species, e.g. as happens in the reduction of quinone to catechol.54,55 Therefore, we propose the enediol or enediolate as a possible intermediate to ethylene in Fig. 6.
4.4 General discussion
The mechanism proposed in Fig. 6 is based on our experimental results combined with the mechanisms suggested in literature.4,6,9 The overall RDS in the reduction of CO2 is the first electron transfer to form CO·−2,ads6 This intermediate then reacts further to form CO or formate, the latter being a dead-end in the reaction mechanism.6,24CO is further reduced to hydrocarbonsvia two pathways, a C1 and a C2 pathway, with the overall product distribution being determined by the relative importance of the local RDS within each pathway.The mechanism incorporates the important results by Hori et al. who showed that for the formation of ethylene from CO the first electron transfer is the RDS and is uncoupled from proton transfer, whereas for methane the RDS is after the first electron transfer and includes a proton transfer step.4 In our mechanism the RDS to form ethylene would be the formation of the CO dimer accompanied by the first electron transfer, and the RDS to form methane is the breaking of the C–O bond in the formyl intermediate.
In many of the older mechanistic papers on CO2 reduction, surface carbene (CH2,ads) was considered as the key intermediate in the formation of both CH4 and C2H4. Such a mechanism is in disagreement with the above-mentioned results of Hori et al.4 and also does not easily explain why ethylene is the only multiple-carbon compound observed as a product. Hori et al. proposed a CO-insertion type mechanism (i.e. a coupling between CHx and CO) as an alternative pathway, but again such a mechanism does not easily explain why ethylene is the only observed carbon–carbon coupling product. Peterson et al. suggest formyl as the intermediate to both methane and ethylene, though no explicit pathway was suggested for ethylene formation.20 We believe that one of the very attractive features of the model suggested here is that it easily explains why C2 products are the main coupling products (due to dimerization) and why ethylene is the only product (through an oxametallacycle or enediol-type intermediate). It appears to us that, at present, the mechanism suggested in Fig. 6 is the most consistent with the experimental data.
5 Conclusions
This paper has introduced a new mechanism for the electrochemical reduction of carbon dioxide on copper electrodes. We have shown that it is very likely that CHOads is the key intermediate towards the breaking of the C–O bond and, therefore, the formation of methane. For the formation of ethylene we suggest that the first step is the formation of a CO dimer, followed by the formation of an enediol or enediolate, or the formation of an oxametallacycle as can be concluded from the reduction of ethylene oxide. In contrast to previous proposed Fischer–Tropsch like mechanisms, both the enediol(ate) and the oxametallacycle would explain well the experimentally observed selectivity of the C2 pathway towards ethylene. Further in situspectroscopy experiments and DFT calculations to study the proposed mechanism are currently under way.Acknowledgements
This work was supported by the (Dutch) National Research School Combination - Catalysis (NRSC-C). We acknowledge helpful discussions with Prof. Dr. G. van de Marel and Prof. Dr. H.S. Overkleeft. The work of Y.K. has been performed within the framework of the CatchBio program, and is funded by the Smart Mix Program of the Netherlands Ministry of Economic Affairs and the Netherlands Ministry of Education, Culture and Science.References
- M. Gattrell, N. Gupta and A. Co, Energy Convers. Manage., 2007, 48, 1255–1265 CrossRef CAS.
- Y. Hori, K. Kikuchi and S. Suzuki, Chem. Lett., 1985, 11, 1695–1698 CrossRef.
- Y. Hori, A. Murata, R. Takahashi and S. Suzuki, J. Am. Chem. Soc., 1987, 109, 5022–5023 CrossRef CAS.
- Y. Hori, R. Takahashi, Y. Yoshinami and A. Murata, J. Phys. Chem. B, 1997, 101, 7075–7081 CrossRef CAS.
- Y. Hori, in Modern Aspects of Electrochemistry, ed. C. G. Vayenas, R. E. White and M. E. Gamboa-Aldeco, Springer, New York, 2008, vol. 42, pp. 89–189 Search PubMed.
- M. Gattrell, N. Gupta and A. Co, J. Electroanal. Chem., 2006, 594, 1–19 CrossRef CAS.
- K. W. Frese, in Electochemical and electrocatalytic reactions of carbon dioxide, ed. B. P. Sullivan, K. Krist and H. E. Guard, Elsevier, Amsterdam, 1993, pp. 145–216 Search PubMed.
- Y. Hori, A. Murata, T. Tsukamoto, H. Wakebe, O. Koga and H. Yamazaki, Electrochim. Acta, 1994, 39, 2495–2500 CrossRef CAS.
- D. DeWulf, T. Jin and A. Bard, J. Electrochem. Soc., 1989, 136, 1686–1691 CrossRef CAS.
- S. Wasmus, E. Cattaneo and W. Vielstich, Electrochim. Acta, 1990, 35, 771–775 CrossRef CAS.
- P. Friebe, P. Bogdanoff, N. Alonso-Vante and H. Tributsch, J. Catal., 1997, 168, 374–385 CrossRef CAS.
- G. M. Brisard, A. P. M. Camargo, F. C. Nart and T. Iwasita, Electrochem. Commun., 2001, 3, 603–607 CrossRef CAS.
- P. Dubé and G. Brisard, J. Electroanal. Chem., 2005, 582, 230–240 CrossRef CAS.
- H. Siegenthaler and K. Jüttner, J. Electroanal. Chem., 1984, 163, 327–343 CAS.
- B. Cruickshank, D. D. Sneddon and A. A. Gewirth, Surf. Sci. Lett., 1993, 281, 308–314 Search PubMed.
- Y. Hori, H. Konishi, T. Futamura, A. Murata, O. Koga, H. Sakurai and K. Oguma, Electrochim. Acta, 2005, 50, 5354–5369 CrossRef CAS.
- A. H. Wonders, T. H. M. Housmans, V. Rosca and M. T. M. Koper, J. Appl. Electrochem., 2006, 36, 1215–1221 CrossRef CAS.
- Y. Kwon and M. T. M. Koper, Anal. Chem., 2010, 82, 5420–5424 CrossRef.
- S. Kaneco, H. Katsumata, T. Suzuki and K. Ohta, Energy Fuels, 2006, 20, 409–414 CrossRef CAS.
- A. A. Peterson, F. Abild-Pedersen, F. Studt, J. Rossmeisl and J. K. Norskov, Energy Environ. Sci., 2010, 3, 1311–1315 RSC.
- Y. Hori, A. Murata and Y. Yoshinami, J. Chem. Soc., Faraday Trans., 1991, 87, 125–128 RSC.
- S. Cannizzaro, Liebigs Ann., 1853, 88, 129–130 Search PubMed.
- R. C. Elderfield, J. Chem. Educ., 1930, 7, 594–596 CrossRef CAS.
- R. L. Cook, R. C. MacDuff and A. F. Sammells, J. Electrochem. Soc., 1989, 136, 1982–1984 CrossRef CAS.
- J. A. Gladysz and W. Tam, J. Am. Chem. Soc., 1978, 100, 2545–2547 CrossRef CAS.
- I. M. Ciobica and R. A. van Santen, J. Phys. Chem. B, 2003, 107, 3808–3812 CrossRef CAS.
- O. R. Inderwildi, S. J. Jenkins and D. A. King, J. Phys. Chem. C, 2008, 112, 1305–1307 CrossRef CAS.
- S. Shetty, A. P. J. Jansen and R. A. van Santen, J. Am. Chem. Soc., 2009, 131, 12874–12875 CrossRef CAS.
- S. Shetty and R. A. van Santen, Phys. Chem. Chem. Phys., 2010, 12, 6330–6332 RSC.
- A. Koverga, D. Wallace and M. T. M. Koper, in preparation.
- Y. Hori, I. Takahashi, O. Koga and N. Hoshi, J. Mol. Catal. A: Chem., 2003, 199, 39–47 CrossRef CAS.
- S. Clarke and J. Harrison, J. Electroanal. Chem., 1972, 36, 109–115 CrossRef CAS.
- S. Omanović and M. Metikoš-Huković, J. Appl. Electrochem., 1997, 27, 35–41 CrossRef CAS.
- M. Bowker, R. A. Hadden, H. Houghton, J. N. K. Hyland and K. C. Waugh, J. Catal., 1988, 109, 263–273 CrossRef CAS.
- H. Nakatsuji and Z.-M. Hu, Int. J. Quantum Chem., 2000, 77, 341–349 CrossRef CAS.
- L. Formaro and G. Castelli, J. Electroanal. Chem., 1970, 28, 363–374 CrossRef.
- S. Trasatti and L. Formaro, J. Electroanal. Chem., 1968, 17, 343–364 CrossRef CAS.
- M. A. Henderson, Y. Zhou and J. M. White, J. Am. Chem. Soc., 1989, 111, 1185–1193 CrossRef.
- T. Shimada, K. Sakata, T. Homma, H. Nakai and T. Osaka, Electrochim. Acta, 2005, 51, 906–915 CrossRef CAS.
- A. F. Lee, D. E. Gawthrope, N. J. Hart and K. Wilson, Surf. Sci., 2004, 548, 200–208 CrossRef CAS.
- R. Alcalá, M. Mavrikakis and J. A. Dumesic, J. Catal., 2003, 218, 178–190 CrossRef CAS.
- F. Kadirgan, B. Beden and C. Lamy, J. Electroanal. Chem. Interfac., 1982, 136, 119–138 Search PubMed.
- J. T. Jankowiak and M. A. Barteau, J. Catal., 2005, 236, 379–386 CrossRef CAS.
- S. Linic and M. A. Barteau, J. Am. Chem. Soc., 2003, 125, 4034–4035 CrossRef CAS.
- W. A. Brown and D. A. King, J. Phys. Chem. B, 2000, 104, 2578–2595 CrossRef CAS.
- R. Burch, S. T. Daniells and P. Hu, J. Chem. Phys., 2004, 121, 2737–2745 CrossRef CAS.
- A. C. A. de Vooys, M. T. M. Koper, R. A. van Santen and J. A. R. van Veen, Electrochim. Acta, 2001, 46, 923–930 CrossRef CAS.
- A. C. A. de Vooys, M. T. M. Koper, R. A. van Santen and J. A. R. van Veen, J. Catal., 2001, 202, 387–394 CrossRef CAS.
- C. C. Lee, Y. Hu and M. W. Ribbe, Science, 2010, 329, 642 CrossRef CAS.
- J. E. McMurry and M. P. Fleming, J. Am. Chem. Soc., 1974, 96, 4708–4709 CrossRef CAS.
- M. Ephritikhine, Chem. Commun., 1998, 2549–2554 RSC.
- S. D. Senanayake, G. I. N. Waterhouse, H. Idriss and T. E. Madey, Langmuir, 2005, 21, 11141–11145 CrossRef CAS.
- P. L. Arnold, Z. R. Turner, R. M. Bellabarba and R. P. Tooze, Chem. Sci., 2011, 2, 77–79 RSC.
- M. Montoya and J. Mellado, J. Electroanal. Chem., 1994, 371, 215–221 CrossRef CAS.
- D. Nematollahi and M. Rafiee, J. Electroanal. Chem., 2004, 566, 31–37 CrossRef CAS.
| This journal is © The Royal Society of Chemistry 2011 |