A transient kinetic study between signaling proteins: the case of the MEK–ERK interaction
Nadia
Barbero†
*a,
Lucia
Napione†
*b,
Sonja
Visentin
c,
Maria
Alvaro
b,
Andrea
Veglio‡
b,
Federico
Bussolino
b and
Guido
Viscardi
a
aDepartment of General Chemistry and Organic Chemistry and NIS, Interdepartmental Centre of Excellence, University of Torino, Corso M. d'Azeglio 48, 10125, Torino, Italy. E-mail: nadia.barbero@unito.it; Fax: +39-011-236-7596; Tel: +39-011-670-7596
bDepartment of Oncological Sciences, Institute for Cancer Research and Treatment, University of Torino, Strada Provinciale 142, Km 3.95, 10060, Candiolo, TO, Italy. E-mail: lucia.napione @unito.it; Fax: +39 011-9933524; Tel: +39 011-9933507
cDepartment of Drug Science and Technology, University of Torino, Via P. Giuria 9, 10125, Torino, Italy
First published on 30th June 2011
Abstract
MEK and ERK are central components of the mitogen-activated protein kinase pathway. However, an accurate interaction has never been studied and accurate binding constants of the binary interaction have never been directly measured. In the present work, we studied the interaction between MEK and ERK by stopped-flow fluorescence intensity and evaluated the association and dissociation rate constants (kon and koff) from the kinetic study. We compared the results obtained by using commercial and homemade protein productions. The dissociation binding constant (Kd) value determined for the binding of MEK to ERK is in good agreement with the values obtained from the analysis of the kinase enzymatic reaction in previous in vitro studies.
1. Introduction
In the last two decades, biological research has been focused on the exploration of the basis of cell regulation and function at the molecular level. We now know that cell responses to external stimuli are determined by intricate intracellular signaling networks, which are composed of biochemical pathways that are essentially based on protein interactions. Despite the considerable progress that has been made, it is apparent that the flow of biological information has not yet been fully deciphered. In particular, the abundance of information, concerning interacting cellular components, needs to be improved to gain sufficient availability of quantitative data. In this context, the setup of new approaches to provide high quality data in terms of the determination of kinetic parameters is needed. This is of special interest to systems biologists, who deal with the development of kinetic models of intracellular signal transduction and often suffer from a lack of available kinetic parameters.The central building blocks of intracellular signalling networks are the mitogen-activated protein kinase (MAPK) cascades, which are critical for making the cellular decision to proliferate, differentiate or undergo apoptosis.1–3MAPK cascades are comprised of several sets of cytoplasmic protein kinases organized into modular pathways. The activation of upstream kinases by cell surface receptors leads to sequential activation of an evolutionarily conserved core module of protein kinases (MAPKKK → MAPKK → MAPK).4 The most widely characterized mammalian MAPK cascade is the Raf—MEK—ERK axis (Fig. 1), along which multiple isoforms are present at each level. Among them, two highly related isoforms, MEK1/2 and ERK1/2, play a primary role in signal transduction.
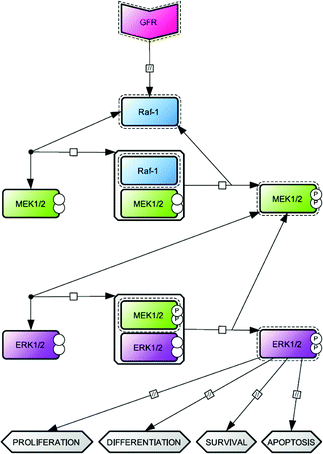 | ||
| Fig. 1 The network topology of the mammalian MAP kinases cascade: Raf/MEK/ERK axis. The signalingvia this cascade is usually initiated by growth factor receptor (GFR) activation, which transmit the signal by activating the MAPKKK Raf-1. Active Raf-1 binds and activates the MAPKK MEK (two isoforms, MEK1/2) by phoshorylation. Following a similar process, active MEK binds and activates the MAPK ERK (two isoforms, ERK1/2). Active ERK regulates various cellular processes such as proliferation, differentiation, survival and apoptosis. The network topology was realized using Cell Designer software according to Systems Biology Graphical Notation.33 | ||
Although the MAPK cascades have been the subject of intense research, there are few quantitative kinetic studies on the components belonging to this pathway. In particular, the association and dissociation rate constants (i.e., kon and koff, respectively) for the binary protein–protein interactions in this cascade have been derived from simulation/prediction studies5,6 or from in vitro studies of the kinase enzymatic reactions.7–9 There is only one recent work10 in which the dissociation binding constants (Kd) concerning MAPK complexes have been estimated from measurements on living cells. Therefore, in vitro accurate determination of the kinetic parameters seems to be necessary in order to provide more complete knowledge, allowing a direct comparison with the data obtained by different methodologies at the same time.
Numerous techniques have been described and applied to characterize protein–protein interactions in vitro.11–13 These techniques are often specialized and frequently use fluorescent probes as versatile means of studying the kinetics of protein interactions. The stopped-flow fluorescence intensity method offers a powerful tool for detailed kinetic analysis of protein interactions and has gained considerable importance during the last few years.14 The main advantages of this technique are the following: (i) the reaction can be monitored continuously in real time over a broad range of reactant concentrations at the millisecond time scale; (ii) the system operates in a liquid environment where the interacting molecules are not bound to a solid support, which is closer to physiological conditions, minimizing possible measurement alterations due to conformational changes that could arise from the protein-support binding; (iii) the experiments are not time-consuming.
The present study reports a kinetic investigation of the interaction between MEK and ERK by stopped-flow fluorescence intensity. The experimental procedure was based on the bioconjugation of ERK with a fluorophore, i.e.fluorescein-5-maleimide, followed by the analysis of its interaction with MEK using the stopped-flow method. This approach was applied to study the interaction of both commercial and homemade recombinant MEK and ERK proteins. Here, kinetic values for the koff and kon of MEK–ERK binding have been experimentally measured for the first time, thereby avoiding deriving them from an analysis of the kinase enzymatic reaction. From the koff/kon ratio, we calculated the corresponding Kd value that was compared with those obtained by previous studies.
2. Experimental procedures
2.1 Reagents
The commercial recombinant MEK and ERK proteins used were full-length active MEK1 and full-length inactive ERK1. MEK1, purchased from Upstate®, was N-terminal GST and C-terminal 6His-tagged, expressed in E. coli, purified using glutathione–agarose followed by Ni2+/NTA–agarose, activated using c-Raf and re-purified using Ni2+/NTA–agarose; purity 98%; MW = 71 kDa. ERK1 was purchased from Upstate® as an N-terminal Glutathione S-transferase (GST)-tagged protein, expressed in E. coli and purified using glutathione–agarose; purity 97%; MW = 70 kDa. The homemade recombinant MEK and ERK proteins used were the constitutively active mutant MEK1 R4F (containing an N-terminal deletion of 32–51 aa and the Ser218Glu/Ser222Asp substitutions) and full-length inactive ERK2; both the proteins were produced in the laboratory of the authors as follows. MEK1 R4F and ERK2 were expressed in the BL21-DE3 strain of E. coli, transformed with pGEX-KG MEK1 R4F and NpT7-5 ERK2, respectively. MEK1 R4F (expressed as GST-fusion protein; MW = 66 kDa) and ERK2 (expressed with 6His-tag; MW = 42 kDa) were purified as previously described in detail;15 minimum 90% purity, as determined by Sodium Dodecyl Sulphate-PolyAcrylamide Gel Electrophoresis (SDS–PAGE) and Coomassie blue (Bio-Safe Coomassie, Bio-Rad) staining. Purified MAP Kinases were dialyzed against Dulbecco's Phosphate-Buffered Saline (PBS; BE17-512F; BioWhittaker/Cambrex) using Slide-A-Lyzer 3.5 K (PIERCE). MEK1 R4F and ERK2 concentrations were determined after resolving recombinant protein samples and dilution series of purified 2 mg mL−1 bovine serum albumin by SDS-PAGE and staining with Coomassie blue. The gels were then documented using a ChemiDoc XRS charged-coupled device (Bio-Rad) and the proteins were quantified using Quantitative One software (Bio-Rad).ERK2 and MEK1 R4F expression plasmids were a generous gift from Melanie Cobb (University of Texas, Southwestern) and Natalie Ahnn (University of Colorado, Boulder), respectively.
Fluorescein-5-maleimide was synthesised as previously reported.16
2.2 Bioconjugation
ERK proteins were bioconjugated to fluorescein-5-maleimide following the reported protocol.17,18ERK concentration was 0.4 mg mL−1 and the excess of fluorescein-5-maleimide used was 50-fold. After bioconjugation, the derivative was immediately purified using a Sephadex® G-25 desalting column (Amersham Bioscience) and PBS (pH = 7.4) as the eluent.2.3 Calculation of dye/protein ratio
To evaluate the fluorophore labelling efficiency, the dye/protein ratios (D/P) of the conjugates were determined by the absorption spectra of the labelled proteins, registered in PBS (pH = 7.4), according to the relationship reported in eqn (1): | (1) |
ERK presents ten cysteine residues and the resulting D/P value was 0.98 for both the commercial and homemade proteins, on the basis of three averaged bioconjugations.
2.4 Experimental techniques
UV-Vis measurements for the evaluation of the fluorophore labelling efficiency were recorded using a Shimadzu UV-1700 Pharma Spec Spectrophotometer equipped with 1.0 cm pathlength quartz cells.Fluorescence kinetics measurements were recorded using an Applied Photophysics SX20 stopped-flow spectrometer fitted with a 515 nm cut-off filter between the cell and fluorescence detector and equipped with a thermostat bath (30 °C). Data acquisition, visualisation and analysis were provided by Pro-Data software from Applied Photophysics Ltd.
2.5 Experimental procedures
Biolabelled ERK concentration (10 nM in PBS) was kept constant and several shots of different MEK concentrations were performed: 100 nM, 120 nM, 140 nM and 160 nM in PBS for the commercial proteins. For homemade production, the chosen MEK concentrations were 20 nM, 40 nM, 60 nM, 100 nM and 130 nM. The reported concentrations are syringe concentrations; this means that the real concentrations in the cuvette are halved. Each experiment (a whole concentration set) was repeated five times, using a new mother solution and a different set of protein production each time. For each dilution condition, at least five scans were acquired and averaged. Each experimental point is therefore an average of 25 shots. Raw data were analyzed and plotted to a single exponential function by using Pro-Data Viewer 4.0.17 and, from this data treatment, the observed rate constants (kobs) were obtained. The excitation wavelength was 495 nm and slit-widths of the excitation monochromator were 0.2 mm.The displacement experiment was performed according to Eccleston et al.21 A solution containing a mixture of 50 nM biolabelled ERK with 50 nM MEK was rapidly mixed with a large excess (400 nM) of unlabelled ERK. The displacement was repeated four times and the koff obtained is an averaged value of these four experiments.
3. Results
To study the interaction between MEK and ERK we first used the commercial proteins. The binary protein binding was investigated under pseudo-first order conditions (i.e., [MEK] ≫ [ERK]). Fig. 2 shows that on mixing 10 nM ERK with 120 nM MEK there is a decrease in fluorescence intensity which can be well fitted to give a rate constant of 12.49 s−1. | ||
| Fig. 2 (A) The stopped-flow fluorescence intensity record of the binding of 120 nM MEK to 10 nM ERK (commercial proteins). The solid thin line is the best fit to the data, giving rate constants of 12.49 s−1. (B) Residual intensities are also reported. | ||
The dependence of the kobs for MEK–ERK binding was investigated using 10 nM biolabelled ERK and a range of 100–160 nM MEK (Fig. 3). In these experimental settings, the values of the kinetic parameters can be calculated from the slopes and intercepts of linear plots of kobsversus the increasing concentration of MEK (see eqn (2)).
| kobs = kon[MEK] + koff | (2) |
 | ||
| Fig. 3 The dependence of the kobs determined by the fluorescence intensity of the binding of ERK to increasing MEK concentrations (commercial proteins). Data points are the mean of five independent experiments ± the standard deviation. Error bars not visible as they are concealed by the data points. | ||
In particular, the slope of the straight line is the kon (second-order rate constant; units, M−1s−1) and the intercept on the ordinate is the koff (first-order rate constant; units, s−1). The second-order rate constant kon is 5.49 × 10⁸ M−1 s−1. As can be seen, the intercept on the ordinate has a small negative value (−24 s−1). This shows that the interaction is nearly completely shifted toward the formation of the complex. This shows that the interaction is nearly completely shifted toward the formation of the complex.
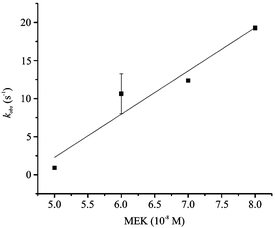
To further investigate this aspect, we then used more cheap homemade proteins in order to perform other interactions and to carefully evaluate the koff value. The interaction was repeated and the dependence of the kobs for MEK–ERK binding was again investigated using 10 nM biolabelled ERK and a range of 20–130 nM MEK (Fig. 4). The slope of the straight line through the points gives the apparent kon value and this is estimated to be 3.23 × 10⁸ M−1s−1, which is in good accordance with the previous value obtained with the commercial proteins. The intercept of the straight line with the y-axis should give the koff value, but again it cannot be reliably distinguished from zero with the obtained data. It should be noted that there will be a significant error on the points at low concentrations, since true pseudo-first-order conditions did not prevail. The intercept would not be reliable even if it appeared to be finite but small.
 | ||
| Fig. 4 The dependence of the kobs determined by the fluorescence intensity of the binding of ERK to increasing MEK concentrations (homemade proteins). Data points are the mean of five independent experiments ± the standard deviation. Error bars not visible as they are concealed by the data points. | ||
Since the disassociating rate constant value seems to be small, obtained koff is not reliable. To gain more information and to measure the koff value accurately, a displacement experiment was executed, as was proposed previously.21 Briefly, in the displacement experiment (see Scheme 1), a solution containing fluorescent ERK (ERK-fL) and MEK was mixed with an excess of non-fluorescent ERK (ERK-nfL). The concentration of ERK-fL was chosen to get a saturation of MEK, and then a high concentration of ERK-nfL was added so that ERK-fL dissociates from MEK and cannot re-associate. In this way, the rate constant of the observed process is determined only by k−1.
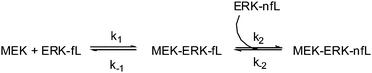 | ||
| Scheme 1 The displacement reaction. | ||
Therefore, the koff value was measured directly by displacement of ERK from its complex with MEK using an excess of unlabelled ERK. The fluorescence intensity was monitored during the process and the corresponding record was fitted to give an average rate constant of 18.7 s−1 (Fig. 5). This koff value, together with that obtained for the kon, allowed us to calculate the Kd value of 58 nM for MEK–ERK interaction. This is in excellent agreement with the Kd value of 50 nM obtained by steady-state fluorescence in the same buffer (data not shown).
 | ||
| Fig. 5 The stopped-flow fluorescence record of a representative displacement experiment (homemade proteins): one syringe contained 50 nM biolabelled ERK with 50 nM MEK, and the other syringe contained 400 nM unlabelled ERK. The plot shows a fit to a single exponential, with a rate constant of 20.5 s−1. The experiment was repeated four times and the average value obtained is 18.7 s−1 ± 2.2. | ||
4. Discussion
In the present work, the binding between MEK and ERK, two members of a crucial intracellular signal pathway, were studied using stopped-flow fluorescence intensity. The values of kon and koff were experimentally measured for the first time, avoiding their derivation from the analysis of the kinase enzymatic reaction. The Kd value was determined from the koff/kon ratio and the results are in excellent agreement with the values obtained in previous in vitro studies.8,9 This shows that the use of the stopped-flow technique is a suitable approach for studying protein–protein interactions in vitro.A careful collection of available information, relative to the kinetic parameters for the MEK–ERK interaction, allowed us to compare the values obtained with those previously found by different methods (Table 1). In fact, the Kd value reported is of the same order of magnitude of that obtained by deriving kon and koff from the in vitro study of the kinase enzymatic reaction.7–9 Compared to those obtained by in vitro methods, the Kd values derived from simulation modeling by the group of Schoeberl5 and Yamada7 are one and two order(s) of magnitude different, respectively. The in vitro Kd value is one order of magnitude different from that obtained in vivo by Fujioka and co-workers.10 The authors calculated the half-life of the MEK–ERK complex and estimated the dissociation rates from these half-lives.
| References | Method | k on (106 M−1 s−1) | k off (s−1) | K d (nM) |
|---|---|---|---|---|
| a Considering the Michaelis–Menten formulation as a special case of two reactions in sequence (Bhalla & Iyengar 1999), the values corresponding to Km, kcat and koff/kcat ratio (available in the DOQS database, http://doqcs.ncbs.res.in) for the MEK–ERK kinase enzymatic reaction allowed the derivation of the values corresponding to kon, koff and Kd for MEK–ERK binding. | ||||
| This study | in vitro | 323 | 18.7 | 58 |
| Bhalla 2004a,8 Sasagawa et al. 2005a,9 | in vitro | 16.2 | 0.6 | 37 |
| Fujioka et al. 200610 | in vivo | 0.88 | 0.088 | 100 |
| Schoeberl et al. 20025 | simulation modeling | 0.11 | 0.033 | 300 |
| Yamada et al. 20046 | simulation modeling | 0.318 | 0.9 | 2800 |
In the context of protein–protein interactions, it is well-established that an in vitro study requires in vivo validation and vice versa. Measurements performed in living cells have to be considered of high value, due to the physiological/cellular context in which molecules operate. On the other hand, in vitro methods analyze binary protein–protein interactions in a cell-free system, which is characterized by the absence of positive or negative influences exerted by additional molecular determinants that could be present in vivo. Therefore, significant discrepancies may arise from the two approaches. Any remarkable difference in the readout is daunting. Indeed, if it occurs, it may be considered as an indication of a possible gap in the biological information and, therefore, this suggestion may be considered as useful. Taking into account these considerations, we may attempt to speculate on the comparison between the Kd values obtained in vitro and the value derived from the in vivo study reported by Fujioka and coworkers.10 The observed difference in one order of magnitude among these Kd values may be due to the diverse activation states of MEK, as well as the presence of additional factors regulating the MEK–ERK interaction in vivo. Indeed, as reported by the group of Fujioka,10 only a fraction of MEK is activated in vivo, even when ERK activation is saturated, whereas all of the MEK is in the activated form in vitro. In addition, a number of studies suggest the emerging role of scaffold proteins as regulators of MAPK signaling kinetics, in terms of both potentiation and attenuation.22–24
It is well-known that the MEK–ERK interaction and signaling represents a complex signaling module that may be controlled by different regulatory mechanisms. MEK is activated by phosphorylation of two Ser residues (Ser218 and Ser222 in MEK1; Ser222 and Ser226 in MEK2) and, in turn, binds and activates ERK by dual phosphorylation on Thr and Tyr residues (Thr202 and Tyr204 in ERK1; Thr185 and Tyr187 in ERK2). Moreover, inactive MEK can also bind (albeit weakly) to ERK and the phosphorylation of additional MEK amino acid residues have been reported in the literature to have positive and negative effects on ERK phosphorylation and signaling.25–27 Therefore, one may speculate that the different phosphorylated residues play a role in regulating the MEK–ERK binding affinity.
Interestingly, it is a controversial issue whether phosphorylation of ERK by MEK is a processive or distributive mechanism. In a processive catalysis, after binding the substrate, the kinase carries out two phosphorylations before releasing the final product. In contrast, in a distributive mechanism, the enzyme releases the intermediate monophosphorylated products and a new collision is required for the conversion of this intermediate into the final product.28 However, a number of studies have demonstrated that dual phosphorylation of MAPKs occurs through a distributive two-collision mechanism.29–31 In this case, the Kd values that we calculated from our in vitro measurements would represent the Kd corresponding to MEK–ERK complex formation that precedes the first step of the distributive mechanism of catalysis. Interestingly, the obtained Kd value is in excellent agreement with the corresponding value (50 nM), which can be calculated from the kon and koff reported by Markevich et al.28 They developed a computational model of MAPK signaling based on parameter values retrieved from previously reported experimental data in the time course of MEK-catalyzed dual phosphorylation of ERK. For future detailed characterization of MEK–ERK binding in this context, it will be interesting to analyze the interaction between MEK and monophosphorylated ERK using the proposed stopped-flow approach and compare the derived data with those reported in the case of MEK binding to unphosphorylated ERK.
A recent study by Baccarini et al. reported that MEK1–MEK2 heterodimers exist in the cells, and that they coexist with MEK1 and MEK2 monomers, with higher order complexes and possibly with homodimers.32 In this context, the role of heterodimer formation has been shown to be essential for ERK-mediated phosphorylation of Thr292 of MEK1, which attenuates MEK–ERK signaling through a negative feedback mechanism.32
Conclusions
Through the case study of MEK–ERK binding, we propose the stopped-flow approach as a suitable in vitro method of experimentally measuring the kinetic parameters of binary protein–protein binding in a well-characterized and not time-consuming manner. This is of particular importance in the development of signal transduction mathematical models, in which systems biologists are often faced with difficulties concerning the choice of kinetic constant values to be used in the model of interest. A more intensive use of the stopped-flow fluorescence intensity technique may facilitate the generation of high quality in vitro data. Having established a framework for deriving such valuable data, the natural extension of our work may consist of kinetic analysis from a biological standpoint closer to the real complex systems of the MAPK cascade. This may be achieved by investigating the in vitroMEK–ERK interaction considering homodimer vs. heterodimer formation, as well as the presence/absence of specific phosphorylated amino acid residues in the recombinant proteins of interest.Finally, the stopped-flow approach that we proposed may be applied in the context of binary protein-protein interaction belonging to other signaling cascades and contribute to a better comparison between in vitro and in vivoprotein interaction behaviors, leading to an improvement in the development of signal transduction models for a fine elucidation of cell signaling mechanisms.
Acknowledgements
We thank Melanie Cobb (Univerity of Texas, Southwestern) and Natalie Ahnn (University of Colorado, Boulder) for providing ERK2 and MEK1 R4F expression plasmids. N.B. thanks the late Prof. John F. Eccleston for his teaching on kinetics and stopped-flow.Notes and references
- M. Raman and M. H. Cobb, Curr. Biol., 2003, 13, R886 CrossRef CAS.
- K. Kuida and D. M. Boucher, J. Biochem., 2004, 135, 653 CrossRef CAS.
- L. Chang and M. Karin, Nature, 2001, 410, 37 CrossRef CAS.
- M. G. Wilkinson and J. B. Millar, FASEB J., 2000, 14, 2147 CrossRef CAS.
- B. Schoeberl, C. Eichler-Jonsson, E. D. Gilles and G. Muller, Nat. Biotechnol., 2002, 20, 370 CrossRef.
- S. Yamada, T. Taketomi and A. Yoshimura, Biochem. Biophys. Res. Commun., 2004, 314, 1113 CrossRef CAS.
- U. S. Bhalla and R. Iyengar, Science, 1999, 283, 381 CrossRef CAS.
- U. S. Bhalla, Biophys. J., 2004, 87, 745 CrossRef CAS.
- S. Sasagawa, Y.-I. Ozaki, K. Fujita and S. Kuroda, Nat. Cell Biol., 2005, 7, 365 CrossRef CAS.
- A. Fujioka, T. Terai, R. E. Itoh, K. Aoki, T. Nakamura, S. Kuroda, E. Nishida and M. Matsuda, J. Biol. Chem., 2006, 281, 8917 CrossRef CAS.
- J. H. Lakey and E. M. Raggett, Curr. Opin. Struct. Biol., 1998, 8, 119 CrossRef CAS.
- E. M. Phizicky and S. Fields, Microbiol. Rev., 1995, 59, 94 CAS.
- Haian Fu, Protein–Protein Interactions: Methods and Applications Methods in Molecular Biology, 2004, vol. 261, Humana Press Search PubMed.
- M. G. Gore and S. P. Bottomley, Stopped-flow Fluorescence Spectroscopy. In Spectrophotometry & Spectrofluorimetry, 2000, ed. M. G. Gore, Oxford University Press Search PubMed.
- C. J. Heise and M. H. Cobb, Methods, 2006, 40, 209 CrossRef CAS.
- P. Y. Reddy, S. Kondo, S. Fujita and T. Toru, Synthesis, 1998, 7, 999 CrossRef.
- G. T. Hermanson, Bioconjugate Techniques, 2nd edn, 2008, Academic Press Search PubMed.
- N. Barbero, L. Napione, P. Quagliotto, S. Pavan, C. Barolo, E. Barni, F. Bussolino and G. Viscardi, Dyes Pigm., 2009, 83, 225 CrossRef CAS.
- S. C. Gill and P. H. von Hippel, Anal. Biochem., 1989, 182, 319 CAS.
- C. N. Pace, F. Vajdos, L. Fee, G. Grimsley and T. Gray, Protein Sci., 1995, 4, 2411 CrossRef CAS.
- J. F. Eccleston, J. P. Hutchinson and H. D. White, Protein–ligand interactions, structure and spectroscopy: a practical approach, 2001, ed. S. E. Harding and B. Z. Chowdhry, Oxford University Press Search PubMed.
- M. M. McKay, D. A. Ritt and D. K. Morrison, Proc. Natl. Acad. Sci. U. S. A., 2009, 106, 11022 CrossRef CAS.
- M. Roy, Z. Li and D. B. Sacks, Mol. Cell. Biol., 2005, 25, 7940 CrossRef CAS.
- C. Sharma, T. Vomastek, A. Tarcsafalvi, A. D. Catling, H. J. Schaeffer, S. T. Eblen and M. J. Weber, J. Cell. Biochem., 2005, 94, 708 CrossRef CAS.
- A. Brunet, G. Pages and G. Pouysségur, FEBS Lett., 1994, 346, 299 CrossRef CAS.
- S. T. Eblen, J. K. Slack-Davis, A. Tarcsafalvi, J. T. Parsons, M. J. Weber and A. D. Catling, Mol. Cell. Biol., 2004, 24, 2308 CrossRef CAS.
- J. K. Slack-Davis, S. T. Eblen, M. Zecevic, S. A. Boerner, A. Tarcsafalvi, H. B. Diaz, M. S. Marshall, M. J. Weber, J. T. Parsons and A. D. Catling, J. Cell Biol., 2003, 162, 281 CrossRef CAS.
- N. I. Markevich, J. B. Hoek and B. N. Kholodenko, J. Cell Biol., 2004, 164, 353 CrossRef CAS.
- W. R. Burack and T. W. Sturgill, Biochemistry, 1997, 36, 5929 CrossRef CAS.
- J. E. Ferrell Jr. and R. R. Bhatt, J. Cell Biol., 1997, 272, 19008 CAS.
- Y. Zhao and Z.-Y. Zhang, J. Cell Biol., 2001, 276, 32382 CAS.
- F. Catalanotti, G. Reyes, V. Jesenberger, G. Galabova-Kovacs, R. de Matos Simoes, O. Carugo and M. Baccarini, Nat. Struct. Mol. Biol., 2009, 16, 294 CrossRef CAS.
- N. Le Novère, M. Hucka, H. Mi, S. Moodie, F. Schreiber, F. Sorokin, E. Demir, K. Wegner, M. I. Aladjem, S. M. Wimalaratne, F. T. Bergman, R. Gauges, P. Ghazal, H. Kawaji, L. Li, Y. Matsuoka, A. Villéger, S. E. Boyd, L. Calzone, M. Courtot, U. Dogrusoz, T. C. Freeman, A. Funahashi, S. Ghosh, A. Jouraku, S. Kim, F. Kolpakov, A. Luna, S. Sahle, E. Schmidt, S. Watterson, G. Wu, I. Goryanin, D. B. Kell, C. Sander, H. Sauro, J. L. Snoep, K. Kohn and H. Kitano, Nat. Biotechnol., 2009, 27, 735 CrossRef CAS.
Footnotes |
| † These authors contributed equally to this work |
| ‡ Present address: Unit “Physics of Biological Systems”, Genomes and Genetics Department, Institut Pasteur, 75015 Paris, France. |
| This journal is © The Royal Society of Chemistry 2011 |