DNA hybridization of pathogenicity island of vancomycin-resistant Enterococcus faecalis with discretely functionalized gold nanoparticles in organic solvent mixtures
Chun-Pong
Chak
a,
Josie M. Y.
Lai
b,
Kathy W. Y.
Sham
b,
Christopher H. K.
Cheng
*b and
Ken Cham-Fai
Leung
*ac
aCentre of Novel Functional Molecules and Institute of Molecular Functional Materials, Department of Chemistry, The Chinese University of Hong Kong, Shatin, NT, Hong Kong SAR, P.R. China. E-mail: cfleung@cuhk.edu.hk
bSchool of Biomedical Sciences, The Chinese University of Hong Kong, Shatin, NT, Hong Kong SAR, P.R. China
cInstitute of Creativity and Department of Chemistry, The Hong Kong Baptist University, Kowloon Tong, Kowloon, Hong Kong SAR, P.R. China
First published on 6th October 2011
Abstract
Short single-strand (ss) DNA sensors that involve mono-functionalized gold nanoparticles are reported for the first time. By way of an example, the hybridization and detection of a 10 base-pair oligonucleotide (TGACTCTTAA), which relates to the pathogenicity island of vancomycin-resistant Enterococcus faecalis, has been demonstrated in the organic solvent mixture (DMF/CHCl3/H2O/NaCl) at sub-nanomole concentrations. The formation of the resulting double-strand (ds) DNA–AuNP complexes which involve either tail-to-tail or head-to-head alignment, are sensitive to salt (NaCl) and solvent (CHCl3) concentrations. By UV/visible absorption measurements, it has been found that the melting temperature of the dsDNA–AuNP complexes increases with increasing salt concentrations as well as the chloroform ratio, for both tail-to-tail and head-to-head alignments. Transmission electron microscopic images of the dsDNA–AuNP complexes with mono-functionalized AuNPs reveal significant amounts of dimeric AuNP species while that of randomly functionalized AuNPs reveal an agglomerated AuNP nanostructures.
Introduction
DNA sensors have been extensively investigated in recent years because they are useful for the detection of several pathogenic and genetic diseases.1,2 Many sensors rely on the chemical post-modification of the target polynucleotides by adding fluorescent probes or other types of labeling moieties.3–7 In recent advances in nanotechnology, sensors that are combined with polynucleotides can be directly used for DNA detection without any chemical modification.Gold nanoparticles (AuNP) are a desirable and outstanding candidate for this application because it is (1) relatively stable; (2) non-aggregated compared to other nanoparticles (e.g., magnetic particles); (3) size tunable (down to sub-nanometre); (4) shape tunable (e.g., spheres, cubes, rods, etc.); and (5) size/shape/distance-dependent to their optical properties.8–10
Most of the sensor applications employ the use of randomly functionalized AuNPs as the components for further DNA attachments.11–15DNA primers are usually attached to the surface of AuNPs by a place exchange reaction of thiolate. After addition of the target DNA, there exists a change of UV absorbance at the characteristic gold–DNA complex bands at 260 nm, 520 nm and beyond, which are corresponded to the formation of the gold–DNA complexes and hence, a decrease in the interparticle distance between AuNPs.13,14
However, there exist particle–particle repulsions between bulky and negatively charged DNA, thereby affecting the ‘melting point’ of the gold–DNA complexes in randomly functionalized AuNPs.16 Such deviations may be different batch-by-batch and depend on different lengths and sequences of DNA used. Calibration of such AuNP-based sensors would be required for individual experiment when different lengths and sequences of DNA are used.
It was also found that the probe density of the AuNPs alters the properties of gold–DNA complexes,16i.e., the ‘melting point’ of the gold–DNA complexes decreased with the decrease in probe density. Such a probe density change was achieved by the addition of some diluent strands onto the AuNPs via place exchange reaction, which was an average (by estimation) in all of the AuNPs present. It is unsure that all AuNPs possess the same or very close probe density and that the probe density would approximately decrease to 33%.
The preparation of mono-functionalized AuNPs has been explored in recent years.17–19 Recently, the synthesis of such mono-functionalized AuNPs with an average diameter of 2.0–2.2 nm can be achieved using supramolecular and solid phase supported chemistry.20 Herein, we report the use of mono-functionalized AuNPs for the attachment of short single-strand DNA (10 base pairs) by a simple and quantitative thiol–maleimide click reaction to afford the mono-functionalized AuNP-based DNA sensors. It is not necessary to synthesize any additional mercaptoalkyl-oligonucleotide or to use a longer sequence of DNA, which is essential for randomly functionalized AuNPs to generate ample space for effective agglomeration.16 Hence, commercially available mercapto-oligonucleotide can be used. Moreover, a relatively short sequence of DNA (10 base pairs) was attached to the mono-functionalized AuNPs to provide minimal steric and electrostatic repulsion between AuNPs during DNA assembly. In this paper, we report for the first time the use of mono-functionalized oligonucleotide AuNPs as a sensor for a polynucleotide related to the pathogenicity island of vancomycin-resistant Enterococcus faecalis21 at sub-nanomole concentrations. Tail-to-tail and head-to-head dsDNA–AuNP dimeric assemblies can be formed and characterized by UV/visible absorption spectroscopy, providing future nano-medicinal applications.21–25
The dsDNA–AuNP complexes of this study were dissolved in a mixture of organic solvents (N,N′-dimethylformamide (DMF) and CHCl3) with specific amounts of NaCl solution. The use of organic solvents for the DNA assembly provides new approaches for novel structural gene delivery.26,27 Moreover, dsDNA–AuNP sensors could be operated in alcoholic solvents.28 Because of the DNA denaturing nature of DMF, dsDNA–AuNP sensors that are compatible with DMF have not yet been reported. However, it was found that DNA assemblies of short sequences (21 base pairs) were basically intact even in 95% DMF solution, while longer DNA sequences were denatured.29 Such findings support that our target double stranded DNA (10 base pairs) AuNPs would be stable in organic solvent systems.
Experimental section
General consideration
Chemicals were purchased from Aldrich unless otherwise specified. N,N′-Dimethylformamide (DMF) was distilled and dried with molecular sieves (4 Å). Analytical grade chloroform (CHCl3) was used without further purification. Customized DNA primers with HPLC purification were purchased from Invitrogen. Temperature-controlled UV/visible measurements were performed with a Beckman DU-7500 photo-diode array spectrophotometer. FT-IR spectra were recorded using a Perkin Elmer Spectrum I. Prior to the recording of FT-IR spectra, solid samples were ground with analytical grade KBr (10![[thin space (1/6-em)]](https://www.rsc.org/images/entities/char_2009.gif) :1 KBr:sample) and that powder was pressed to produce a pellet suitable for IR measurement. High-resolution transmission electron microscopic (HR-TEM) images were obtained with a FEI TecnaiF20 Field Emission Transmission Electron Microscope. Deionized water was obtained from a Barnstead RO pure system.
:1 KBr:sample) and that powder was pressed to produce a pellet suitable for IR measurement. High-resolution transmission electron microscopic (HR-TEM) images were obtained with a FEI TecnaiF20 Field Emission Transmission Electron Microscope. Deionized water was obtained from a Barnstead RO pure system.
Mono-maleimide functionalized gold nanoparticles
Mono-amine functionalized AuNPs with an average diameter of 2.0–2.2 nm were synthesized and purified as previously reported.20Mono-amine functionalized AuNPs (0.7 mg) were dissolved in CHCl3 (1 mL) followed by the addition of N-succinimido 4-maleimidobutanoate (0.7 mg). The reaction was vigorously shaken overnight in a water bath. The solvent was then evaporated in vacuo, followed by the addition of an excess of MeCN and sonicated for 30 s. Excessive solvent was removed and the washing process was repeated three times. Then, the mixture was evaporated to dryness. CHCl3 (1.40 mL) and DMF (1.40 mL) were added to re-dissolve the AuNPs to obtain the series of 1:1 CHCl3/DMF solvent ratio. CHCl3 (1.87 mL) and DMF (0.93 mL) were added to re-dissolve the AuNPs to obtain the series of 2:1 CHCl3/DMF solvent ratio.
Mono-ssPrimer functionalized gold nanoparticles and dsDNA–gold nanoparticle dimers
ssPrimerA-SH and ssPrimerB-SH were dissolved in DMF/H2O (91:9). To 200 μL of the above AuNP solution was added 0.32 nM ssPrimer A-SH and 0.32 nM ssPrimer B-SH (Table 1) by extraction from the bulk primer solutions. Two drops of 1% Et3N in CHCl3 was added. Then, 300 μL CHCl3 and 300 μL DMF were added to the solution. Then, 10 μL of three different concentrations (1, 5, and 10 μM) of NaCl solution were added to the three batches of solution, which were then vigorously shaken overnight. To prepare the dsDNA–AuNP dimers, target DNA (0.32 nM) was added to the above reaction mixture and shaken vigorously overnight.
| Entry | ssPrimer A (5′→3′) | ssPrimer B (5′→3′) | ssTarget A′B′ (5′→3′) | dsDNA–AuNP alignment |
|---|---|---|---|---|
| 1–6 | HS-TTAAG | AGTCA-SH | TGACTCTTAA | Tail-to-tail |
| 7–12 | TTAAG-SH | HS-AGTCA | TGACTCTTAA | Head-to-head |
Random-maleimide functionalized gold nanoparticles
Random-amine functionalized AuNPs were synthesized and purified as previously reported.20 Random-amine functionalized AuNPs (0.7 mg) were dissolved in CHCl3 (1 mL) followed by the addition of N-succinimido 4-maleimidobutanoate (3.5 mg). The reaction was shaken vigorously overnight in a water bath. The solvent was then evaporated in vacuo, followed by the addition of an excess of MeCN and sonicated for 30 s. Excessive solvent was removed and the washing process was repeated three times. Then, the mixture was evaporated to dryness. CHCl3 (1.40 mL) and DMF (1.40 mL) were added to re-dissolve the AuNPs to obtain a 1:1 CHCl3/DMF solvent ratio.
Random-ssPrimer functionalized gold nanoparticles and dsDNA–gold nanoparticle random structures
ssPrimerA-SH and ssPrimerB-SH were dissolved in DMF/H2O (91:9). To 200 μL of the above AuNP solution was added 1.6 nM ssPrimer A-SH and 1.6 nM ssPrimer B-SH (Table 2) by extraction from the bulk primer solutions. Two drops of 1% Et3N in CHCl3 was added. Then, 300 μL CHCl3 and 300 μL DMF were added to the solution. Then, 10 μL of three different concentrations (1, 5, and 10 μM) of NaCl solution were added to the three batches of solution, which were then shaken vigorously overnight. To prepare the random-dsDNA functionalized AuNPs, target DNA (1.6 nM) was added to the above reaction mixture and was shaken vigorously overnight.
| Entry | ssPrimer A (5′→3′) | ssPrimer B (5′→3′) | ssTarget A′B′ (5′→3′) | dsDNA–AuNP alignment |
|---|---|---|---|---|
| 13–15 | TTAAG-SH | HS-AGTCA | TGACTCTTAA | Head-to-head |
UV/visible absorption spectroscopy
UV/visible absorption spectroscopy was performed at 15 °C. Solutions of mono-maleimide functionalized AuNPs were further diluted with CHCl3 (300 μL) and DMF (300 μL). The concentrations of primers and AuNPs used for UV/visible absorption spectroscopic measurements are denoted in Table 3.| Entry | [Primer A] = [Primer B] = [Target A′B′] (μM) | [AuNP] (μg mL−1) |
|---|---|---|
| 1–6 | 0.3989 | 61.4 |
| 7–12 | 0.3991 | 61.4 |
| 13–15 | 1.9515 | 60.1 |
Melting temperature analysis
Solutions of mono- and random-dsDNA functionalized AuNPs were transferred to a quartz cuvette for UV/visible absorption spectroscopic measurements. The temperature of the cuvette was increased from 15 to 40 °C (for 1 and 5 μM NaCl series) and from 15 to 45 °C (for 10 μM NaCl series) with 1.0 °C increase per minute. The normalized increases in absorbance of 521 nm (corresponded to monomer of AuNPs) were analyzed whereas their first derivatives were evaluated to obtain the melting temperature of the dsDNA–AuNP dimer nanostructures.Transmission electron microscopy
Based on the sample concentrations listed in Table 3, a drop of each sample solution was drop-cast onto a carbon-coated copper grid for transmission electron microscopic analysis.Results and discussion
Mono-amine functionalized AuNPs20 were reacted with N-succinimido 4-maleimidobutanoate to give novel mono-maleimido AuNPs (Fig. 1). The as-synthesized mono-maleimido AuNPs have been characterized by the appearance of the characteristic maleimide IR absorption band at 1707 cm−1 (Fig. 2).30 Moreover, a new absorption band at 1651 cm−1 as well as a shift from 804 to 827 cm−1 were observed, corresponding to the amide C=O stretching and the para-substituted aromatic C–H stretching, respectively. Four different possible thiolate primers (type A and type B) that were complementary to the target DNA A′B′ (TGACTCTTAA; 5′ to 3′), were attached independently to the mono-functionalized AuNPs. To achieve a tail-to-tail dimeric AuNP nanostructure, primers A and B are HS-TTAAG and AGTCA-SH (5′ to 3′'), respectively (Table 1). On the other hand, primers A and B are TTAAG-SH and HS-AGTCA (5′ to 3′) to achieve a head-to-head dimeric AuNP nanostructure (Table 1). The target DNA A′B′ was added to the solution in DMF/CHCl3/H2O/NaCl mixtures followed by UV/visible absorption measurements. The success of the thiol-maleimide click reaction has been characterized by the disappearance of maleimide IR absorption band at 1707 cm−1 and the appearance of the DNA symmetric PO2− at 1094 cm−1 (head-to-head) and 1097 cm−1 (tail-to-tail) (Fig. 2 and Table 4).31,32Melting curves of the AuNP–DNA complexes were analyzed. Noticeably, DMF has a UV cut-off wavelength at 268 nm so that the typical DNA melting characteristic band at 260 nm would not be feasible for monitoring the dsDNA assembly and disassembly. Herein, the absorbance change at 521 nm was monitored to evaluate the properties of the dsDNA–AuNP complexes.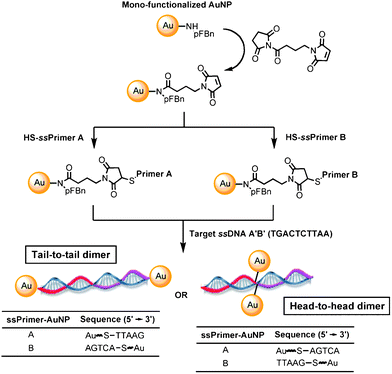 | ||
| Fig. 1 Graphical depiction for the formation of the dsDNA–gold nanoparticle tail-to-tail and head-to-head dimers. | ||
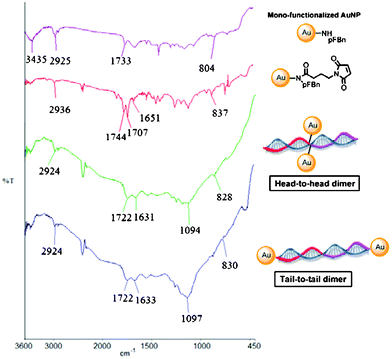 | ||
| Fig. 2 Stacked FT-IR spectra of the mono-functionalized AuNP, mono-maleimido functionalized AuNP, head-to-head dsDNA–AuNP dimer and the tail-to-tail dsDNA–AuNP dimer. | ||
| Nanostructures | IR absorption frequency (cm−1) | Assignment |
|---|---|---|
| mono-maleimido functionalized AuNP | 2936 | alkane C–H stretching |
| 1744 | ester C=O stretching | |
| 1707 | unsymmetric maleimide C=O stretching | |
| 1651 | amide C=O stretching | |
| 837 | para-substituted aromatics C–H | |
| dsDNA–AuNP head-to-head dimer | 2924 | alkane C–H stretching |
| 1722 | ester C=O stretching | |
| 1631 | amide C=O stretching | |
| 1094 (broad) | symmetric PO2− stretching | |
| 828 | para-substituted aromatics C–H | |
| dsDNA–AuNP tail-to-tail dimer | 2924 | alkane C–H stretching |
| 1722 | ester C=O stretching | |
| 1633 | amide C=O stretching | |
| 1097 (broad) | symmetric PO2− stretching | |
| 830 | para-substituted aromatics C–H |
Upon addition of the target ssDNA A′B′ to the mono-ssPrimer functionalized AuNPs, the absorbance of AuNP at 521 nm disappeared, indicating that new dsDNA–AuNP nanostructures were formed. Upon melting temperature analysis, the increased temperature of the dsDNA–AuNP would increase the relative absorbance at 521 nm, indicating that the AuNPs were dissociated into a monomeric state. Melting curves were plotted wherein the melting temperatures were determined according to the first derivatives of the curves (Table 6). The dsDNA–AuNP complexes possess two structural alignments: tail-to-tail (Table 1) and head-to-head (Tables 1 and 2). For tail-to-tail alignment, two AuNPs were expected to align with each end connected with the target dsDNA strand. For head-to-head alignment, two AuNPs were expected to align closely at the middle of the target dsDNA strand (Fig. 1). However, red shifts of the characteristic absorption wavelength from 520 nm to 650 nm were not observed in both cases. It may be attributed that the formation of AuNP dimers have only a small degree of agglomeration and the inter-particle distance between two AuNPs is larger than the average size of an individual AuNP, and such shifts are too weak to be detected.33,34 The assembling yield, which was measured by the percentage of dimer formation, and the interparticle distance of the AuNPs were measured using the transmission electron microscopy (TEM) images, which showed that they are longer than the average size of an individual AuNPs and have a satisfactory assembling yield (Table 5). That such a long interparticle distance was obtained even for head-to-head alignment may be due to the flexibility of the ligand linker, together with the flexibility of DNA which places the AuNPs opposite to each other (Fig. 1). Therefore, the SPR band was not shifted from 521 nm to > 600 nm upon formation of dimer. Rather, the increase in the SPR band at 521 nm during melting was used to measure the monomeric state of the AuNPs and such observation agrees well with the literature.35
| Entry | Interparticle distance (TEM)b | Assembly yield (% dimer formed)b | Alignment |
|---|---|---|---|
| a Randomly functionalized AuNPs are used. b Measured by counting 60 particles. | |||
| 3 | 3.5–5.0 nm | 79% | Tail-to-tail |
| 6 | 3.1–5.0 nm | 72% | Tail-to-tail |
| 9 | 2.7–4.5 nm | 70% | Head-to-head |
| 12 | 3.0–4.5 nm | 73% | Head-to-head |
| 15a | 2.0–3.6 nm | Nil. | Head-to-head |
| Entry | Melting Temperature °C | Solvent ratio (DMF/CHCl3/H2O) | [NaCl] (μM) | dsDNA–AuNP alignment |
|---|---|---|---|---|
| a Randomly functionalized AuNPs are used. | ||||
| 1 | 24.1 | 1:1:0.03 |
1 | Tail-to-tail |
| 2 | 26.6 | 1:1:0.03 |
5 | Tail-to-tail |
| 3 | 29.3 | 1:1:0.03 |
10 | Tail-to-tail |
| 4 | 24.9 | 1:2:0.03 |
1 | Tail-to-tail |
| 5 | 27.8 | 1:2:0.03 |
5 | Tail-to-tail |
| 6 | 30.0 | 1:2:0.03 |
10 | Tail-to-tail |
| 7 | 23.8 | 1:1:0.03 |
1 | Head-to-head |
| 8 | 26.5 | 1:1:0.03 |
5 | Head-to-head |
| 9 | 29.0 | 1:1:0.03 |
10 | Head-to-head |
| 10 | 25.2 | 1:2:0.03 |
1 | Head-to-head |
| 11 | 27.0 | 1:2:0.03 |
5 | Head-to-head |
| 12 | 30.3 | 1:2:0.03 |
10 | Head-to-head |
| 13a | 27.1 | 1:1:0.03 |
1 | Head-to-head |
| 14a | 28.6 | 1:1:0.03 |
5 | Head-to-head |
| 15a | 31.7 | 1:1:0.03 |
10 | Head-to-head |
It is also not surprising to find out that the interparticle distance of the randomly functionalized AuNPs determined by TEM was generally shorter than that of the mono-functionalized AuNPs (Table 5). The randomly functionalized AuNPs may form three-dimensional network aggregations (Fig. 3) and the AuNPs can aggregate through three-dimensional spaces. As observed from the TEM images, which cannot resolve the three-dimensional domains, the interparticle distance of the randomly functionalized AuNPs should be smaller. Such three-dimensional network aggregations may also form even when there exists a few components on the AuNPs which have not been self-assembled with its recognizing targets, indicating that detection using randomly functionalized AuNPs is somewhat less sensitive. This is an important issue for developing a more quantitative detection method for single molecules in the future.
 | ||
| Fig. 3 Graphical depiction for the formation of dsDNA–AuNP head-to-head oligomers, using randomly functionalized AuNPs. | ||
By comparing the melting temperature results (Table 6 and Fig. 4), the head-to-head alignments possess similar melting temperatures to those of the tail-to-tail alignments under the same conditions, which is highly unusual when randomly functionalized AuNPs are used. It is believed that they possess enhanced steric and electrostatic repulsion between the DNA in the randomly functionalized AuNPs when in close proximity. This effect can be minimized by using mono-functionalized AuNP.
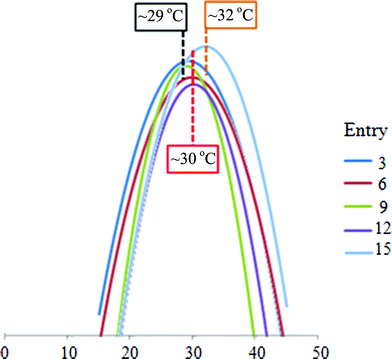 | ||
| Fig. 4 First derivative of melting curves of selected entries (3, 6, 9, 12, and 15). The melting temperatures of entries 3 and 9 are similar at ca. 29 °C; whilst the melting temperatures of entries 6 and 12 are similar at ca. 30 °C. It indicates that the alignment of the DNA-AuNPs does not affect the melting temperature to any great extent; rather the solvent effect will cause a greater change in melting temperature (comparison between 3, 6 and 9, 12 respectively). The randomly functionalized AuNPs possess a higher melting temperature than the mono-functionalized AuNPs, compare entry 9 with entry 15, which is under the same conditions (y-axis not to scale). | ||
Salts are essential for DNA assembly for charge balance in the dsDNA structures, especially in the presence of organic solvents. The salt effect in the formation of dsDNA–AuNP nanostructures was studied (Fig. 5). Three different concentrations of sodium chloride solution (1, 5, and 10 μM) were added to the mixtures. It was found that the melting temperature (Table 6) of the dsDNA–AuNP complexes increases with increasing salt concentrations for both tail-to-tail and head-to-head alignments.
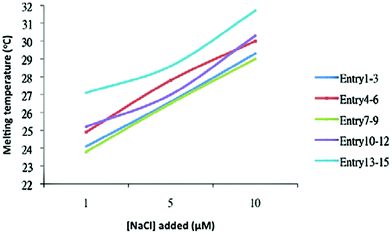 | ||
| Fig. 5 Relationship between the salt concentration and melting temperature of dsDNA–AuNP nanostructures. | ||
The solvent effect on the formation of the dsDNA–AuNP complexes is also studied by increasing the ratio of CHCl3 to DMF. Since the target DNA consists of only 10 base pairs, such short DNA increases the hydrophobicity and hence reduces the free energy in the annealing process. Moreover, the mono-ssPrimer functionalized AuNPs are more soluble in CHCl3 than in DMF.
Therefore, addition of CHCl3 should also increase the stability of the dsDNA–AuNP nanostructures. As a result, the melting temperatures of the dsDNA–AuNP nanostructures increase with the increasing CHCl3 ratio. The melting temperature difference of dsDNA between the mono-functionalized AuNPs (entries 7–9) and the randomly functionalized AuNPs (entries 13–15) is compared. The melting temperatures using the randomly functionalized AuNPs for dsDNA assembly are higher than that of the mono-functionalized AuNPs by 1.9–3.3 °C for the same conditions. That is, the melting temperature increases with increasing probe density. Therefore, the probe density was tunable not only by diluent stranded place exchange reaction, but also by controlling the functional ligand density of the particle’s surface.
The dsDNA–AuNP solutions were analyzed by TEM with nearly the same AuNP concentrations (Table 3). The TEM images of solutions of entries 3 and 6, which contain the tail-to-tail dimeric species, reveal significant amounts of AuNP dimer pairs (Fig. 6, pairing of dark dots). Similarly, significant amounts of AuNP dimer pairs are also observed in their TEM images for the solutions of entries 9 and 12 from which they contain head-to-head dimeric species. In contrast, the TEM image of the solution of entry 15 reveals agglomerated AuNP nanostructures. This observation demonstrates that the randomly functionalized AuNPs involve the formation of a network of AuNPs while the mono-functionalized AuNPs form discrete nanostructures.
 | ||
| Fig. 6 Transmission electron microscopic images of entries 3 and 6 (dsDNA–AuNP, tail-to-tail alignment); entries 9 and 12 (dsDNA–AuNP, head-to-head alignment); and entry 15 (dsDNA–randomly functionalized AuNP, head-to-head alignment). The scale bar (white) represents 20 nm. | ||
Conclusion
In conclusion, short ssDNA sensors that involve mono-functionalized gold nanoparticles, are reported for the first time. By way of an example, the hybridization and detection of a 10 base-pair oligonucleotide which relates to the pathogenicity island of vancomycin-resistant Enterococcus faecalis, has been demonstrated in organic solvent mixtures at sub-nanomole concentrations. It has been found that the melting temperature of the dsDNA–AuNP complexes increases with both increasing salt concentrations, and the amount of chloroform for both tail-to-tail and head-to-head alignments. TEM images of the dsDNA–AuNP complexes with mono-functionalized AuNPs reveal significant amounts of dimeric AuNP species whilst those of randomly functionalized AuNPs reveal an agglomerated AuNP nanostructures.The formation of randomly agglomerated nanostructures may presumably result in the cross binding of non-hybridized primer-DNA and AuNPs trapped within a sterically crowded network, leading to inaccurate shifts of UV/visible absorption signals. While our mono-functionalized AuNPs which provide one to one DNA annealing to AuNP, the spectroscopic signals are revealed by the formation of discrete dsDNA–AuNP dimeric complexes. This approach based on the formation of discrete nanoparticles and the less sterically hindered head-to-head alignment provides a more quantitative sensing property, and great potential for future applications in nanomedicine and aptamer sensor development.
Acknowledgements
We acknowledge the financial support by a Strategic Investments Scheme of CUHK, General Research Fund (CUHK401707) from the Research Grants Council of Hong Kong and a grant from the University Grants Committee of HKSAR (Area of Excellence Scheme AoE/P-03/08).References
- S. Razin, Mol. Cell. Probes, 1994, 8, 497–511 CrossRef CAS.
- J. G. Hacia, L. C. Brody, M. S. Chee, S. P. A. Fodor and F. S. Collins, Nat. Genet., 1996, 14, 441–447 CrossRef CAS.
- T. A. Taton, R. C. Mucic, C. A. Mirkin and R. L. Letsinger, J. Am. Chem. Soc., 2000, 122, 6305–6306 CrossRef CAS.
- A. N. Shipway and I. Willner, Chem. Commun., 2001, 20, 2035–2045 RSC.
- J. Reichert, A. Csaki, J. M. Kohler and W. Fritzsche, Anal. Chem., 2000, 72, 6025–6029 CrossRef CAS.
- L. He, M. D. Musick, S. R. Nicewarner, F. G. Salinas, S. J. Benkovic, M. J. Natan and C. D. Keating, J. Am. Chem. Soc., 2000, 122, 9071–9077 CrossRef CAS.
- G. R. Souza and J. H. Miller, J. Am. Chem. Soc., 2001, 123, 6734–6735 CrossRef CAS.
- R. Wilson, Chem. Soc. Rev., 2008, 37, 2028–2045 RSC.
- C. Jin, Angew. Chem., Int. Ed., 2010, 49, 2826–2829 Search PubMed.
- D. Li, S. Song and C. Fan, Acc. Chem. Res., 2010, 43, 631–641 CrossRef CAS.
- J. J. Storhoff, R. Elghanian, R. C. Mucic, C. A. Mirkin and R. L. Letsinger, J. Am. Chem. Soc., 1998, 120, 1959–1964 CrossRef CAS.
- R. Elghanian, J. J. Storhoff, R. C. Mucic, R. L. Letsinger and C. A. Mirkin, Science, 1997, 277, 1078–1081 CrossRef CAS.
- C. A. Mirkin, R. L. Letsinger, R. C. Mucic and J. J. Storhoff, Nature, 1996, 382, 607–609 CrossRef CAS.
- A. P. Alivisatos, K. P. Johnsson, X. G. Peng, T. E. Wilson, C. J. Loweth, M. P. Bruchez Jr and P. G. Schultz, Nature, 1996, 382, 609–611 CrossRef CAS.
- J. Y. Kim and J. S. Lee, Nano Lett., 2009, 9, 4564–4569 CrossRef CAS.
- R. Jin, G. Wu, Z. Li, C. A. Mirkin and G. C. Schatz, J. Am. Chem. Soc., 2003, 125, 1643–1654 CrossRef CAS.
- F. A. Aldaye and H. F. Sleiman, J. Am. Chem. Soc., 2007, 129, 4130–4131 CrossRef CAS.
- S. A. Claridge, H. W. Liang, S. R. Basu, J. M. J. Fréchet and A. P. Alivisatos, Nano Lett., 2008, 8, 1202–1206 CrossRef CAS.
- C. Krüger, S. Agarwal and A. Greiner, J. Am. Chem. Soc., 2008, 130, 2710–2711 CrossRef.
- C.-P. Chak, S. Xuan, P. M. Mendes, J. C. Yu, C. H. K. Cheng and K. C.-F. Leung, ACS Nano, 2009, 3, 2129–2138 CrossRef CAS.
- N. Shankar, A. S. Baghdayan and M. S. Gilmore, Nature, 2002, 417, 746–750 CrossRef CAS.
- (a) C. Yang, Y. Wang, J. L. Marty and X. Yang, Biosens. Bioelectron., 2011, 26, 2724–2727 CrossRef CAS; (b) W. Wang, W.-Y. Wu, X. Zhong, W. Wang, Q. Miao and J. J. Zhu, Biosens. Bioelectron., 2011, 26, 3110–3114 CrossRef CAS.
- J. Zhang, L. Wang, H. Zhang, F. Boey, S. Song and C. Fan, Small, 2010, 6, 201–204 CrossRef CAS.
- J. R. Woo, D. K. Lim and J. M. Nam, Small, 2011, 7, 648–655 CrossRef CAS.
- C.-P. Chak, L.-H. Chau, S.-Y. Wu, H.-P. Ho, W. J. Li, P. M. Mendes and K. C.-F. Leung, J. Mater. Chem., 2011, 21, 8317–8323 RSC.
- Y. K. Luu, K. Kim, B. S. Hsiao, B. Chu and M. Hadjiargyrou, J. Controlled Release, 2003, 89, 341–353 CrossRef CAS.
- D. H. Liang, Y. K. Luu, K. Kim, B. S. Hsiao, M. Hadjiargyrou and B. Chu, Nucleic Acids Res., 2005, 33, 170–183 CrossRef.
- B. D. Smith and J. Liu, J. Am. Chem. Soc., 2010, 132, 6300–6301 CrossRef CAS.
- F. Ke, Y. K. Luu, M. Hadjiargyrou and D. Liang, PLoS One, 2010, 5, e13308 Search PubMed.
- S. J. Xiao, S. Brunner and M. Wieland, J. Phys. Chem. B, 2004, 108, 16508–16517 CrossRef CAS.
- N. V. Hud, F. P. Mailanovich and R. Balhorn, Biochemistry, 1994, 33, 7528–7535 CrossRef CAS.
- S. H. Brewer, S. J. Anthireya, S. E. Lappi, D. L. Drapcho and S. Franzen, Langmuir, 2002, 18, 4460–4464 CrossRef CAS.
- F. Huo, A. K. R. Lytton-Jean and C. A. Mirkin, Adv. Mater., 2006, 18, 2304–2306 CrossRef CAS.
- R. C. Mucic, J. J. Storhoff, C. A. Mirkin and R. L. Letsinger, J. Am. Chem. Soc., 1998, 120, 12674–12675 CrossRef CAS.
- A. Baeissa, N. Dave, B. D. Smith and J. Liu, ACS Appl. Mater. Interfaces, 2010, 2, 3594–3600 CAS.
| This journal is © The Royal Society of Chemistry 2011 |