Thermoresponsive behaviour of poly[(oligo(ethyleneglycol methacrylate)]s and their protein conjugates: importance of concentration and solvent system†
Konstantinos
Bebis
,
Mathew W.
Jones
,
David M.
Haddleton
and
Matthew I.
Gibson
*
Department of Chemistry, University of Warwick, Coventry CV4 7AL, UK. E-mail: m.i.gibson@warwick.ac.uk; Fax: +44 247 652 4112; Tel: +44 247 652 4803
First published on 7th February 2011
Abstract
Thermoresponsive poly[oligo(ethyleneglycol) methacrylate]s with a variety of different oligo(ethyleneglycol) graft lengths were synthesised by reversible-addition fragmentation chain transfer (RAFT) polymerisation. The lower critical solution temperature (LCST) behaviour of these polymers was evaluated as a function of the polymer concentration and the concentration of dissolved solutes, in order to understand their applicability for in vitro and in vivo applications. It was observed that in the relevant dilute (<1 mg mL−1) concentration range the observed LCSTs increased by approximately 6 °C compared to higher concentrations. This was confirmed by complimentary dynamic light scattering and differential scanning calorimetry measurements. The impact of biological solutions on the LCST was determined using bovine blood plasma, which resulted in observed LCSTs lower than what is found in traditional buffer or pure aqueous solutions. Finally, a well-defined polymer–protein conjugate was synthesised by ‘grafting from’ using single-electron transfer (SET) polymerisation. This model polymer–protein therapeutic also displayed similar concentration dependant behaviour, highlighting the importance of testing novel ‘smart’ materials and conjugates at both relevant concentration ranges and in appropriate solvent systems in order to use them in biotechnological applications.
Introduction
Environmentally responsive polymers have received significant attention due to their rapid conformational changes in response to an external stimulus.1–4 ‘Smart’ polymers have been synthesised which respond to a wide variety of stimuli including pH, light, salt concentration, specific ions, carbohydrates and more. In particular, polymers exhibiting a lower critical solution temperature (LCST) in aqueous solution are of interest. Upon heating above the LCST the hydrogen bonds between polymer and water break leading to demixing and phase separation, which is an entropy driven process due to the expulsion of water. Upon cooling this process is reversed, returning to a homogenous mixture and can be thought of a triggered hydrophilic–hydrophobic switch. This reversible phase transition has been exploited for a variety of bio- and nanotechnological applications including: reversible cell attachment,5assembly of giant amphiphiles,6 triggered cellular uptake,7,8nanoparticle aggregation,9protein purification10 soluble sensors11,12 and bacterial aggregation.13 We have demonstrated that gold nanoparticles coated with a thermoresponsive polymer undergo diameter-dependent LCST transitions and that binary mixtures of nanoparticles of different diameters display a single transition controlled by the mass fraction of each particle.14 This cooperative aggregation could be used to immobilise particles onto complementary surfaces, as has also been shown by Cameron and co-workers.15 Common examples of polymers which display LCST behaviour include poly(N-isopropylacrylamide) (NIPAM),8,16 poly(2-n-propyl-2-oxazoline)17 and elastin side-chain polymers.18In 2006 Lutz demonstrated that statistical copolymers of oligo(ethyleneglycol methacrylate) (OEGMA) with different side-chain lengths could display an LCST, which could be tuned by varying the molar ratio of the different OEGMAs.19 This polymer is appealing as it appears to show high biocompatibility (inferred from its relationship to linear PEG, but the synthesis method can also influence this20), prevents protein/cell absorption21 (like with other PEG-derivatives22), can be prepared by a variety of controlled radical polymerisation techniques and also shows limited hysteresis while cycling above/below its LCST.23 Furthermore the degree of polymerisation of the POEGMA does not strongly influence the LCST,23,24 giving more predictable properties than e.g. pNIPAM. More detailed studies on the influence of polymer structure on LCST have been conducted, in particular highlighting the importance of the polymer end-group as shown by Theato et al.25 The influence of the end-group is particularly important for biological applications where it is common to additionally functionalise polymers with a fluorescent dye for in vitro uptake/trafficking analysis. The architecture of the POEGMAs must also be taken into consideration, as hyperbranched26 or dendritic27 structures display different LCST behaviour compared to linear. Another attractive feature of POEGMA is the rather lower dependence of the observed LCST on concentration compared to, for example, elastin-based polymers in which the LCST increases significantly upon dilution.18,28 This relationship is important for in vivodrug delivery applications where sub mg mL−1 concentrations of the polymer will be applied and the concentration of polymer may increase (due to tissue accumulation) or decrease in the blood stream (due to excretion, dilution or tissue accumulation). In particular, the targeting of cancerous tissue due to the increased lipid solubility (and hence cellular uptake) of thermosensitive polymers above their LCST,7,8,29 triggered by the increased temperature of tumour tissue relative to healthy would be particularly dependent on understanding dilution effects on LCST.
Considering the above, the aim of this work was to investigate the LCST behaviour of poly[oligo(ethyleneglycol) methacrylate] across a wide concentration range, including those relevant for in vivo applications. The influence of salt and blood-plasma constituents on the LCST is also investigated to determine if standard testing protocols are sufficient to predict the in vivo behaviour. Finally, the thermoresponsive behaviour of a well-defined polymer–protein conjugate as a model drug delivery system is evaluated. These studies are important to aid in creating design rules for stimuli responsive materials, and also to aid in the understanding of in vitro and in vivo behaviour.
Results and discussion
Poly[oligo(ethyleneglycol) methacrylate] (POEGMA) was synthesised by reversible addition fragmentation chain transfer (RAFT) polymerisation of the corresponding OEG-methacrylates, Scheme 1. Five different polymers were prepared for this study using [monomer]![[thin space (1/6-em)]](https://www.rsc.org/images/entities/char_2009.gif) :
:![[thin space (1/6-em)]](https://www.rsc.org/images/entities/char_2009.gif) [chain transfer agent] = 100
[chain transfer agent] = 100![[thin space (1/6-em)]](https://www.rsc.org/images/entities/char_2009.gif) :
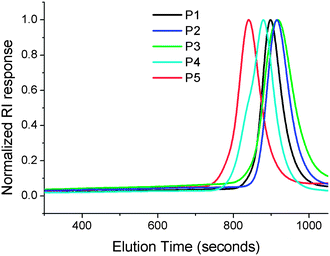
:![[thin space (1/6-em)]](https://www.rsc.org/images/entities/char_2009.gif) 1 with PEG side chain length varying from diethylene glycol to oligoethyleneglycol475. These were characterised by 1H NMR and SEC, Fig. 1. All the polymers had narrow polydispersity indices (<1.2), and the measured Mn agrees with those predicted by the feed ratio and the conversion of monomer indicating a controlled polymerisation. The exception was P2, which had a lower Mn than expected according to SEC, indicating that some chain transfer or retarded kinetics occurred, Table 1.
1 with PEG side chain length varying from diethylene glycol to oligoethyleneglycol475. These were characterised by 1H NMR and SEC, Fig. 1. All the polymers had narrow polydispersity indices (<1.2), and the measured Mn agrees with those predicted by the feed ratio and the conversion of monomer indicating a controlled polymerisation. The exception was P2, which had a lower Mn than expected according to SEC, indicating that some chain transfer or retarded kinetics occurred, Table 1.
![Conditions. [Monomer] : [CTA] : [Initiator] = 100 : 1 : 0.2/70 °C/90 min. CTA = 2-cyano-2-propyl benzodithioate. Initiator = AIBN.](/image/article/2011/PY/c0py00408a/c0py00408a-s1.gif) | ||
Scheme 1 Conditions. [Monomer]![[thin space (1/6-em)]](https://www.rsc.org/images/entities/char_2009.gif) : :![[thin space (1/6-em)]](https://www.rsc.org/images/entities/char_2009.gif) [CTA] [CTA]![[thin space (1/6-em)]](https://www.rsc.org/images/entities/char_2009.gif) : :![[thin space (1/6-em)]](https://www.rsc.org/images/entities/char_2009.gif) [Initiator] = 100 [Initiator] = 100![[thin space (1/6-em)]](https://www.rsc.org/images/entities/char_2009.gif) : :![[thin space (1/6-em)]](https://www.rsc.org/images/entities/char_2009.gif) 1 1![[thin space (1/6-em)]](https://www.rsc.org/images/entities/char_2009.gif) : :![[thin space (1/6-em)]](https://www.rsc.org/images/entities/char_2009.gif) 0.2/70 °C/90 min. CTA = 2-cyano-2-propyl benzodithioate. Initiator = AIBN. 0.2/70 °C/90 min. CTA = 2-cyano-2-propyl benzodithioate. Initiator = AIBN. | ||
| Code | Compositiona | Conversionb | M n (theo) c/g mol−1 | M n ( SEC ) d/g mol−1 | M w/Mnd |
|---|---|---|---|---|---|
a Indicates the monomer(s) used in the polymerisation.
b Determined by 1H NMR.
c Determined from the [monomer]![[thin space (1/6-em)]](https://www.rsc.org/images/entities/char_2009.gif) : :![[thin space (1/6-em)]](https://www.rsc.org/images/entities/char_2009.gif) [CTA] ratio and the degree of conversion.
d Determined by SEC in DMF using PMMA standards.
e Ratio of monomers used in polymerisation: PEG9MA [CTA] ratio and the degree of conversion.
d Determined by SEC in DMF using PMMA standards.
e Ratio of monomers used in polymerisation: PEG9MA![[thin space (1/6-em)]](https://www.rsc.org/images/entities/char_2009.gif) : : ![[thin space (1/6-em)]](https://www.rsc.org/images/entities/char_2009.gif) PEG2MA = 8:92.
f
DEGMA = diethylene glycol methacrylate, TEGMA = triethylene glycol methacrylate, OEGMAxxx = oligo(ethylene glycol)methacrylate where the number average molecular weight of the oligo(ethylene glycol) chain is indicated by XXX. PEG2MA = 8:92.
f
DEGMA = diethylene glycol methacrylate, TEGMA = triethylene glycol methacrylate, OEGMAxxx = oligo(ethylene glycol)methacrylate where the number average molecular weight of the oligo(ethylene glycol) chain is indicated by XXX.
|
|||||
| P1 | DEGMA | 70% | 13![[thin space (1/6-em)]](https://www.rsc.org/images/entities/char_2009.gif) 000 000 |
11![[thin space (1/6-em)]](https://www.rsc.org/images/entities/char_2009.gif) 400 400 |
1.13 |
| P2 | OEGMA475-co-DEGMAe | 70% | 20![[thin space (1/6-em)]](https://www.rsc.org/images/entities/char_2009.gif) 700 700 |
9200 | 1.15 |
| P3 | TEGMA | 65% | 13![[thin space (1/6-em)]](https://www.rsc.org/images/entities/char_2009.gif) 900 900 |
9000 | 1.20 |
| P4 | OEGMA300 | 71% | 20![[thin space (1/6-em)]](https://www.rsc.org/images/entities/char_2009.gif) 700 700 |
16![[thin space (1/6-em)]](https://www.rsc.org/images/entities/char_2009.gif) 000 000 |
1.21 |
| P5 | OEGMA475 | 77% | 36![[thin space (1/6-em)]](https://www.rsc.org/images/entities/char_2009.gif) 000 000 |
23![[thin space (1/6-em)]](https://www.rsc.org/images/entities/char_2009.gif) 300 300 |
1.19 |
With this array of polymers at hand, the LCST behaviour could be evaluated. A typical turbidimetry plot obtained in phosphate buffered saline shows an increase in light absorption due to polymer precipitation as the solution is heated through its LCST, Fig. 2. Using this curve, the LCST was defined as being the midpoint of the curve corresponding to a normalised absorbance of 0.5. Strictly speaking this is the cloud point of the solution, and the LCST is actually the minimum of the transition in the phase transition diagram. The quoted LCSTs in this report are the cloud points, to allow direct comparison with other literature in the field. The broadness of the transitions was not considered in this study due to the dependence of this on the test conditions, (e.g. stirring rate, heating rate, method of analysis). It should be noted that the curves were often broader than those shown by Lutz,23 but molecular weights used here are different.
The values of LCST and onset temperature were evaluated for all polymers in the concentration range of 0.5–5 mg mL−1, which was the lower limit of sensitivity of the equipment used. Decreasing the polymer concentration gave an increase in the observed LCST, typically 6 °C over the concentration range tested, Fig. 3. The shape of the curve indicates an exponential increase at lower concentrations, but these could not be measured using turbidimetry (vide infra). The onset temperatures also displayed the same relationship indicating that the whole process, rather than just the midpoint, is shifted to higher temperatures by dilution. Commonly, LCST values are evaluated at concentrations above 5 mg mL−1 which is not relevant for most in vivo applications. If P2 is considered: it was designed to have an LCST ∼37 °C (body temperature). At 10 mg mL−1 in PBS the LCST was 36 °C, but once diluted to 0.5 mg mL−1 (which is still higher than what might be found in vivo) the LCST transition was 42 °C (Fig. 3). If the target transition was, for example, 39 °C then the polymer would fail in its application, clearly indicating that concentration is a critical parameter. To confirm the results from the turbidimetry experiments, dynamic light scattering (DLS) was used as a complimentary technique, Fig. 4, monitoring a change in count rate as a function of temperature as P1 is heated at different concentrations. The count rate is related to the diameter (or more specifically the diffusion coefficient) of the species in solution, and an increased value indicates the formation of larger aggregates (Fig. 5). At 0.25 mg mL−1 the observed LCST was 28.5 °C and at 0.1 mg mL−1 this increased to 33 °C, which is in good agreement with the values obtained by turbidimetry. As a final measure of the LCST, differential scanning calorimetry (DSC) was employed which can unravel the complicated process of mixing/demixing,30 but was used here simply to assign a phase transition temperature. Fig. 6 shows the heat flow through the samples during heating as a function of polymer (P1) concentration.
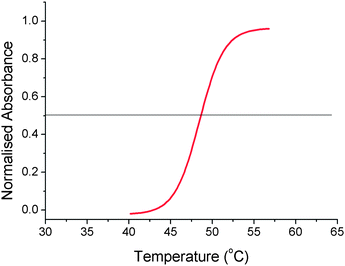 | ||
| Fig. 2 Turbidimetry curve showing LCST transition of P3 (5 mg mL−1) during heating in PBS. Normalised absorbance value of 0.5 (cloud point) is defined as being the LCST. | ||
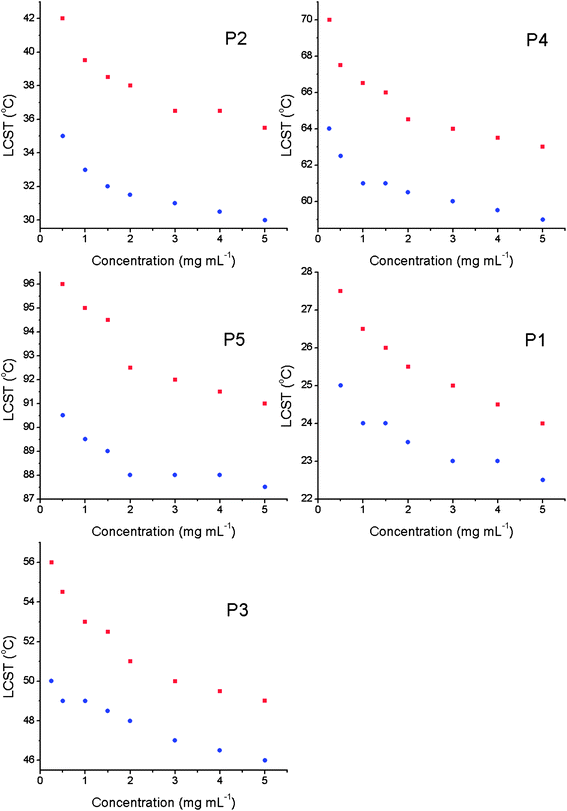 | ||
| Fig. 3 Observed LCST's (red) and LCST onset (blue) of polymers in Table 1, obtained by turbidimetry in PBS. | ||
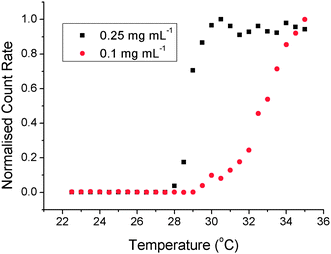 | ||
| Fig. 4 Determination of the LCST in dilute solution using dynamic light scattering for P1 in PBS. | ||
![Measured count rate (by dynamic light scattering) of P2 held isothermally in PBS. [P2] = 1 mg mL−1.](/image/article/2011/PY/c0py00408a/c0py00408a-f5.gif) | ||
| Fig. 5 Measured count rate (by dynamic light scattering) of P2 held isothermally in PBS. [P2] = 1 mg mL−1. | ||
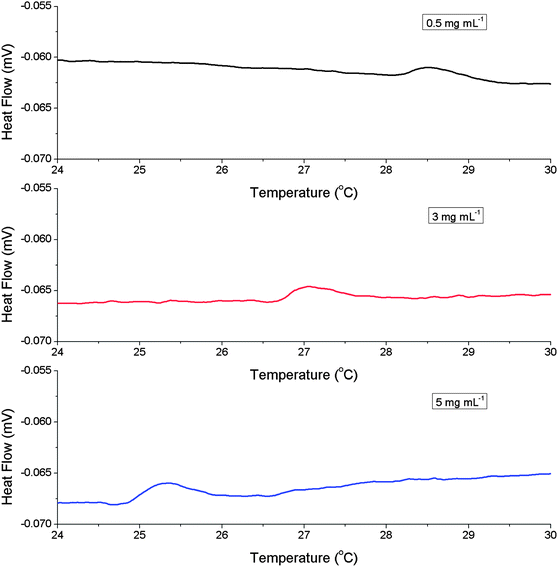 | ||
| Fig. 6 Differential scanning calorimetry thermograms for P1 during heating. | ||
Upon heating, all the samples showed an exothermic transition corresponding to the LCST. The centre of the transition shifted from 28.5 °C for 0.5 mg mL−1polymer concentration to 25.4 °C for 5 mg mL−1. The values agree with those obtained by DLS and turbidimetry indicating that the shift in the LCST upon dilution is real and quantifiable. As the LCST is concentration dependent, this suggests that the transition must involve multiple polymer chains aggregating together. There may be a kinetic barrier at low concentrations, i.e. the polymers chains do not ‘find’ each other as quickly in dilute solution and hence the apparent LCST with a constant heating rate is increased. Therefore, to rule out kinetic factors isothermal experiments were conducted using DLS. P2 was held at either 36 °C or 39 °C (1 mg mL−1) for 20 minutes and the count rate monitored. These temperatures were carefully chosen: 36 °C is above the onset temperature but below the LCST and 39 °C is the LCST and thus acts as a reference sample. If dilution simply slows the aggregation process, the sample held above the onset temperature, but below the LCST, would be expected to aggregate and hence show an increase in the recorded count rate, Fig. 5. At 39 °C, the count rate is extremely high and does not increase any further during the experiment. At 36 °C there is no increase in the count rate after the first 4 minutes, even though the polymer is heated above its onset temperature. Heating this sample above the LCST leads to aggregation and an increase in the count rate. The same experiment conducted using 5 mg mL−1 at 36 °C leads to rapid aggregation, clearly demonstrating the importance of concentration. Taken together, these data show that concentration is a critical factor in describing the LCST transition of thermosensitive polymers.
The next step was to evaluate the influence of dissolved solutes on the LCST, which is again important to be able to predict in vivo properties. For example, different regions of the body or cellular compartments have different concentrations of dissolved solutes. Furthermore, finding the ideal solvent for performing turbidimetry analysis to demonstrate the potential of new materials is also essential to allow direct comparison of the most promising materials. Alexander and co-workers have previously shown the importance of salt concentration on POEGMA-based polymers, and their relationship to the Hofmeister series of ions.31 In the present work the relative influence of NaCl on the LCST of polymers (P1–P5) with different PEG side chains was measured. The influence of NaCl on LCST was measured here and, as expected, increased salt concentration leads to decreased LCST's. The rate of change was uniform for all polymer concentrations and is included in the ESI†. This strong relationship becomes more important when in vivo conditions are considered: in the circulation a polymeric therapeutic is likely to be dissolved in blood plasma which has high concentrations of proteins, amino acids, sugars and salts other than NaCl. Dried bovine plasma was rehydrated and used as a model for the blood plasma conditions likely to be encountered by a polymer therapeutic. P2 was selected as this has an LCST close to 37 °C and is therefore the most physiologically relevant.
The measured LCST values of P2 in bovine plasma are typically 2 °C lower than the same measurement conducted in PBS, and far lower than those measured in dilute NaCl concentration and pure water, Fig. 7. The same trend as observed in Fig. 3 was seen here; reducing polymer concentration increased the LCST. Control experiments of the plasma solution alone did not indicate any increase in turbidity in the temperature range used, ruling out false positive results due to aggregation of dissolved proteins. There are only a few examples of the LCST transition temperature of thermosensitive polymers being studied in the dilute concentration range, probably due to the fact that turbidimetry at high (>5 mg mL−1) concentration is a simpler means of analysis. These results indicate that polymer concentration and solvent are key factors in the design of POEGMA-based materials and should be considered more frequently to allow for comparisons and to attribute observed macroscopic properties (i.e.cell uptake) correctly.
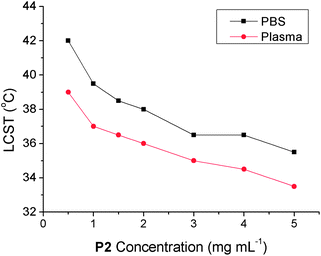 | ||
| Fig. 7 Observed LCST for P2 in phosphate buffer saline (black squares) or bovine plasma (red circles) as a function of polymer concentration. | ||
To exploit LCST transitions for biotechnological or drug delivery applications it is desirable to have an additional active component to the thermoresponsive polymer, e.g. a drug molecule.32 We have previously synthesised complex (co)polymers and polypeptides33,34 for biotechnological applications by direct polymerisation of functional monomers or post-polymerisation modification of preformed polymers.35,36 Alternatively, we demonstrated the site-specific conjugation of initiators suitable for controlled radical/single electron transfer (SET) polymerisation onto reduced cysteine residuesvia a Michael addition (thiol-ene ‘click’) process.37 Here salmon calcitonin (sCT), a 32 amino acid calcitropic hormone currently administered for the treatment of a number of hypercalcemia-related diseases, which can still function when its disulfide bridge is reduced to free cystiene38,39 was modified with an initiator for SET-LRP. A mixture of diethylene glycol methacrylate (DEGMA) and triethylene glycol methacrylate (TEGMA) was copolymerised by SET polymerisation to give a polymer–protein conjugate, Scheme 2. The LCST of this conjugate was measured by turbidimetry in PBS in the range of 5 to 0.5 mg mL−1, Fig. 8. As seen for the polymers alone, upon decreasing the concentration of the conjugate the LCST increased. Temperature-dependent DLS analysis did not reveal the formation of higher-order structures (micelles, vesicles), but rather large (>micron sized) agglomerates indicating aggregation, rather than self-assembly, had occurred. A slight elevation of the LCST compared to a copolymer of DEGMA/TEGMA with similar monomer mole fractions (∼32 °C) was observed, but potential differences in copolymer composition prevent comparisons. Secondly, this conjugate is approximately 10% by weight peptide, meaning the properties of this are strongly controlled by the polymer. Investigations using larger peptides/proteins would provide an interesting comparison.
 | ||
Scheme 2
Polymer–protein conjugate synthesis. Conditions: (i) TCEP, acryloyloxyethyl 2-bromoisobutyrate; (ii) DEGMA/TEGMA (2![[thin space (1/6-em)]](https://www.rsc.org/images/entities/char_2009.gif) : :![[thin space (1/6-em)]](https://www.rsc.org/images/entities/char_2009.gif) 1)/Cu(0)/PMDETA/DMSO/25 °C/180 min/sacrificial initiator. 1)/Cu(0)/PMDETA/DMSO/25 °C/180 min/sacrificial initiator. | ||
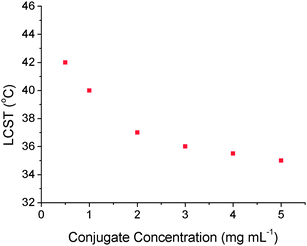 | ||
| Fig. 8 Observed LCST's of calcitonin–polymer conjugate in phosphate buffered saline. | ||
These results suggest that when designing new polymeric drug delivery devices exploiting thermosensitive polymers, the evaluation of the LCST properties should be undertaken as a function of polymer concentration andsolvent conditions. This is essential in order to both fully characterise the material properties, but also to provide sufficient information to explain/allow transition into in vivo and in vitro experiments. We are currently investigating the biological applications of these responsive materials.
Conclusions
Herein we have evaluated the LCST transition temperatures of a range of poly[(oligo(ethylene glycol)methacrylate]s as a function of both the polymer concentration and the aqueous solvent system with the aim being to better predict their biological properties. The LCST was evaluated by turbidimetry, DLS and differential DSC. These measurements indicated that as the concentration is reduced from 5 to 0.5 mg ml−1 (i.e. close to that used in therapeutics) the LCST increased by up to 6 °C. The onset temperature for the LCST transition also shifted to a similar degree. Similar measurements conducted in bovine blood plasma indicated a further significant decrease in LCST as compared to either pure water or PBS highlighting the subtle changes caused by dissolved solutes. A well defined polymer–protein conjugate based on salmon calcitonin and POEGMA was synthesised and demonstrated to display similar concentration dependant behaviour, indicating that these observations apply to actual drug delivery devices not just the isolated polymer.It is important to emphasise that the aim of this work was to highlight the need to consider physiological conditions when synthesising new thermosensitive polymer-based conjugates for biological applications, in particular the dependence of the LCST of the concentration of the polymer (or conjugate) under conditions which are relevant for their intended applications. The large increase in LCST upon dilution could lead to the failure of polymer delivery systems, simply due to inappropriate testing protocols. These results will be used in the future to optimise polymeric drug delivery system for in vivo and in vitro applications.
Experimental
Materials
Oligo(ethylene glycol)n methacrylates, with an average n = 2, 5 and 9, were all purchased from Sigma-Aldrich and passed through a column of basic alumni prior to use. Triethylene glycol methacrylate, initiator functionalised (sacrificial) Wang resin and the salmon calcitonin macroinitiator were synthesised as previously reported.37Azobisisobutyronitrile (AIBN), N,N,N′,N′,N′′-pentamethyldiethylenetriamine (PMDETA), Cu(0) wire (0.25 mm diameter) and sodium chloride (>99%) were purchased from Sigma-Aldrich and used as received. The RAFT agent cyano-2-propyl benzodithioate was purchased from Aldrich. Ultrahigh quality water with a resistance of 18.2 MΩ cm (at 25 °C) was obtained from a Millipore Milli-Q gradient machine fitted with a 0.22 μm filter. Pre-formulated, powdered, phosphate buffered saline was purchased from Sigma-Aldrich and the desired solution made by addition of ultrahigh quality water to give [NaCl] = 0.138 M, [KCl] = 0.0027 M and pH = 7.4. Lyophilized bovine plasma was purchased from Sigma-Aldrich and reconstituted according to the manufacturers specifications using high-quality water.Analytical and physical methods
1H and 13C NMR spectra were recorded on Bruker DPX-300 and DPX-400 spectrometers using deuterated solvents obtained from Sigma-Aldrich. SEC was conducted on a Varian 390-LC system in DMF (1 g L−1LiBr) at 50 °C, equipped with refractive index and viscometry detectors, 2 × PLgel 5 μm mixed-D columns (300 × 7.5 mm), 1 × PLgel 5 μm guard column (50 × 7.5 mm) and autosampler. Data were analysed using Cirrus 3.2 software. Molecular weight was determined relative to narrow poly(methyl methacrylate) standards. Lower critical solution temperatures were evaluated using OptiMelt MPA100 system from Stanford Research Systems. The LCST was determined by normalising the turbidimetry curve such that the values were in the range of 0 to 1, and the transition temperature was defined as being the temperature corresponding to a normalised absorbance of 0.5. A constant heating rate of 2 °C min−1 was used in all experiments. Dynamic light scattering was conducted using a Nano-Zs from Malvern Instruments, UK. Scattered light was detected at 173° and the observed count rates recorded. Hydrodynamic radii (where appropriate) were determined using the manufacturer's software.Procedures
Synthesis of poly[poly(ethylene glycol methyl ether-methacrylate)]
As an example the polymerisation using di(ethyleneglycol) methacrylate is given (P2 in Table 1). Diethylene glycol methacrylate (2 g, 10 mmol) was added to a Schlenk tube and 2 mL of dioxane added. Next, 0.67 mL of a dioxane solution containing 0.16 M 2-cyano-2-propyl benzodithiolate and 24 mM of azobisisobutyronitrile (AIBN) was added to the Schlenk tube by syringe giving [monomer]![[thin space (1/6-em)]](https://www.rsc.org/images/entities/char_2009.gif) :
:![[thin space (1/6-em)]](https://www.rsc.org/images/entities/char_2009.gif) [initiator]
[initiator]![[thin space (1/6-em)]](https://www.rsc.org/images/entities/char_2009.gif) :
:![[thin space (1/6-em)]](https://www.rsc.org/images/entities/char_2009.gif) [chain transfer agent] = 100
[chain transfer agent] = 100![[thin space (1/6-em)]](https://www.rsc.org/images/entities/char_2009.gif) :
:![[thin space (1/6-em)]](https://www.rsc.org/images/entities/char_2009.gif) 0.2
0.2![[thin space (1/6-em)]](https://www.rsc.org/images/entities/char_2009.gif) :
:![[thin space (1/6-em)]](https://www.rsc.org/images/entities/char_2009.gif) 1. The solution was degassed by 4 freeze–pump–thaw cycles and back-filled with nitrogen gas. The flask was then immersed into a thermostated oil bath at 70 °C for 180 minutes. After this time, a 25 μL sample was removed and diluted with CDCl3 for NMR analysis. The remainder was rapidly cooled in an ice-water bath and precipitated into diethyl ether (35 mL). The polymer was re-precipitated from THF to diethyl ether twice to yield a waxy pink polymer. Isolated yield: 1.05 g, 53%; Conversion (NMR): 70%; Mn (theo): 20
1. The solution was degassed by 4 freeze–pump–thaw cycles and back-filled with nitrogen gas. The flask was then immersed into a thermostated oil bath at 70 °C for 180 minutes. After this time, a 25 μL sample was removed and diluted with CDCl3 for NMR analysis. The remainder was rapidly cooled in an ice-water bath and precipitated into diethyl ether (35 mL). The polymer was re-precipitated from THF to diethyl ether twice to yield a waxy pink polymer. Isolated yield: 1.05 g, 53%; Conversion (NMR): 70%; Mn (theo): 20![[thin space (1/6-em)]](https://www.rsc.org/images/entities/char_2009.gif) 700 g mol−1; Mn (SEC): 9200 g mol−1; Mw/Mn = 1.15 (SEC).
700 g mol−1; Mn (SEC): 9200 g mol−1; Mw/Mn = 1.15 (SEC).
1H NMR (300 MHz, CDCl3) δppm: 1.41 (3H, backbone-CH3) 1.80–2.00 (2H, backbone-CH2), 3.35 (3H, CH3-PEG), 3.40–3.80 (16H, CH2CH2O), 4.09 (2H, CH2OC(![[double bond, length as m-dash]](https://www.rsc.org/images/entities/char_e001.gif) O)), 7.42 (o-Ar, end-group), 7.61 (p-Ar, end-group), 7.85 (m-Ar, end-group).
O)), 7.42 (o-Ar, end-group), 7.61 (p-Ar, end-group), 7.85 (m-Ar, end-group).
Salmon calcitonin-poly(DEGMA-co-TEGMA) conjugate
The salmon calcitonin macroinitiator (4.2 mg, 1.3 μm) was added to a Schlenk tube along with an initiator-functional Wang resin (0.442 g, 1.32 mmol), 5 cm of copper (0) wire (0.25 mm diameter), copper (II) bromide (29.6 mg, 0.13 mmol) and a magnetic stirrer bar. The Schlenk was sealed, thoroughly degassed and purged with nitrogen. In a separate Schlenk tube, diethylene glycol methacrylate (3.30 g, 17.5 mmol), triethylene glycol methacrylate (2.05 g, 8.8 mmol), DMSO (10 mL), N,N,N′,N′,N′′-pentamethyldiethylenetriamine (0.43 mL, 1.99 mmol) and mesitylene (0.37 mL, 2.6 mmol) were added and subjected to four freeze–pump–thaw cycles. The degassed solution was transferred via cannula to the first Schlenk tube and immersed in an oil bath at 25 °C for 180 min at which point the polymerisation was quenched in liquid nitrogen and filtered to remove solids. The remaining solution was dialysed against a 50![[thin space (1/6-em)]](https://www.rsc.org/images/entities/char_2009.gif) :
:![[thin space (1/6-em)]](https://www.rsc.org/images/entities/char_2009.gif) 50 mixture of water/methanol for 3 days and 1 day against pure water. The solution was then lyophilised and the conjugate isolated as a colourless oil. Mn (SEC): 33
50 mixture of water/methanol for 3 days and 1 day against pure water. The solution was then lyophilised and the conjugate isolated as a colourless oil. Mn (SEC): 33![[thin space (1/6-em)]](https://www.rsc.org/images/entities/char_2009.gif) 000 g mol−1; Mw/Mn = 1.49.
000 g mol−1; Mw/Mn = 1.49.
Acknowledgements
Equipment used was supported by the Innovative Uses for Advanced Materials in the Modern World (AM2), with support from Advantage West Midlands (AWM) and part funded by the European Regional Development Fund (ERDF). MIG is a Birmingham Science City Interdisciplinary Research Fellow, supported HEFCE. We thank EPSRC and Warwick Effect Polymers for funding (MJ).References
- D. Urry, Angew. Chem., Int. Ed. Engl., 1993, 32, 819–841 CrossRef.
- E. S. Gil and S. M. Hudson, Prog. Polym. Sci., 2004, 29, 1173–1222 CrossRef CAS.
- N. Nath and A. Chilkoit, Adv. Mater., 2002, 14, 1243–1247 CrossRef CAS.
- J.-F. Lutz, J. Polym. Sci., Part A: Polym. Chem., 2008, 46, 3459–3470 CrossRef CAS.
- M. A. Cooperstein and H. E. Canavan, Langmuir, 2010, 26, 7695–7707 CrossRef CAS.
- C. Lavigueur, J. G. Garcia, L. Hendriks, R. Hoogenboom, J. J. L. M. Cornelissen and R. J. M. Nolte, Polym. Chem., 2011, 2, 333–340 RSC.
- J. Akimoto, N. Masamichi, K. Sakai and T. Okano, Mol. Pharm., 2010, 7, 926–935 CAS.
- D. E. Meyer, B. C. Shin, G. A. Kong, M. W. Dewhirst and A. Chilkoit, J. Controlled Release, 2001, 74, 213–224 CrossRef CAS.
- M.-Q. Zhu, L.-Q. Wang, G. J. Exarhos and A. D. Q. Li, J. Am. Chem. Soc., 2004, 126, 2656–2657 CrossRef CAS.
- C.-W. Chang, T. H. Nguyen and H. D. Maynard, Macromol. Rapid Commun., 2010, 31, 1691–1695 CrossRef CAS.
- C. Pietsch, R. Hoogenboom and U. S. Schubert, Angew. Chem., Int. Ed., 2009, 48, 5653–5656 CrossRef CAS.
- C. Gota, K. Okabe, T. Funatsu, Y. Harada and S. Uchiyama, J. Am. Chem. Soc., 2009, 131, 2766–2767 CrossRef CAS.
- G. Pasparakis, A. Cockayne and C. Alexander, J. Am. Chem. Soc., 2007, 129, 11014–11015 CrossRef CAS.
- M. I. Gibson, D. Paripovic and H.-A. Klok, Adv. Mater., 2010, 22, 4721–4725 CrossRef CAS.
- F. Fernandez-Trillo, J. C. M. van Hest, J. C. Thies, T. Michon, R. Weberskirch and N. R. Cameron, Adv. Mater., 2009, 20, 1–6.
- S. Fujishige, K. Kubota and I. Ando, J. Phys. Chem., 1989, 93, 3311–3313 CrossRef CAS.
- R. Hoogenboom, H. M. L. Thijs, M. J. H. C. Jochems, B. M. van Lankvelt, M. W. M. Fijten and U. S. Schubert, Chem. Commun., 2008, 5758–5760 RSC.
- F. Fernandez-Trillo, A. Dureault, J. P. M. Bayley, J. C. M. van Hest, J. C. Thies, T. Michon, R. Weberskirch and N. R. Cameron, Macromolecules, 2007, 40, 6094–6099 CrossRef CAS.
- J.-F. Lutz and A. Hoth, Macromolecules, 2006, 39, 893–896 CrossRef CAS.
- C.-W. Chang, E. Bays, L. Tao, S. N. S. Alconcel and H. D. Maynard, Chem. Commun., 1999, 3580–3582 Search PubMed.
- X. Fan, L. Lin and P. B. Messersmith, Biomacromolecules, 2006, 7, 2443–2448 CrossRef CAS.
- J. Wang, M. I. Gibson, R. Barbey, S.-J. Xiao and H.-A. Klok, Macromol. Rapid Commun., 2009, 30, 845–850 CrossRef CAS; M. J. Joralemon, S. Mcrae and T. Emrick, Chem. Commun., 2010, 46, 1377 RSC.
- J.-F. Lutz, O. Akdemir and A. Hoth, J. Am. Chem. Soc., 2006, 128, 13046–13047 CrossRef CAS.
- C. R. Becer, S. Hahn, M. W. M. Fijten, H. M. L. Thijs, R. Hoogenboom and U. S. Schubert, J. Polym. Sci., Part A: Polym. Chem., 2008, 46, 7138–7147 CrossRef CAS.
- P. J. Roth, F. D. Jochum, F. R. Forst, R. Zentel and P. Theato, Macromolecules, 2010, 43, 4638–4645 CrossRef CAS.
- M. Luzon, C. Boyer, C. Peinado, T. Corrales, M. Whittaker, L. Tao and T. P. Davis, J. Polym. Sci., Part A: Polym. Chem., 2010, 48, 2783–2792 CrossRef CAS.
- W. Li, A. Zhang and A. D. Schluter, Chem. Commun., 2008, 5523–5525 RSC.
- R. M. Conrad and R. H. Grubbs, Angew. Chem., Int. Ed., 2009, 48, 8328–8330 CrossRef CAS.
- S. Salmaso, P. Caliceti, V. Amendola, M. Meneghetti, J. P. Magnusson, G. Pasparakis and C. Alexander, J. Mater. Chem., 2009, 19, 1608–1615 RSC.
- J. Zhao, R. Hoogenboom, G. Van Assche and B. Van Mele, Macromolecules, 2010, 43, 6853–6860 CrossRef CAS.
- J. P. Magnusson, A. Khan, G. Pasparakis, A. O. Saeed, W. Wang and C. Alexander, J. Am. Chem. Soc., 2008, 130, 10852–10853 CrossRef CAS.
- L. A. Canalle, D. W. P. M. Lowik and J. C. M. van Hest, Chem. Soc. Rev., 2010, 39, 329 RSC; K. Velonia, Polym. Chem., 2010, 1, 944 RSC.
- M. I. Gibson and N. R. Cameron, Angew. Chem., Int. Ed., 2008, 47, 5160–5162 CrossRef CAS.
- M. I. Gibson and N. R. Cameron, J. Polym. Sci., Part A: Polym. Chem., 2009, 47, 2882–2891 CrossRef CAS.
- M. A. Gauthier, M. I. Gibson and H.-A. Klok, Angew. Chem., Int. Ed., 2009, 48, 48–58 CrossRef CAS.
- M. I. Gibson, E. Frohlich and H.-A. Klok, J. Polym. Sci., Part A: Polym. Chem., 2009, 47, 4332–4345 CrossRef CAS.
- M. W. Jones, M. I. Gibson, G. Mantovani and D. M. Haddleton, Polym. Chem., 2011 10.1039/c0py00329h.
- J. Wang, D. Chow, H. Heiati and W.-C. Shen, J. Controlled Release, 2003, 88, 369–380 CrossRef CAS.
- S. Ryan, X. Wang, G. Mantovani, C. T. Sayers, D. M. Haddleton and D. J. Brayden, J. Controlled Release, 2009, 135, 51–59 CrossRef CAS.
Footnote |
| † Electronic supplementary information (ESI) available. See DOI: 10.1039/c0py00408a |
| This journal is © The Royal Society of Chemistry 2011 |

