Shape evolution control of phase-separated colloidal nanoparticles†
Cathrin C.
Corten
and
Marek W.
Urban
*
School of Polymers and High Performance Materials, The University of Southern Mississippi, Hattiesburg, Mississippi 39406, USA
First published on 22nd September 2010
Abstract
These studies illustrate controlled shape synthesis of two distinct phase-separated copolymers within one colloidal nanoparticle which consists of poly(methylmethacrylate) (p-MMA)/n-butylacrylate (nBA) and poly(nBA)/pentafluorostyrene (p-PFS) phases. Using sequential free radical polymerization, particle morphologies ranging from acorn to ellipsoidal, core–shell, and spherical were produced by adjusting the glass transition temperature (Tg) via compositional gradients during copolymerization. These studies show for the first time that in order to achieve desirable asymmetric particle shapes, the Tg as well as interfacial surface tension between two copolymers within one nanoparticle should be maintained during and after polymerization.
Introduction
Mother Nature has mastered orchestrated growth as well as stimuli-responsiveness of biological species, which often inspired developments of new materials that mimic shapes and adoptability observed in the natural world. Many observations stimulated not only novel physico-chemical concepts manifested by an ongoing quest for novel stimuli-responsive nanomaterials,1 but also challenged scientists and engineers to create controllable nano-scale shapes. Examples of such assemblies are multiphase nanoparticles,2,3 cocklebur4 or hollow nanoparticles,5 non-spherical heterogeneous particles as well as other nano-objects with a high aspect ratio, such as nanotubes, nanorods,6–8 or cilia-like surfaces.9 Although numerous past studies have shown that creating none-spherical nano-objects often requires the use of templates, one would like to monitor and follow shape developments by controlling chemico-physical processes. Polymerization reactions, if designed properly, may provide such opportunities.While many advantages of reversible addition chain transfer polymerization (RAFT),10 atom transfer radical polymerization (ATRP)11 as well as nitroxide mediated polymerization (NMP)12 significantly contributed to advances in a precise control of molecular weight as well as the placement of monomer sequences or side chains, making heterogeneous shapes at nano- or micro-scales represents another level of difficulties. One could argue that precise synthetic methods alone may not be sufficient in developing orchestrated networks, especially when larger scale heterogeneous entities resembling or interacting with biological systems are sought. Emulsion polymerization represents an example that typically generates a fairly broad range of molecular weight distributions using batch13 or semi-continuous synthesis,3 but the shape and particle morphology controls may be achieved by designing suitable synthetic conditions. Furthermore, one can take advantage of a multi-stage synthesis,14,15 and produce various nano-scale objects manifested by already existing technologies in photolithographic,16,17 internal phase separation18,19 or coaxial jet extrusion20 processes. Although colloidal synthesis has found many applications, it can be affected by other adverse factors.21,3 These include solubility and reactivity of monomers, control of surface tension by dispersing species, and polymerization conditions, just to name a few. To draw the analogy from biological processes which typically involve many components and conditions required to achieve desirable species, the particle shape control may not be trivial unless all components and conditions satisfy inter- and intra molecular interactions as well as chemico-physical reaction conditions.
Recent examples of synthesis of acorn-shape colloidal particles illustrated that heterogeneous colloidal synthesis can lead to stable water-dispersible particles3 in which the choice of monomers and dispersing components dictates synthetic conditions for F-containing low surface tension colloidal nanoparticles. These studies have also shown that the glass transition temperature (Tg) development during and after polymerization plays a key role in the shape development and particle stability. In an effort to develop heterogeneous colloidal particles with controllable and desirable shapes, these studies focus on synthesis of two-phase colloidal particles which show for the first time how compositional changes during synthesis and the Tg adjustments facilitate conditions for shape developments of multiphase copolymer nanoparticles.
Experimental section
Methyl methacrylate (MMA), n-butyl-acrylate (n-BA), pentafluorostyrene (PFS) and dioctylsulfosuccinate (SDOSS) were purchased from Aldrich Chemical Co. 2,2′-Azobis[2-2(2-imidazolin-2-yl) propane] dihydrochloride (VA-44) initiator was purchased from Wako Pure Chemicals Ind. Ldt. Bio-Rad AG®502-X8 cation-anion resin was purchased from Bio-Rad Laboratories, Inc. Polytetrafluoroethylene (PTFE) substrate was purchased from Electron Microscopy Sciences, Inc.p-nBA/PFS and p-MMA/nBA primary colloidal dispersions were synthesized using a semi-continuous process outlined elsewhere,22,23 and adapted for small scale polymerization. The reaction flask was placed in a water bath set at 50 °C, purged with N2 gas, charged with 30ml of DDI water under continuous stirring at 350 rpm, whereby SDOSS surfactant was utilized. Table 1 provides ratios of colloidal dispersions prepared for the purpose of these studies. SDOSS was dissolved in water followed by the addition of monomers in the given ratios to produce a semi-stable pre-emulsion. The pre-emulsion was fed continuously over the period of 4 h while the initiator solution was added for 4.5 h. Upon completion of the initiator feed, polymerization was continued for another 10 h. The second step involved copolymerizing nBA and PFS monomers on the seed (MMA/nBA) particles in the given ratios listed in Table 1.To completely remove ionic species from the system, resin exchange experiments were performed on colloidal solutions utilizing Bio-Rad® AG 501-X8 cation-anion resins. 2 g of activated resin was placed in a beaker, followed by the addition of a 5 mL colloidal dispersion, 15 mL DDI water, stirring overnight, and filtering.
| Composition (w/w%) | P100/0 | P80/20 | P60/40 | P55/45 | P50/50 | P45/55 | P40/60 | P20/80 | P0/100 | |||||||||
|---|---|---|---|---|---|---|---|---|---|---|---|---|---|---|---|---|---|---|
| Seed | S2 | Seed | S2 | Seed | S2 | Seed | S2 | Seed | S2 | Seed | S2 | Seed | S2 | Seed | S2 | Seed | S2 | |
| Seed | 50 | 50 | 50 | 50 | 50 | 50 | 50 | 50 | 50 | |||||||||
| MMA | 40 | 32 | 24 | 22 | 20 | 18 | 16 | 8 | — | |||||||||
| nBA | -- | 10.9 | 8 | 10.9 | 16 | 10.9 | 18 | 10.9 | 20 | 10.9 | 22 | 10.9 | 24 | 10.9 | 32 | 10.9 | 40 | 10.9 |
| PFS | -- | 10.9 | -- | 10.9 | -- | 10.9 | -- | 10.9 | -- | 10.9 | -- | 10.9 | -- | 10.9 | -- | 10.9 | -- | 10.9 |
| DDI | 30 | 0.66 | 30 | 0.66 | 30 | 0.66 | 30 | 0.66 | 30 | 0.66 | 30 | 0.66 | 30 | 0.66 | 30 | 0.66 | 30 | 0.66 |
| SDOSS | 1.22 | 27.4 | 1.22 | 27.4 | 1.22 | 27.4 | 1.22 | 27.4 | 1.22 | 27.4 | 1.22 | 27.4 | 1.22 | 27.4 | 1.22 | 27.4 | 1.22 | 27.4 |
| VA-44 | 0.08 | 0.04 | 0.08 | 0.04 | 0.08 | 0.04 | 0.08 | 0.04 | 0.08 | 0.04 | 0.08 | 0.04 | 0.08 | 0.04 | 0.08 | 0.04 | 0.08 | 0.04 |
| Particle Size (nm) | 65 | 90 | 80 | 99 | 89 | 108 | 98 | 112 | 104 | 115 | 110 | 120 | 115 | 125 | 125 | 133 | 130 | 143 |
| Exp. MMA/nBA ratio (w/w %)* | 100/0 | 77/23 | 65/35 | 57/43 | 52/48 | 46/54 | 41/59 | 22/78 | 0/100 | |||||||||
Particle size analysis was performed using a Malvern Zetasizer Nanoseries Nano-ZS (Malvern Instrument) equipped with a 633 nm laser, at a constant backscattering angle of 173° at 25 °C. The hydrodynamic diameter was calculated using the Stokes–Einstein relation.24 Morphologies of the resulting colloidal particles were investigated using a JEOL TEM-2100 transmission electron microscope (TEM) operated at 200 kV. The samples were placed in a dilution of 1![[thin space (1/6-em)]](https://www.rsc.org/images/entities/char_2009.gif) :
:![[thin space (1/6-em)]](https://www.rsc.org/images/entities/char_2009.gif) 10000 on a Formvar/Carbon Copper grid (EMS) with 300 Mesh.
10000 on a Formvar/Carbon Copper grid (EMS) with 300 Mesh.
Atomic force microscopy (AFM) measurements were conducted on a Nanoscope IIIa Dimension 3000 scanning probe microscope (Digital Instruments). A silica probe with a 125 mm long silicacantilever, a nominal force constant of 40 Nm−1, and resonance frequency of 275 kHz and a scan rate of 1 Hz were used in a tapping mode, thus allowing surface topography and roughness measurements.
Static and dynamic contact angle measurements were conducted using a single drop technique using a ramé-hart goniometer coupled with a DROP image data analysis software. 10 μl drops were placed onto a flat surface and an image of the drop was captured. The surface energy was calculated utilizing Fowkes25 and Owens–Wendt26 method by measuring the contact angle between p-MMA/nBAand p-nBA/PFS film surface and distilled de-ionized water (DDI) as well as methylene iodide. The glass transition temperature (Tg) was measured using differential scanning calorimetry (DSC) (TA instruments Q100) in the temperature range of −55 °C–200 °C at a heating rate of 10 °C/min. Grazing-angle attenuated total reflectance Fourier transform infrared (GATR FT-IR) spectroscopy measurements were conducted at the film-air (F-A) interfaces using a BioRad FTS 6000 FT-IR single beam spectrometer at a 4 cm−1 resolution. The surfaces were analyzed using a 2 mm Ge-Crystal with a 65° angle maintaining constant contact pressure between the crystal and the specimens. All spectra were recorded for spectral distortions using software for the Urban-Huang algorithm.2713C-NMR spectra were acquired on a Varian UNITYINOVA spectrometer operating at a frequency of 125 MHz for carbon and using a standard 5 mm two channel probe. For quantitative analysis recycle delay of 30 s was used. In addition, the proton decoupler was gated off during the recycle period in order to suppress signal enhancement due to NOE. Spectral acquisition was performed at 90 °C to narrow the peak width, and integrated peak areas of the alkyl methyl carbons of MMA and nBa were used to determine copolymer compositions. Free induction decays (FIDs) were zero-filled to 128k and an exponential line broadening of 10 Hz was applied prior to Fourier transformation. Base lines were corrected using linear prediction and polynomial fitting.
Coalescence of one particle layer thick films was conducted by spin-coating depositing of P100/0-S2, P50/50-S2, and P0/100-S2 colloidal dispersions on polytetrafluoroethylene (PTFE) and silica (SiO2) substrates. Such liquid films were allowed to dry overnight under ambient conditions. An approximate film thickness of coalesced films was 70 nm.
Results and discussion
Particle morphology control
Fig. 1-a, A through I, illustrates TEM images of colloidal nanoparticles prepared by sequential polymerization of seed copolymers of n-butyl acrylate (nBA) and methyl methacrylate (MMA), followed by copolymerization of p-nBA/PFS at 50/50 ratio. The MMA/nBA feed ratio of the seed was adjusted from 100 to 0 wt%, in 5–20% increments. Table 1 provides the summary of compositions utilized for the purpose of these studies. The actual MMA/nBA ratio of the copolymer was determined using 13C-NMR spectroscopy, as outlined in the Supporting Documents of Fig. S-1.† The TEM images shown in Fig. 1 illustrate that each particle consists of two phases: p-MMA/nBA (lighter) and p-nBA/PFS (darker), the latter being darker due to a higher election density of the fluorinated component of the copolymer. As seen, such prepared colloidal particles consist of p-MMA/nBA and p-nBA/PFS phases, and the shape of each phase changes as a function of the MMA/nBA ratio. Fig. 1 also shows that when MMA/nBA ≈ 1, acorn shape particles are produced (Image E), but when MMA/nBA > 1 (Images A–D), instead of a hemispherical shape, an inverse acorn is obtained. In contrast, when MMA/nBA < 1 (Images F-I), initially asymmetric particles assume symmetric core–shell morphologies. It should be noted that as MMA/nBA≪1, phase inversions occur, and the initial p-MMA/nBA core becomes shell, whereas the p-nBA/PFS phase resides as core.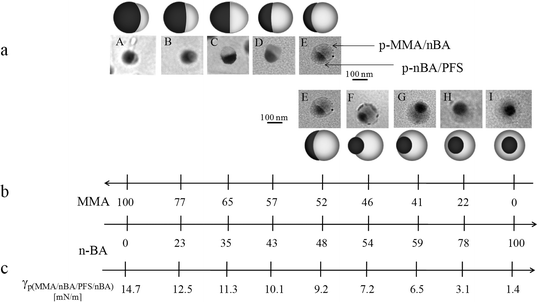 | ||
| Fig. 1 TEM micrographs of colloidal particles consisting of (A) P100/0-S2, (B) P80/20-S2,(C)(P60/40-S2, (D) P55/45- S2,(E) P55/50-S2, (F) P45/55-S2, (G) P40/60-S2, (H) P20/80-S2, (I) P0/100-S2. Table 1 provides a compositional content. | ||
In view of these data there are several factors that influence the shape of colloidal particles. While reaction conditions such as temperature, reactivity ratios of monomers, and monomer solubility, along with the ability of dispersing agents to lower the surface tension28 play an essential role during polymerization, another aspect is the shape development and its stability during polymerization. After all, it is well established4 that when the low TgnBA monomer is initially polymerized, followed by polymerization of a high Tg monomer, such as styrene (Sty) or MMA, the core–shell morphology is produced. However, regardless of the polymerization order, the higher Tgpolymer core will be always surrounded by a softer shell. This behavior is attributed to the low Tgpolymer phase inversion during the synthesis. As illustrated in the TEM images shown in Fig. 1, p-MMA/nBA/p-nBA/PFS particles not only maintain their shapes, which are attributed to significant temperature differences between the reaction temperature (T) and the Tg of the growing particles,2,29 but also retain p-MMA/nBA copolymer composition.
Postponing temporarily the influence of the Tg development during polymerization, let us consider the effect of the interfacial surface tension between p-MMA/nBA and p-nBA/PFS phases on the particle stability. To analytically determine the influence of the interfacial surface tension effect, it is not only necessary to eliminate surface active components and ionic species in the dispersion, but also to determine the surface tension between the two phases within one particle. For that reason colloidal dispersions were subjected to a resin exchange,3 allowing the separation of ionic species from colloidal dispersions. Such “disinfected” dispersions were coalesced and the contact angle measurements were conducted on the following film surfaces: p-nBA/PFS, p-nBA, p-MMA, and p-MMA/nBA copolymers. Using static contact angle data summarized in Table 2, we utilized Young's equation30WA = γLV (1 + cosθ), (where: γLV, γSV are liquid–vapor and solid vapor interfacial tensions, respectively, and θ is the contact angle) to determine polar (γpSV) and disperse (γdSV) contributions to the surface energies. The following relationship, WA = 2[{γdSV * γdSV}½+ {γpSV* γpSV}1/2],25,26 was used and the γp and γd values of coalesced films are listed in Table 2. In turn, these values were utilized to determine interfacial surface tension between the two phases within one particle using the following relationship:31
| Copolymer Composition | RRMS | Static Contact Angle [°] | γ [mN/m] | γdsv [mN/m] | γpsv [mN/m] | |
|---|---|---|---|---|---|---|
| [nm] | Water | Methylene Iodide | ||||
| P100/0 | 21.2 | 51 | 43 | 56.31 | 38.07 | 18.24 |
| P80/20 | 15.21 | 56 | 46 | 52.46 | 36.47 | 15.99 |
| P60/40 | 9.21 | 60 | 51 | 48.53 | 33.71 | 14.82 |
| P55/45 | 5.21 | 63 | 53 | 46.12 | 32.59 | 13.53 |
| P50/50 | 3.34 | 65 | 54 | 44.63 | 32.02 | 12.61 |
| P45/55 | 2.9 | 69 | 57 | 41.35 | 30.30 | 11.05 |
| P40/60 | 3.25 | 73 | 61 | 37.78 | 28.00 | 9.78 |
| P20/80 | 2.7 | 78 | 65 | 31.78 | 25.70 | 6.08 |
| P0/100 | 1,08 | 82 | 69 | 27.41 | 23.43 | 3.98 |
| p-nBA/PFS 50/50 S2 | 2.5 | 103 | 78 | 19.82 | 18.53 | 1.29 |
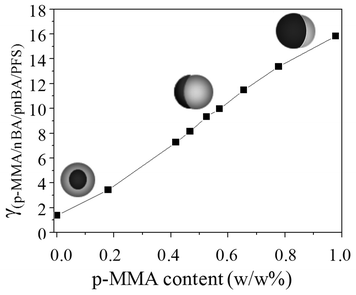 | ||
| Fig. 2 Interfacial surface tension of γ(p-MMA/nBA//p-nBA/PFS) plotted as a function of p-MMA content of the seed. | ||
With these considerations in mind let us go back to the Tg effect. Using p-nBA (P0/100) (Tg = −49 °C) as seed or shell, the same core–shell morphologies were produced. This is demonstrated in Fig. 3, A and A′, where dark areas in the TEM images are due to p-nBA/PFS core (higher electron density) and lighter areas represent the p-MMA/nBA phase. However, when two phases exhibit similar Tg values which are above the synthesis temperature, both phases exhibit controllable flow at the reaction temperature of 50 °C, thus retaining their morphologies. As shown in Fig. 3, B and B′, for a 50/50 p-MMA/nBA (Tg = 16 °C) and p-nBA/PFS (Tg = 20 °C), the acorn-shape morphologies are stable, and further increase of the Tg to 110 °C (P100/0) also results in stable inverted acorn morphologies (Fig. 3 C and C′). Using p-MMA as the seed, the p-nBA/PFS phase facilitates sufficient flow leading to inverse acorn-shape morphologies. However, starting with the p-nBA/PFS core, the p-MMA/nBA shell with a content of 100% MMA is unable to flow under these reaction conditions. In summary, the interfacial surface tension and the Tg control during polymerization play a major role in the particle shape developments and their maintenance during and after synthesis.
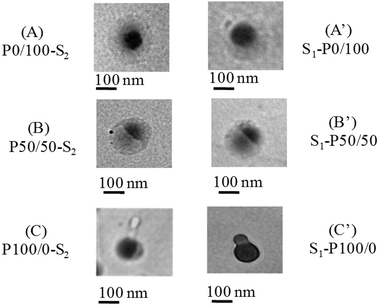 | ||
| Fig. 3 TEM micrographs of colloidal particles of P0/100-S2(A), S1-P0/100(A′), P50/50-S2 (B), S1-P50/50 (B′), P100/0-S2, (C) S1-P100/0 (C′). | ||
To examine the role of the Tg of the seed copolymer under given reaction temperature (T) conditions, the values of |T-Tg|/Tg (|ΔT|/Tg) were tabulated in Table 3 and plotted as a function of the copolymer seed composition. This is shown in Fig. 4 which illustrates that when the reaction temperature is set at 30 °C, the minimum is obtained at MMA/nBA = 1 ratio (curve A), but increasing the temperature to 50 °C shifts the minimum to 0.65 p-MMA content (curve B). At this point, the mass flow of the seed as well the shell are minimized due to the high interfacial surface tension giving hemispherical morphologies. However, when the reaction temperature is set at 100 °C, no minimum is observed (curve C), which is attributed to the flow of the copolymer significantly above its Tg.
| Copolymer Composition | Tg (°C) | |Tg-T| (°C) | TgSeed -TgShell (°C) |
|---|---|---|---|
| P100/0 | 100.6 | 50.6 | 80.6 |
| P80/20 | 77.7 | 27.7 | 57.7 |
| P60/40 | 55.7 | 5.7 | 35.7 |
| P55/45 | 39.8 | 10.2 | 19.8 |
| P50/50 | 23.0 | 26.9 | 3 |
| P45/55 | 19 | 48.1 | −1 |
| P40/60 | −13.5 | 63.5 | −33.5 |
| P20/80 | −33.31 | 83.3 | −53.31 |
| P0/100 | −49.2 | 99.2 | −69.2 |
| nBA/PFS 50/50 S2 | 20 | 30 |
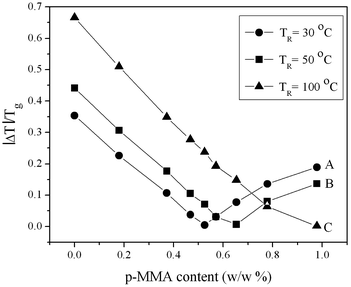 | ||
| Fig. 4 |ΔT|/Tg plotted as a function of p-MMA (w/w %) content at T = 30 °C (●) (A), T = 50 °C (■) (B), T = 100 °C (▲) (C). | ||
In an effort to determine the influence of the interfacial particle surface tension, Fig. 5 illustrates the relationship between |ΔT|/Tg, the MMA (w/w%) content in p-MMA/nBA copolymer, and the interfacial surface tension. These data show that when T > Tg, the polymer flow is enhanced, and core–shell particles are obtained, regardless of the p-MMA content. These conditions are marked in Fig. 5, as AB zone. Furthermore, regardless of the order of the low Tg component polymerization, the core–shell morphologies consisting of a hard-core and soft shell are obtained as long as T≫Tg. When T < Tg, the system is highly sensitive to compositional changes and temperature variations, where anisotropic morphologies (for example, acorn) can be produced, which is labeled as zone BC in Fig. 5. In contrast, hemispherical morphologies at the ΔT/Tg minimum will dominate the region marked C in Fig. 5. Further increase of the MMA content leads to inversed acorn shape particles obtained under the high values of the interfacial tension energy (11–15 mN/m) conditions represented by the CD zone in Fig. 5. Within the CD zone, the Tg of the core and the shell as well as the order of polymerization play a significant role. Specifically, for two copolymers with Tg1 and Tg2 glass transition temperatures, for Tg1 > Tg2 and Tg2 < T < Tg1, inverse acorn shape particles will be produced, but when Tg1 < Tg2 and Tg1 < T ≪ Tg2, phase separation within the particle will occur, leading to two-sphere morphologies shown in Fig. 3B.
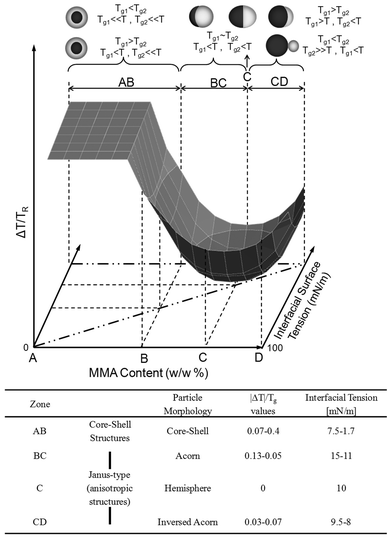 | ||
| Fig. 5 |ΔT|/Tg plotted as a function of interfacial surface tension and the p-MMA content (w/w %). | ||
Coalescence of controllable shape morphologies
The presence of two-phase copolymer colloidal particles will also influence their coalescence. Fig. 6 illustrates assembled monolayer particle films obtained by the coalescence of P100/0-S2 (A), P50/50-S2 (B), P0/100-S2 (C) particles, where P100/0-S2 and P50/50-S2 exhibit a phase separation, and P0/100-S2 is the phase separated p-nBA/PFS copolymer surrounded by p-nBA. In an effort to determine the influence of the surface energy of acorn shape particles on coalescence on substrates with significantly different surface energies, we coalesced one-particle layer thick films (approx. thickness: 70 nm) on polytetrafluoroetylene (PTFE) (=18.5 mN/m) and SiO2 (γ = 78 mN/m)30 substrates. Upon coalescence, the contact angle measurements (using water) were performed and are summarized in Table 4. For P100/0-S2, P50/50-S2 and P0/100-S2, the p-nBA/PFS rich phase of the acorn particle stratifies near the film-substrate (F-S) interface on the low surface tension PTFE substrate (18.5 mN/m). In contrast, the same particles coalesced on the higher surface energy SiO2 substrate resulted in the p-MMA rich phase which aligns itself toward the F-S interface, while the p-nBA/PFS phase is oriented outwards. However, slightly higher hydrophilic p-MMA leads to the decrease of the static contact angle to θS = 90° (θS = 95°) for P50/50-S2 particles on SiO2. Due to P0/100-S2 core–shell morphologies and the enhanced hydrophobic character of p-nBA, the static contact angle increased to 97° on SiO2. These observations were also confirmed by GATR FT-IR and AFM analysis shown in Figures S-2A and S-2B of the Supporting Documents. In summary, these data show that non-spherical, dual phase heterogeneous particle morphologies may provide means for the particle orientation during coalescence which are driven by the surface energy of the substrate. Earlier studies conducted on stratification during coalescence also identified that the substrate surface energy plays a significant role on the alignment near the interfacial regions.32 | ||
| Fig. 6 TEM images of coalesced particles of P100/0-S2 (A), P50/50-S2 (B) and P0/100-S2 (C) particles showing a phase separation near the film-air (F-A) interface. | ||
| Copolymer→ | P100/0-S2 | P50/50-S2 | P0/100-S2 | ||||||
|---|---|---|---|---|---|---|---|---|---|
| Substrate↓ | θS° | θA° | θR° | θS° | θA° | θR° | θS° | θA° | θR° |
| a θS - static water contact angle [°] after coating with particles; θA - advancing water contact angle [°] after coating with particles, θR – receding water contact angle [°] after coating with particles. | |||||||||
| SiO2 | 90 | 94 | 90 | 95 | 101 | 88 | 97 | 98 | 91 |
| PTFE | 72 | 79 | 68 | 68 | 74 | 62 | 87 | 88 | 86 |
Conclusions
These studies show for the first time that the synthesis of two distinct phase-separated copolymers within one colloidal nanoparticle allows morphology control by compositional and interfacial adjustments. Spectroscopic and morphological analysis combined with the contact angle measurements revealed that in an effort to create stable heterogeneous two-phase particle morphologies it is essential to control the copolymer composition that influences glass transition temperature and subsequently interfacial surface tension. The relationship between the ΔT/Tg and the copolymer composition as well as the interfacial particle surface energy shows that in order to achieve desirable morphologies, energetically favorable conditions must be met. Coalescence of the dual phase nanoparticles can be controlled by the substrate surface tension. When two phase copolymer nanoparticles coalesce on a high surface tension substrate, the p-PFS phase expresses itself near the film–air interface, whereas for low surface energy substrates, the p-PFS phase dominates the film–substrate interfacial regions. For symmetrical core–shell particle morphologies, there is no influence of the substrate surface tension.Acknowledgements
This work was partially supported by the NSF MRSEC program DMR 0213883 as well as Major Research Instrumentation program DMR 0215873.References
- R. Langer and D. A. Tirrell, Nature, 2004, 428, 487 CrossRef CAS.
- Y. Zhao and M. W. Urban, Macromolecules, 2000, 33, 8426 CrossRef CAS.
- A. Misra and M. W. Urban, Macromol. Rapid. Comm., 2009, 119(2), 31.
- D. J. Lestage and M. W. Urban, Langmuir, 2005, 21(23), 10253 CrossRef CAS.
- D. J. Lestage and M. W. Urban, Langmuir, 2005, 21, 4266 CrossRef CAS.
- D. Fava, Z. Nie and M. A. Winnik, Adv. Mater., 2008, 20, 4318 CrossRef CAS.
- S. Dougherty and J. Liang, Nanotechnology, 2009, 20, 295301 CrossRef CAS.
- D. Dendukuri, T. A. Hatton and P. S. Oyle, Langmuir, 2007, 23, 4669 CrossRef CAS.
- A. Alexeev, J. M. Yeomans and A. C. Balazs, Langmuir, 2008, 24(21), 12102 CrossRef CAS.
- J. Chiefari, Y. K. Chong, F. Ercole, J. Krstina, J. Jeffery, T. P. T. Le, R. T. A. Mayadunne, G. F. Meijs, C. L. Moad, G. Moad, E. Rizzardo and S. H. Thang, Macromolecules, 1998, 31, 5559 CrossRef CAS.
- D. Greszta, D. Mardare and K. Matyjaszewski, Macromolecules, 1994, 27, 638 CrossRef CAS.
- M. K. Georges, R. P. N. Veregin, P. M. Kazmaier and G. K. Hamer, Macromolecules, 1993, 26, 2987 CrossRef CAS.
- J.-E. L. Joensson, H. Hassander, L. H. Jansson and B. Toernell, Macromolecules, 1991, 24, 126 CrossRef CAS.
- M. Okubo, J. Izumi and R. Takekoh, Colloid Polym. Sci., 1999, 277, 875 CrossRef CAS.
- Z. Lei and S. Bi, Mater. Lett., 2007, 61, 3531 CrossRef CAS.
- S. Badaire, C. Cottin-Bizonne, J. W. Woody, A. Yang and A. D. Stroock, J. Am. Chem. Soc., 2007, 129, 40 CrossRef CAS.
- C. J. Hernandez and T. G. Mason, J. Phys. Chem., 2007, 111, 4477 Search PubMed.
- N. Saito, Y. Kagari and M. Okubo, Langmuir, 2006, 22, 9397 CrossRef CAS.
- T. Tanka, R. Nakatsuru, Y. Kagari, N. Saito and M. Okubo, Langmuir, 2008, 24, 12267 CrossRef.
- T. Nisisako, T. Torii, T. Takahashi and Y. Yakizawa, Adv. Mater., 2006, 18, 1152 CrossRef CAS.
- F. Liu and M. W. Urban, Macromolecules, 2008, 41, 6531 CrossRef CAS.
- W. R. Dreher, W. L. Jarret and M. W. Urban., Macromolecules, 2005, 38, 2205 CrossRef CAS.
- S. D. Davis; J. Hadgraft; K. J. Palin. Enzyclopedia of Emulsion Technology. Marcel Dekker:New York, 1985Vol. 2 Search PubMed.
- P. C. Hiemenz. “Principle of colloidal and surface chemistry”, Dekker, New York 1997, 3rd Edn Search PubMed.
- F. M. Fowkes, M. B. Kazinsky and W. Dwight, Langmuir, 1991, 7, 2464 CrossRef CAS.
- D. K. Owens and R. C. Wendt, J. Appl. Polym. Sci., 1969, 13, 1741 CrossRef CAS.
- M. W. Urban., Attenuated Total Reflectance Spectroscopy of Polymers-Theory and Practice; American Chemical Society, 1996 Search PubMed.
- A. Singh, W. R. Dreher and M. W. Urban, Langmuir, 2006, 22, 524 CrossRef CAS.
- D. J. Lestage and M. W. Urban, Langmuir, 2004, 20, 6443 CrossRef CAS.
- J. Brandrup; E. H. Immergut. Polymer Handbook. 2nd ed. John Wiley &Sons; New York, 1966 Search PubMed.
- S. Wu, J. Polym. Sci., Part C, 1971, 34, 19 Search PubMed.
- K. W. Evanson, T. A. Thorstenson and M. W. Urban, J. Appl. Polym. Sci., 1991, 42, 2297 CrossRef CAS.
Footnote |
| † Electronic supplementary information (ESI) available: Further images and tables. See DOI: 10.1039/c0py00220h |
| This journal is © The Royal Society of Chemistry 2011 |

