Tailoring silver nanodots for intracellular staining
Sungmoon
Choi
a,
Junhua
Yu†
a,
Sandeep A.
Patel
a,
Yih-Ling
Tzeng
*b and
Robert M.
Dickson
*a
aSchool of Chemistry and Biochemistry and Parker H. Petit Institute for Bioengineering and Bioscience, Georgia Institute of Technology, 901 Atlantic Drive, Atlanta, GA 30332-0400, USA. E-mail: dickson@chemistry.gatech.edu
bDepartment of Medicine, Emory University School of Medicine, Atlanta, GA 30322, USA. E-mail: ytzeng@emory.edu
First published on 9th November 2010
Abstract
Through tailored oligonucleotide scaffolds, Ag nanocluster syntheses have yielded thermally and cell-culture medium stable silver cluster-based emitters. Optimizing ssDNA stability has enabled creation of highly concentrated and spectrally pure nanocluster emitters with strong intracellular emission. Both fixed and live-cell staining become possible, and intracellular delivery is demonstrated both through conjugation to cell-penetrating peptides and via microinjection.
Introduction
The outstanding one- and two-photon absorption cross sections and photostabilities of DNA-encapsulated, few-atom silver nanoclusters suggest both additional single molecule and cellular applications of these novel fluorophores.1–5 Though bare silver nanodots have been prepared within rare gas6,7 or zeolite matrices,8–10 their utility as fluorescent labels at ambient conditions has only become possible upon encapsulation in water-soluble molecular scaffolds. Although successfully encapsulated in dendrimers,11 microgels,12 and peptides,13 the single stranded DNA (ssDNA) scaffolds with varying sequences1–4,14–17 have, to date, produced the widest variety of and most robust nanodot emitters. Encapsulated within ss-DNA, few-atom Ag nanoclusters (“nanodots”) exhibit excellent brightness with typical fluorescence quantum yields of ∼30% and extinction coefficients exceeding 2 × 10⁵ M−1 cm−1.2 Combined with >10-fold photostability improvements over dyes such as Cy3, Cy5, and Texas Red;2 small overall size; and two-photon cross sections3 that can approach those of much larger quantum dots,18,19 these emitters fill a void between organics and much larger semiconductor-based fluorophores.1,13,18–20Silver nanodots are generally synthesized by reduction of a mixture of ligand and silver nitrate by sodium borohydride.1 The optimal nucleobase : silver ratio to yield maximized emission is usually found to be approximately two bases per silver.1,2,14,16,20–22 For a given sequence, however, variations in this ratio can bias fluorophore creation toward one of multiple emitters formed in a given sequence. Gwinn et al., for example, nicely illustrated this concept using DNA hairpins of varying length, but at constant Ag concentration, thereby yielding mixtures of multiple Ag nanodot emitters.4,16 Although recent successes at creating spectrally pure emitters have been achieved,2,23 most studies continue to result in low concentration mixtures of green and red emitters. Further, the extreme insolubility of Ag salts in biological media, coupled with poor spectral purity and low overall obtainable nanodot concentrations (i.e. sub-micromolar)4,16,21,22,24,25 has precluded more widespread use of these otherwise promising fluorophores. Herein, through facile optimization of creation conditions, we create and utilize a wide range of multicolor fluorophores with excellent chemical stability and spectral purity, at sufficiently high concentrations for use in complex biological environments. These emitters can be delivered into living cells either by microinjection or through conjugation to a cell penetrating peptide (CPP),26,27 thereby opening paths toward intracellular labeling.
Results and discussion
Tuning the base : Ag+ ratio away from the maximized 2![[thin space (1/6-em)]](https://www.rsc.org/images/entities/char_2009.gif) :121 that simultaneously produces multiple emitters in the C20 oligocytosine sequence enables selective preparation of essentially spectrally pure emitters within C20 scaffolds. Upon increasing the base : Ag+ ratio from 2 to more than 2.7, the previously reported, primarily red emission1,21,22 transforms within 48 h to yield a stable, spectrally pure green emitter (523 nm at λex 467 nm, Fig. 1A) with a fluorescence lifetime of 3.6 ns and quantum yield of 27%. This emitter has a different excitation spectrum and photophysical parameters from those of other Ag nanodots previously reported.21 Formation of this particular species is accelerated upon heating to 40 °C, yielding the pure green emitter within 6 h. This species has very good thermal stability, with a half life of more than two days when held at 60 °C. It also shows excellent stability in chloride-containing buffers (Table 1). Interestingly, changing the oligocytosine length to 12 or 24 bases when formed with a ratio of 2.7 bases : Ag+, or increasing the base : Ag+ ratio up to 3.5 also produces a similar spectrally pure green emitter (>150-fold brighter than any other species in solution). Although several-fold lower than for other nanodots with near IR exctiation,3 this Ag nanocluster exhibits a more than 100-fold larger two photon absorption cross section (4000 GM at 750 nm, (Goppert-Mayer units, 10−50 cm4photon s−1)) over that of fluorescein (37 GM),28 with excellent photostability, while retaining reasonably small size.2
:121 that simultaneously produces multiple emitters in the C20 oligocytosine sequence enables selective preparation of essentially spectrally pure emitters within C20 scaffolds. Upon increasing the base : Ag+ ratio from 2 to more than 2.7, the previously reported, primarily red emission1,21,22 transforms within 48 h to yield a stable, spectrally pure green emitter (523 nm at λex 467 nm, Fig. 1A) with a fluorescence lifetime of 3.6 ns and quantum yield of 27%. This emitter has a different excitation spectrum and photophysical parameters from those of other Ag nanodots previously reported.21 Formation of this particular species is accelerated upon heating to 40 °C, yielding the pure green emitter within 6 h. This species has very good thermal stability, with a half life of more than two days when held at 60 °C. It also shows excellent stability in chloride-containing buffers (Table 1). Interestingly, changing the oligocytosine length to 12 or 24 bases when formed with a ratio of 2.7 bases : Ag+, or increasing the base : Ag+ ratio up to 3.5 also produces a similar spectrally pure green emitter (>150-fold brighter than any other species in solution). Although several-fold lower than for other nanodots with near IR exctiation,3 this Ag nanocluster exhibits a more than 100-fold larger two photon absorption cross section (4000 GM at 750 nm, (Goppert-Mayer units, 10−50 cm4photon s−1)) over that of fluorescein (37 GM),28 with excellent photostability, while retaining reasonably small size.2
| DNA sequence | T m/°C | λExc/λEm/nm | Lifetime/ns | Φ (%) | Ε/105 M−1 cm−1 | Half life time in water at 20 °C (hours) | Half life time in PBS at 37 °C (hours) |
|---|---|---|---|---|---|---|---|
| C20 | n/a | 467/523 | 3.6 ± 0.1 | 27 ± 2 | 1.2 ± 0.3 | >80 | 20 |
| AATTC12 | 9 | 480/562 | 4.3 ± 0.1 | 38 ± 3 | 2.0 ± 0.4 | 6 | <1 |
| CGAAC12 | 32 | 543/590 | 2.0 ± 0.1 | 36 ± 3 | 3.5 ± 0.7 | 7 | <1 |
| CGCGC12 | 57 | 560/615 | 2.5 ± 0.1 | 42 ± 3 | 9.5 ± 1.9 | 19 | <1 |
| CGAACGCGC12 | 72 | 560/618 | 2.3 ± 0.1 | 16 ± 2 | 2.8 ± 0.6 | 40 | 6 |
| ATATC8 | 3 | 570/635 | 2.7 ± 0.1 | 26 ± 3 | 3.2 ± 0.7 | 5 | <1 |
| GGGGC8 | 64 | 600/670 | 3.5 ± 0.1 | 34 ± 3 | 2.5 ± 0.5 | >40 | <1 |
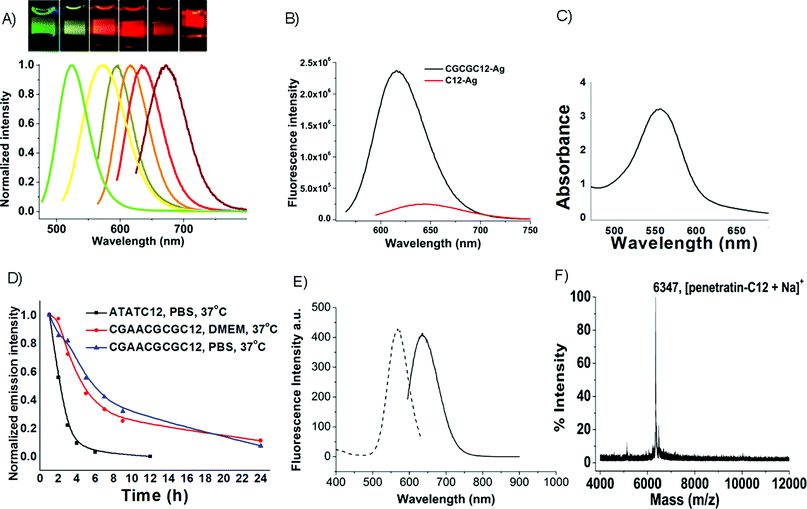 | ||
| Fig. 1 Emission and multicolor staining of various Ag nanodots. A, Normalized emission spectra of various emitters, from left to right: 523 nm (green C20), 562 nm (AATTC12), 590 nm (CGAAC12), 615 nm (CGCGC12), 635 nm (ATATC8), 670 nm (GGGGC8). (Inset) Different color Ag emitters in cuvettes, each excited near their excitation maximum. B, Emission intensity comparison of Ag nanodots between sequence with a hairpin structure (CGCGC12: 5′-CGCGCCCCCCCCCCCCCGCG-3′) and that with a simple polycytosine structure (C12: 5′-CCCCCCCCCCCC-3′), each at their highest intensities. C, Typical absorption spectrum of concentrated 615 nm emitter (1 cm light path). D, Thermal stability of CGAACGCGC12CGAACGCG-protected Ag nanodots compared to ATATC12-protected Ag nanodots. E, Excitation and emission spectra of aqueous penetratin-C12 silver clusters solution. Emission (solid) was excited at 575 nm, and excitation (dotted) was detected at 640 nm. F, MALDI mass spectrum of penetratin-C12 conjugate. | ||
Although a promising green emitter is obtained using C20, sequence modifications are even more crucial than base : Ag ratio for tuning Ag nanodot emission color and spectral purity. Fine-tuning of creation conditions, coupled with optimizing the DNA hairpin sequence and thermal stability yield significant improvements in nanodot properties that enable intracellular use. Building on others’ successful hairpin studies,4 adding four complementary bases at the 3′ end of oligocytosine to yield CGCGC12 (5′-CGCGCCCCCCCCCCCCCGCG-3′) forms a stem-loop structure in which direct nanodot synthesis produces a spectrally pure 615 nm emitter at a loop base : Ag+ ratio of 1.8, yielding a ΦF nearly twice that of C12 nanodots (42% vs. 23%), and improved overall emission intensity relative to that obtainable in C12 (5′-CCCCCCCCCCCC-3′) scaffolds (Fig. 1B). Further, in contrast to C12-encapsulated nanodots, the improved stability enables these emitters to be directly concentrated through either solvent evaporation or ethanol precipitation without destroying their stability or spectral purity. Such concentration was not possible with previous emitters that report the μM-encapsulating DNA concentration, but have very low nanodot yields.22 These improved methods yield solutions with optical densities well above 3 (Fig. 1C), indicating nanodot concentrations in excess of 10 μM. Analogous sequences with terminal hairpin structures, such as AATTC12, 5′-CGAACCCCCCCCCCCCTTCG-3′ (CGAAC12), ATATC8, and 5′-GGGGCCCCCCCCCCCC-3′ (GGGGC8), also produce various spectrally pure, concentratable Ag nanodot solutions with very bright, spectrally pure emission with a ratio versus other observed emission of more than 100 and much higher concentrations than reported with any other hairpin or non-hairpin equivalent (Table 1). Interestingly, mismatched stem pairs (e.g. 5′-CGGCC12CGCG-3′) fail to produce Ag nanodots at high concentrations (not shown), suggesting that the hairpin structure is beneficial to Ag nanodot formation,4 as also suggested with Ag-induced hairpin formation within polycytosine.29 Tuning the hairpin structure yields multiple spectrally pure emitters with emission wavelengths varying from the yellow to the red (Fig. 1A). Each of these emitters exhibits excellent photophysics (Table 1) with photostabilities and sustained emission rates improving on the best available organic fluorophores.30 As we report here, maintaining the oligocytosine loop, while increasing thermal stability of the stem and optimizing creation conditions has yielded buffer- and culture medium-stable emitters that maintain their strong emission for many hours at 37 °C (Fig. 1D). With sub-3-nm hydrodynamic radii (data not shown) dominated by the encapsulating DNA strands, all emitters are likely composed of fewer than ∼10 Ag atoms,31 although chemical analysis of these hairpins remains elusive. However, no nanoparticle formation is observed in any of these samples either with darkfield imaging or centrifugation at 23000 × g. Although concentration enables highly absorbing, spectrally pure (>100-fold higher than any other emitter) solutions to be obtained, chemical synthetic yields for these emitters only range from 1% to 5%, depending on the sequences. Clearly higher yield synthetic methods will further improve imaging applications.
Even without hairpin-based stabilization, the spectrally pure, green-emitting C20:Ag nanodots selectively stain the nuclei of fixed NIH3T3 cells (Fig. 2) and show excellent photostability under both one- and two-photon excitation. These cells were co-stained with HCS red cell stain (Invitrogen), which stains the cytoplasm, as shown in red. Under confocal scanning, both labels show excellent one-photon-excited stability, with less than 10% fluorescence intensity decay of either dye after 2 h of continuous imaging (Fig. 2A, C). However, under two-photon-excitation (TPE), the fluorescence intensity of HCS red decays to 60% after just 10 min of scanning, while Ag nanodots retain 90% fluorescence intensity after scanning for 1 h (Fig. 2B, D). The in vitro one- and two-photon excited nanodot emission spectra, excited at 458 nm (OPE) or at 720 nm (TPE), respectively, are indistinguishable (not shown).
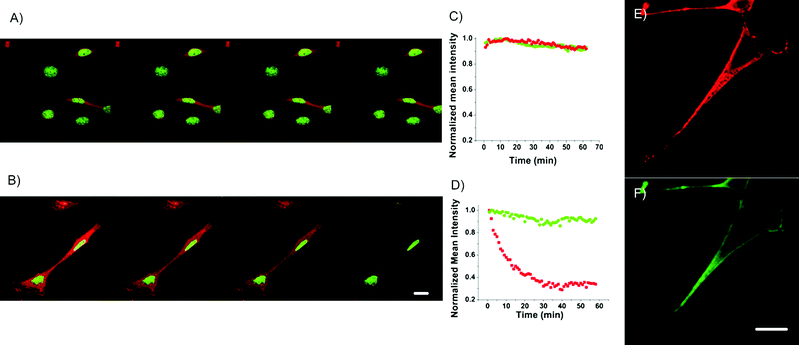 | ||
| Fig. 2 Confocal fluorescence imaging and photo-stability of C20 Ag nanodots (green) in NIH 3T3 cells co-labeled with HCS red cell stain (red) under one photon excitation (OPE, 458 nm, A) or two photon excitation (TPE, 720 nm, B). The photostability can be easily seen by the color decay of images in nuclei (green C20 Ag nanodots) and cytoplasm (HCS red cell stain), and illustrated in C (for OPE) and D (for TPE) by their mean fluorescence intensity of individual emitters in the corresponding scanning images. The green Ag nanodots show similar photostability to HCS red cell stain under OPE, but much greater stability under TPE. E and F, Red and green channels from fixed NIH 3T3 cells co-stained with anti-OxoPhos/ATATC8 Ag nanodots (red) and anti-Heparin Sulfate/AATTC12 Ag nanodots (green). Scale bar, 30 μm. | ||
Upon conjugation to an antibody, Ag nanodots do not significantly impair specificity. AATTC12 was conjugated to anti-HS to mark the cell membrane, and red emitting ATATC8 was conjugated to anti-OP to mark the mitochondria. Methods analogous to those previously reported were followed. Upon conjugation and nanocluster formation in AATTC12, emission is blue-shifted by 40 nm to 522 nm, but the conjugated ATATC8 Ag nanodot emission is unchanged. As shown in Fig. 2E & F, methanol-fixed NIH3T3 cells treated with anti-OP/ATATC8 Ag nanodots (5 μM, concentration of DNA ligand) and anti-HS/AATTC12 Ag nanodots (5 μM, concentration based on DNA ligand) stained mitochondria (red) and the cell membrane (green), respectively. The strong staining of nuclei observed with unconjugated green nanodots was circumvented with antibody conjugation.
Ag salts are notoriously insoluble, but all of these Ag nanodot emitters are highly buffer stable. Prepared directly in PBS, the green C20 nanodots show excellent chemical stability in both PBS and in DMEM cell growth medium under ambient conditions. This C20-encapsulated green emitter is actually preferentially stabilized in PBS. The combination of thermal and buffer stability suggest that the DNA performs a significant protecting role in this nanodot emitter, as other C20-encapsulated emitters are destabilized under these buffer conditions, leading to spectral shifts and eventual cluster decay.22 The balance between improved DNA stabilization at high ionic strength,32–34 and the insolubility of most Ag salts preferentially forms this green emitter in a variety of buffers composed from sodium bicarbonate, sodium acetate, or sodium perchlorate. The stability decreases somewhat with increased temperature, retaining half of its emission in DMEM after 4 h at 60 °C. We should note that shorter oligocytosine-protected Ag nanodots (e.g.C12) possess similar thermal and chemical stability only in the absence of high concentration of chloride.
Live cell imaging with Ag nanodots also poses significant challenges. The excellent chemical stability offered by hairpin-encapsulated Ag nanodots, however, enables direct preparation in DMEM and significantly improved stability in cell culture without apparent silver salt precipitates during nanodot formation. For these syntheses, AgNO3 is directly added to DMEM solutions containing the hairpin of interest, followed by chemical reduction. Using ATATC12, direct nanocluster preparation in DMEM produces emitters with greatly improved stability compared to those prepared with the same sequence in regular phosphate buffer at 4 °C. It is likely that those with stable DNA-Ag+ complexes are chemically pre-selected during the incubation of DNA-Ag+ prior to chemical reduction, yielding stable emission. However, those unstable DNA-Ag+ complexes could not form silver nanodots. To further improve the nanodot thermal stability in high salt conditions, we increased the stem length in the hairpin structure for nanodot preparation directly in DMEM. Employing 5′-CGAACGCGC12CGCGTTCG-3′ (hairpin melting temperature (Tm) of 72 °C),35 bright 618 nm emission with excellent stability in PBS as well as DMEM at 37 °C is observed with a half life of 5 h. This is more than two-fold improved over the ATATC12 encapsulated silver nanodots (Fig. 1D).
Since the high charge density of DNA limits intracellular availability, and endosomal escape when using transfection reagents is often a problem,36,37 both microinjection and cell penetrating peptide (CPP) conjugation were utilized for cytosolic delivery. Although highly cargo dependent in subcellular localization, CPPs have been demonstrated to effectively import small cargoes ranging from fluorophores to oligos and small proteins.38,39 Large cargo such as quantum dots, however, are unable to reach the cytosol upon CPP conjugation.40 As a proof-of-concept, we conjugated a commonly employed CPP, penetratin,41 to oligocytosine ssDNA scaffolds for nanodot delivery. Penetratin is derived from the third helix of the Antennapedia homeodomain and has been widely investigated for cargo delivery due to its low cytotoxicity and high delivery efficiency.38,39,42,43 Three glycines and one cysteine were added to the C-terminus of the penetratin peptide to yield RQIKIWFQNRRMKWKKGGGC, in which the thiol group can be tethered to amino-group-functionalized oligocytosines (Integrated DNA Technologies, Coralville, IA, USA) through the heterobifunctional cross-linker sulfo-SMCC to yield conjugate penetratin-C12. The oppositely-charged penetratin and ssDNA tend to form aggregates due to electrostatic interaction, mandating use of high NaCl concentration (1 M) and high temperature (60 °C) during synthesis. The resulting conjugate and emissive nanodots also require high ionic strength for solubility (1 M sodium acetate). Only short (and therefore less anionic) strands yielded good conjugation efficiencies, dictating conjugation with C12 for nanodot formation. Red-emitting Ag nanodots were formed within this penetratin-C12 conjugate by mixing with silver nitrate in aqueous sodium acetate solution, followed by borohydride reduction at a base : silver ratio of 2:1. The resulting penetratin-C12Ag nanodots possess the essential photophysical properties of ssDNA-encapsulated Ag nanodots, i.e., 640 nm emission at 575 nm excitation (Fig. 1E),21 indicating that the electrostatic interaction between penetratin and ssDNA does not interfere with the formation and photophysics of the Ag nanodots. Cargo delivery was examined using NIH 3T3 cells and bovine pulmonary artery endothelial cells (BPAEC). Penetratin-C12Ag nanodots (10 μM) initially bind with and eventually cross the cell membrane, with silver nanodots being readily detected in nuclei within 10 min either in NIH 3T3 or BPAEC cells (Fig. 3A and D, respectively), with some expected residual membrane staining.44 The DNA-encapsulated Ag nanodots alone showed no staining of cells (data not shown), indicating penetratin-dependent cellular uptake. The internalization of penetratin-C12 Ag nanodots ceases at 4 °C, which is in line with reports that endocytosis may be involved in CPP translocation.39 Further, the penetratin-C12 Ag nanodots entered cells with intact cell membranes, as demonstrated by co-incubation of penetratin-C12 Ag nanodots with the cell membrane-impermeable dye Sytox Green (Invitrogen) which only stains nuclei of cells with compromised membranes (Fig. 3B, C). In all the Ag nanodot-stained cells, less than 15% of cells showed poor cell membrane integrity. Though the challenge of charge compensation limits solubility and size of penetratin-DNA conjugates, this demonstrates that intracellular imaging studies with ssDNA encapsulated Ag nanodot fluorophores indeed hold promise.
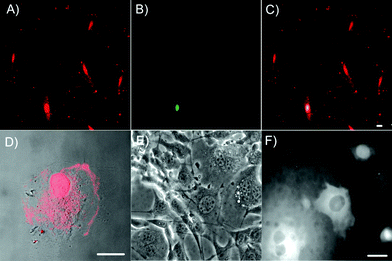 | ||
| Fig. 3 Intracellular delivery of DNA-encapsulated Ag nanodots. A–D, Penetratin-enhanced Ag nanodot internalization. A to C, Colocalization of NIH 3T3 cells co-incubated with penetratin-C12 Ag nanodots and Sytox Green nuclear staining dye which only stains nuclei of cells with compromised membranes. The merge (C) of red emission (A) from penetratin-C12 Ag nanodots and green emission (B) from Sytox Green indicates that only a few cells show poor membrane integrity. Panels A–C are at the same scale. Penetratin-C12Ag nanodots were excited at 543 nm and Sytox Green at 488 nm. D, Merge of a bright field image and a fluorescent image of BPAECs incubated with penetratin-C12 Ag nanodots for 10 min. E and F, 615 nm emitter was micro-injected into NIH 3T3 cells, shown in phase contrast (E) and fluorescence after microinjection (F). All scale bars are 25 μm. | ||
Conversely, direct microinjection circumvents difficulties in membrane transport and the problem of endosomal escape. Microinjection (Eppendorf FemtoJet) of concentrated 615 nm (CGCGC12) emitting nanodots into live NIH 3T3 cells, for example, demonstrates the ability of these Ag nanodots to show bright red fluorescence in the cytosol, and indicates promise for more generalized cellular staining using these or similar nanodot probes (Fig. 3E and F), when stability is also further improved. Although eventually higher fluorescence intensity is observed in the nucleus even with microinjected Ag nanodots after 10 min, the distribution of fluorescence is initially almost exclusively cytosolic. This distribution appears uninfluenced by the Ag cluster, as fluorescein-tagged ssDNA of the same sequence exhibits a similar distribution inside living cells.
Experimental
(I) Chemicals
Silver nitrate (99.9999%), phosphate buffered saline (PBS), ethylenediaminetetraacetic acid (EDTA), trypsin, Dulbecco's Modified Eagle's Medium (DMEM), sodium borohydride, sulfo-SMCC (4-(N-maleimidomethyl)cyclohexane-1-carboxylic acid 3-sulfo-N-hydroxysuccinimide ester sodium salt), tris(2-carboxyethyl)phosphine, penicillin-streptomycin solution, and Sephadex G50 were purchased from Sigma-Aldrich and used as received. 3,000 MWCO centrifugal ultrafiltration vials were obtained from Vivascience, Stonehouse, UK. ssDNAs were synthesized by Integrated DNA Technologies. Anti-heparin/heparan sulfate mouse IgG1 (anti-HS) was obtained from Millipore, MA, USA, and anti-OxPhos complex IV subunit Va mouse IgG2a (anti-OP) from Invitrogen, CA, USA.(II) Cell culture
NIH 3T3 cells were incubated under 5% carbon dioxide/air at 37 °C, in DMEM with 4.5 g L−1glucose, L-glutamine and pyruvate, supplemented with 10% newborn bovine serum and 1% penicillin per 100 units streptomycin mixture. Bovine pulmonary artery endothelial cells (BPAEC) were cultured in M199 medium with Earle's salts, supplemented with 20% fetal bovine serum and 1% penicillin/streptomycin, fungizone (2.5 μg ml−1) and endothelial cell growth supplement (17 μg mL−1).(III) Fluorescence and MALDI spectra
Fluorescence spectra were taken on a Photon Technology International spectrofluorometer (QM-4SE). MALDI mass spectra were run on the Applied Biosystems 4700 Proteomics Analyzer.(IV) Two-photon cross sections
The absorption cross section was determined by recording the emission as a function of excitation wavelength by a pulsed Ti-sapphire laser (200 fs pulse width, 8 kHz repetition rate). The cross sections were measured by ratiometric comparison to dye standards with known cross sections at the excitation wavelengths used, analogous to our previously reported methods.3(V) Cellular staining
NIH 3T3 cells were washed with PBS and then fixed with pre-cooled MeOH/acetone (−20 °C) for 10 min, rinsed with deionized water, and then loaded with anti-mitochondria (anti-OP) ATATC8 (5′-ATATCCCCCCCCATAT-3′) silver nanodots (5 μM) in 300 μL of DI water for 1 h at r.t. The cells were then washed and incubated with anti-HS AATTC12 (5′-ATATCCCCCCCCCCCCATAT-3′) silver nanodots (5 μM) in 300 μL of DI water for 1.2 h. Cells were washed with deionized water and then mounted on a slide for imaging.(VI) Live cells
Live cells were loaded with penetratin-C12 silver nanodots in modified phosphate buffer (110 mM sodium phosphate, 2.7 mM potassium phosphate, and 5 mM MgCl2, pH 7.45) for 10 min in an incubator, washed with modified phosphate buffer, and mounted on a slide for imaging.(VII) Molar extinction coefficients
Molar extinction coefficients were determined by fluorescence correlation spectroscopy with appropriate color laser excitation on nanodot solutions of known dilution from those with measurable nanodot-specific absorbance. The number of molecules in the laser focal volume was obtained from the y-intercept of the correlation function,45,46 and the focal volume determined by measuring known concentrations of standard organic dyes. Together, accounting for dilution, these values directly yield the nanodot molar extinction coefficient.47(VIII) Synthesis of penetratin-C12
C12 functionalized with an amino group (5′-AmMC12-CCCCCCCCCCCC-3′, 6 mg, IDT DNA) was stirred with sulfo-SMCC (8 mg, Aldrich) in sodium borate buffer (0.1 M, pH 8.5) at r.t. for 3 h. The resulting maleimide-modified C12 was purified over a Sephadex G-50 column with degassed PBS as the eluant. The collected DNA was then mixed in 1 M NaCl with penetratin that has reacted with 5 mM tris(2-carboxyethyl)phosphine (2 mL) for 3 h and purified over a Sephadex G-50 column. After 4 h at 60 °C, the product was purified over a SP Sephadex column (SPC50-120, Aldrich) with borate buffer (10 mM phostate, 150 mM NaCl, 200 mM sodium borate, pH 7.8) as the eluant, with a final product yield of 35% based on DNA absorption. MS (MALDI): m/z 6324 calculated for C239H355N76O100P12S2, found 6327 ([M + Na]+).(IX) Synthesis of silver nanodots
For green emitting silver nanodot preparation, ssDNA and silver nitrate were mixed at a base/Ag+ ratio of 2.7, followed by aqueous sodium borohydride solution (1 mg mL−1) reduction at a NaBH4/Ag+ molar ratio of 1 under vigorous stirring. The emission shifts to green within 48 h. For hairpin DNA-protected silver nanodots, ssDNA and silver nitrate were mixed at a loop base/Ag+ ratio of 1.8, and reduced by sodium borohydride reduction at a NaBH4/Ag+ ratio of 1. All other non-hairpin DNA-protected silver nanodots were synthesized by mixing silver nitrate and ssDNA at a base/Ag+ ratio of 2, followed by aqueous sodium borohydride solution reduction at a NaBH4/Ag+ ratio of 1.Conclusions
These improvements in chemical, biological, and thermal stabilities, coupled with spectral purity and high concentrations obtained in ssDNA hairpin-encapsulated nanoclusters have retained the outstanding Ag nanodot optical properties, but now offer promise for more demanding intracellular applications. Cellular delivery demonstrates strong nanodot fluorescence in the live cells, with further opportunities for improvement and utilization for studying protein dynamics with fluorescence labeling.Acknowledgements
R. M. D. gratefully acknowledges financial support from NIH R01-GM086195, Y.-L. T. acknowledges support from NIH R01-AI061031. BPAE cells were a gift from Prof. J. Karlsson (Drexel University), and NIH 3T3 cells were a gift from Prof. D. Doyle (Georgia Institute of Technology).Notes and references
- J. T. Petty, J. Zheng, N. V. Hud and R. M. Dickson, DNA-templated Ag nanocluster formation, J. Am. Chem. Soc., 2004, 126, 5207–5212 CrossRef CAS.
- C. I. Richards, S. Choi, J. C. Hsiang, Y. Antoku, T. Vosch, A. Bongiorno, Y. L. Tzeng and R. M. Dickson, Oligonucleotide-stabilized Ag nanocluster fluorophores, J. Am. Chem. Soc., 2008, 130, 5038–5039 CrossRef CAS.
- S. A. Patel, C. I. Richards, J. C. Hsiang and R. M. Dickson, Water-soluble Ag nanoclusters exhibit strong two-photon-induced fluorescence, J. Am. Chem. Soc., 2008, 130, 11602–11603 CrossRef CAS.
- P. R. O'Neill, L. R. Velazquez, D. G. Dunn, E. G. Gwinn and D. K. Fygenson, Hairpins with Poly-C Loops Stabilize Four Types of Fluorescent Ag-n:DNA, J. Phys. Chem. C, 2009, 113, 4229–4233 CrossRef CAS.
- H. X. Xu and K. S. Suslick, Water-Soluble Fluorescent Silver Nanoclusters, Adv. Mater., 2010, 22, 1078–1082 CrossRef CAS.
- C. Felix, C. Sieber, W. Harbich, J. Buttet, I. Rabin, W. Schulze and G. Ertl, Ag-8 fluorescence in argon, Phys. Rev. Lett., 2001, 86, 2992–2995 CrossRef CAS.
- T. L. Haslett, K. A. Bosnick and M. Moskovits, Ag-5 is a planar trapezoidal molecule, J. Chem. Phys., 1998, 108, 3453–3457 CrossRef CAS.
- T. Sun and K. Seff, Silver clusters and chemistry in zeolites, Chem. Rev., 1994, 94, 857–870 CrossRef CAS.
- G. De Cremer, Y. Antoku, M. B. J. Roeffaers, M. Sliwa, J. Van Noyen, S. Smout, J. Hofkens, D. E. De Vos, B. F. Sels and T. Vosch, Photoactivation of silver-exchanged zeolite A, Angew. Chem., Int. Ed., 2008, 47, 2813–2816 CrossRef CAS.
- W. Harbich, S. Fedrigo, F. Meyer, D. M. Lindsay, J. Lignieres, J. C. Rivoal and D. Kreisle, Deposition of mass selected silver clusters in rare gas matrices, J. Chem. Phys., 1990, 93, 8535–8543 CrossRef CAS.
- J. Zheng and R. M. Dickson, Individual water-soluble dendrimer-encapsulated silver nanodot fluorescence, J. Am. Chem. Soc., 2002, 124, 13982–13983 CrossRef CAS.
- J. G. Zhang, S. Q. Xu and E. Kumacheva, Photogeneration of fluorescent silver nanoclusters in polymer microgels, Adv. Mater., 2005, 17, 2336–2340 CrossRef CAS.
- J. Yu, S. A. Patel and R. M. Dickson, In vitro and intracellular production of peptide-encapsulated fluorescent silver nanoclusters, Angew. Chem., Int. Ed., 2007, 46, 2028–2030 CrossRef CAS.
- W. W. Guo, J. P. Yuan, Q. Z. Dong and E. K. Wang, Highly Sequence-Dependent Formation of Fluorescent Silver Nanoclusters in Hybridized DNA Duplexes for Single Nucleotide Mutation Identification, J. Am. Chem. Soc., 2010, 132, 932–934 CrossRef CAS.
- L. Shang and S. J. Dong, Facile preparation of water-soluble fluorescent silver nanoclusters using a polyelectrolyte template, Chem. Commun., 2008, 1088–1090 RSC.
- E. G. Gwinn, P. O'Neill, A. J. Guerrero, D. Bouwmeester and D. K. Fygenson, Sequence-dependent fluorescence of DNA-hosted silver nanoclusters, Adv. Mater., 2008, 20, 279–283 CrossRef CAS.
- K. Koszinowski and K. Ballweg, A Highly Charged Ag-6(4+) Core in a DNA-Encapsulated Silver Nanocluster, Chem.–Eur. J., 2010, 16, 3285–3290 CrossRef CAS.
- D. R. Larson, W. R. Zipfel, R. M. Williams, S. W. Clark, M. P. Bruchez, F. W. Wise and W. W. Webb, Water-soluble quantum dots for multiphoton fluorescence imaging in vivo, Science, 2003, 300, 1434–1436 CrossRef CAS.
- A. R. Clapp, T. Pons, I. L. Medintz, J. B. Delehanty, J. S. Melinger, T. Tiefenbrunn, P. E. Dawson, B. R. Fisher, B. O'Rourke and H. Mattoussi, Two-photon excitation of quantum-dot-based fluorescence resonance energy transfer and its applications, Adv. Mater., 2007, 19, 1921–1926 CrossRef CAS.
- J. H. Yu, S. Choi and R. M. Dickson, Shuttle-Based Fluorogenic Silver-Cluster Biolabels, Angew. Chem., Int. Ed., 2009, 48, 318–320 CrossRef CAS.
- C. M. Ritchie, K. R. Johnsen, J. R. Kiser, Y. Antoku, R. M. Dickson and J. T. Petty, Ag nanocluster formation using a cytosine oligonucleotide template, J. Phys. Chem. C, 2007, 111, 175–181 CrossRef CAS.
- Y. Antoku, Fuorescent Polycytosine-Encapsulated Silver Nanoclusters, Ph.D. thesis. Georgia Institute of Technology, 2007 Search PubMed.
- S. A. Patel, M. Cozzuol, J. M. Hales, C. I. Richards, M. Sartin, J. C. Hsiang, T. Vosch, J. W. Perry and R. M. Dickson, Electron Transfer-Induced Blinking in Ag Nanodot Fluorescence, J. Phys. Chem. C, 2009, 113, 20264–20270 CrossRef CAS.
- J. Sharma, H. C. Yeh, H. Yoo, J. H. Werner and J. S. Martinez, A complementary palette of fluorescent silver nanoclusters, Chem. Commun., 2010, 46, 3280–3282 RSC.
- J. H. Yu, S. M. Choi, C. I. Richards, Y. Antoku and R. M. Dickson, Live Cell Surface Labeling with Fluorescent Ag Nanocluster Conjugates, Photochem. Photobiol., 2008, 84, 1435–1439 CrossRef CAS.
- D. Terrone, S. L. W. Sang, L. Roudaia and J. R. Silvius, Penetratin and related cell-penetrating cationic peptides can translocate across lipid bilayers in the presence of a transbilayer potential, Biochemistry, 2003, 42, 13787–13799 CrossRef CAS.
- J. J. Turner, G. D. Ivanova, B. Verbeure, D. Williams, A. A. Arzumanov, S. Abes, B. Lebleu and M. J. Gait, Cell-penetrating peptide conjugates of peptide nucleic acids (PNA) as inhibitors of HIV-1 Tat-dependent trans-activation in cells, Nucleic Acids Res., 2005, 33, 6837–6849 CrossRef CAS.
- M. A. Albota, C. Xu and W. W. Webb, Two-photon fluorescence excitation cross sections of biomolecular probes from 690 to 960 nm, Appl. Opt., 1998, 37, 7352–7356 CrossRef CAS.
- R. Freeman, T. Finder and I. Willner, Multiplexed Analysis of Hg2+ and Ag+ Ions by Nucleic Acid Functionalized CdSe/ZnS Quantum Dots and Their Use for Logic Gate Operations, Angew. Chem., Int. Ed., 2009, 48, 7818–7821 CrossRef CAS.
- T. Schmidt, U. Kubitscheck, D. Rohler and U. Nienhaus, Photostability data for fluorescent dyes: An update, Single Mol., 2002, 3, 327 CrossRef CAS.
- J. T. Petty, C. Fan, S. P. Story, B. Sengupta, A. St. John Iyer, Z. Prudowsky and R. M. Dickson, DNA Encapsulation of 10 Silver Atoms Producing a Bright, Modulatable, Near-Infrared-Emitting Cluster, J. Phys. Chem. Lett., 2010, 2524–2529 Search PubMed.
- V. A. Sorokin, G. O. Gladchenko, V. A. Valeev, I. V. Sysa, L. G. Petrova and Y. P. Blagoi, Effect of salt and organic solvents on DNA thermal stability and structure, J. Mol. Struct., 1997, 408–409, 237–240 CrossRef CAS.
- J. Szopa, Effect of temporarily increased ionic-strength and of urea on stability of DNA complexes with native and acetylated BPTI, Arch. Immun. Ther. Exper., 1979, 27, 131–140 Search PubMed.
- C. Schildkr and S. Lifson, Dependence of melting temperature of DNA on salt concentration, Biopolymers, 1965, 3, 195–208 CAS.
- Transition temperature was calculated based on Integrated DNA Technologies web source, available at: http://www.idtdna.com/analyzer/Applications/OligoAnalyzer/, accessed on 10 August 2010.
- S. Majumdar, S. Duvvuri and A. K. Mitra, Membrane transporter/receptor-targeted prodrug design: strategies for human and veterinary drug development, Adv. Drug Delivery Rev., 2004, 56, 1437–1452 CrossRef CAS.
- Y. Antoku, J. Hotta, H. Mizuno, R. M. Dickson, J. Hofkens and T. Vosch, Transfection of living HeLa cells with fluorescent poly-cytosine encapsulated Ag nanoclusters, Photochem. Photobiol. Sci., 2010, 9, 716–721 RSC.
- J. P. Gratton, J. Yu, J. W. Griffith, R. W. Babbitt, R. S. Scotland, R. Hickey, F. J. Giordano and W. C. Sessa, Cell-permeable peptides improve cellular uptake and therapeutic gene delivery of replication-deficient viruses in cells and in vivo, Nat. Med., 2003, 9, 357–362 CrossRef CAS.
- P. E. G. Thoren, D. Persson, P. Isakson, M. Goksor, A. Onfelt and B. Norden, Uptake of analogs of penetratin, Tat(48–60) and oligoarginine in live cells, Biochem. Biophys. Res. Commun., 2003, 307, 100–107 CrossRef CAS.
- A. E. Jablonski, T. Kawakami, A. Y. Ting and C. K. Payne, Pyrenebutyrate Leads to Cellular Binding, Not Intracellular Delivery, of Polyarginine Quantum Dots, J. Phys. Chem. Lett., 2010, 1, 1312–1315 Search PubMed.
- D. Derossi, A. H. Joliot, G. Chassaing and A. Prochiantz, The 3rd Helix of the Antennapedia Homeodomain Translocates through Biological-Membranes, J. Biol. Chem., 1994, 269, 10444–10450 CAS.
- R. Fischer, M. Fotin-Mleczek, H. Hufnagel and R. Brock, Break on through to the other side - Biophysics and cell biology shed light on cell-penetrating peptides, ChemBioChem, 2005, 6, 2126–2142 CrossRef CAS.
- S. Tripathi, B. Chaubey, S. Ganguly, D. Harris, R. A. Casale and V. N. Pandey, Anti-HIV-1 activity of anti-TAR polyamide nucleic acid coniugated with various membrane transducing peptides, Nucleic Acids Res., 2005, 33, 4345–4356 CrossRef CAS.
- A. Ziegler, P. Nervi, M. Durrenberger and J. Seelig, The cationic cell-penetrating peptide Cpp(TAT) derived from the HIV-1 protein TAT is rapidly transported into living fibroblasts: Optical, biophysical, and metabolic evidence, Biochemistry, 2005, 44, 138–148 CrossRef CAS.
- E. L. Elson and D. Magde, Fluorescence correlation spectroscopy.1. conceptual basis and theory, Biopolymers, 1974, 13, 1–27 CrossRef CAS.
- D. Magde, E. L. Elson and W. W. Webb, Fluorescence correlation spectroscopy. 2. Experimental realization, Biopolymers, 1974, 13, 29–61 CrossRef CAS.
- E. Haustein and P. Schwille, Fluorescence correlation spectroscopy: Novel variations of an established technique, Annu. Rev. Biophys. Biomol. Struct., 2007, 36, 151–169 CrossRef CAS.
Footnote |
| † Current address: Department of Chemistry & Education, Seoul National University, Seoul 151-742, South Korea. |
| This journal is © The Royal Society of Chemistry and Owner Societies 2011 |