Racemisation dynamics of torsion angle restricted biphenyl push-pull cyclophanes
Jürgen
Rotzler
a,
Heiko
Gsellinger
a,
Markus
Neuburger
a,
David
Vonlanthen
a,
Daniel
Häussinger
*a and
Marcel
Mayor
*ab
aDepartment of Chemistry, University of Basel, St. Johannsring 19, 4056 Basel, Switzerland. E-mail: marcel.mayor@unibas.ch; Fax: +41-61-267-1016; Tel: +41-61-267-1006
bInstitute of Nanotechnology, Karlsruhe Institute of Technology, P. O. Box 3640, 76021 Karlsruhe, Germany
First published on 18th November 2010
Abstract
The thermodynamics of the atropisomerisation of torsion angle restricted, axial chiral biphenyl-based push-pull cyclophanes were studied. Using 1H NMR coalescence measurements the rotation barrier around the central C–C bond was determined to be 50 kJ mol−1 for the propyl-bridged biphenyl derivative 1b, displaying only a negligible solvent dependence. By protonation of the piperidinyl nitrogen as electron donor, the free energy ΔG‡(T) of the rotation barrier increased, indicating that the tendency of the push-pull system to planarise may be considered as a driving force for the atropisomerisation. For the more restricted butyl-bridged cyclophane 1c a rotation barrier of ΔG‡(T) = 90 kJ mol−1 was measured using dynamic chromatography. The difference in the free energy of rotation around the central C–C bond probably reflects the crowdedness of the transition states.
Introduction
The interaction of matter with light and especially the possibility to manipulate light by the design of matter is one of the most exciting topics in science. Among such structurally engineered matter are second-order non-linear optic (NLO) materials, which have the ability to double the frequency of incoming laser light.1,2 Such NLO active materials have attracted considerable attention because of their potential applications in telecommunication techniques, namely high-bandwidth optical switching and processing devices, as well as in dynamic image processing or in the development of new laser tools.3–5 Nevertheless this growing field of active research is still in its infancy. In the last decades a variety of different organic NLO materials were investigated following a donor–chromophore–acceptor structural motif.6–10 Despite the fact that great progress in understanding the influence of different structural parts of such push-pull systems on the non-linear optical activity has been made and molecules with large hyperpolarizabilities have been published,11–13 the transformation of these microscopic scale NLO active molecules to the macroscopic level still causes serious problems for their application.14 Two main physical properties are crucial for a strong non-linear optic response, which are a large hyperpolarizability of the chromophore and a noncentrosymmetric centre. This molecular noncentrosymmetry, which can be obtained by rational design of non-linear optic active compounds, can be transferred to the macroscopic scale by an external physical input. Examples include the application of an electric field to cause a noncentrosymmetric arrangement of dissolved dipoles15,16 (EFISH: electric-field-induced second-harmonic generation measurements) or the incorporation of the push-pull systems into noncentrosymmetric structures such as poled polymer films, self-assembled films17 or crystals.18–20 It is also known that crystal packing or supramolecular assembly of such materials can enhance the physical output dramatically.21,22Recently, studies about torsion angle restricted biphenyl-based push-pull systems were published where the influence of the chromophore’s delocalization on the hyperpolarizability was investigated by EFISH measurements.23 The investigated 2 and 2′ position alkyl-bridged biphenyl-based cyclophanes 1a–1d are axial chiral and therefore consist of a racemic mixture of two atropisomers (Fig. 1). In crystallography, it is well known that optically pure enantiomers tend to crystallise in noncentrosymmetric point groups, whereas racemic mixtures especially of donor-π-acceptor molecules crystallise in a centrosymmetric fashion since their dipoles force such an arrangement (Fig. 2). Therefore the described push-pull systems 1a–1d are potential candidates to realise such a transformation of the noncentrosymmetry from a molecular level to the macroscopic scale by enantiomeric resolution and subsequent crystal growth.
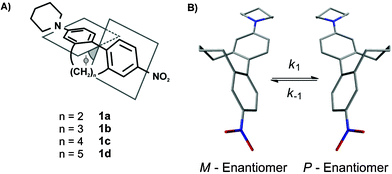 | ||
| Fig. 1 (A) Sketch of the concept to restrict the interphenyl torsion angle by an additional interlinking alkyl chain of various lengths; (B) The two atropisomers of 1c (structures calculated with a MM2 basic set) and the rotation around the central C–C bond showing the atropisomerisation process. | ||
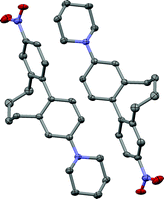 | ||
| Fig. 2 Centrosymmetric pairwise arrangement of the P (right) and M (left) atropisomers of the push-pull derivative 1c in the solid state. | ||
To gain further insight into the conformational stability of the non-linear active cyclophanes 1a–1d and to check if it is possible to separate the two atropisomers, the rotation barrier around the central C–C bond moved into the focus of interest.
For such thermodynamic studies mainly three different experimental methods are applicable. Coalescence measurements by 1H NMR,24 dynamic chromatography25–29 and monitoring the change in the optical rotation of a chiral non-racemic mixture. For the latter, separated enantiomers are required, whereas the first two methods can easily be performed using racemic mixtures of the molecules under investigation. Fast dynamic molecular processes can be investigated by NMR spectroscopy, whereas dynamic chromatography is more suitable for isomerisation studies of more conformationally stable compounds. Herein, the enantiomerisation dynamics of torsion angle restricted biphenyl push-pull cyclophanes 1a–1d are reported to obtain further insight into their dynamic behaviour and the interaction of the two phenyls under these conditions.
Materials and methods
General
The syntheses of the herein investigated in 2 and 2′ position bridged 4-nitro-4′-piperidinyl-biphenyls 1a–1d were previously reported.23 In short, molecules 1a–1d were assembled by applying a general synthetic pathway starting from their corresponding dibromo- or ditriflate derivatives 2a–2d (Scheme 1).30 These torsion angle restricted biphenyl building blocks were converted into their diamino-biphenyl derivatives 3a–3d by a Hartwig–Buchwald hetero-cross-coupling reaction using benzophenone imine as an ammonia synthon and subsequent hydrolysis. Selective microwave-assisted azacycloalkylation with 1,5-dibromopentane, followed by mild microencapsulated oxidation of the remaining free amine to a nitro functionality provided the desired push-pull systems 1a–1d.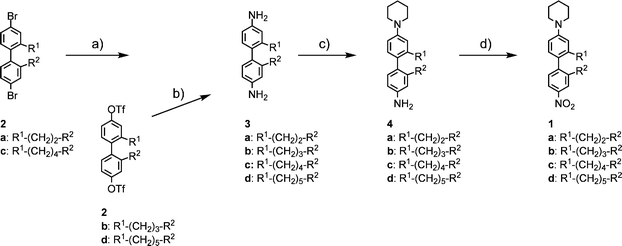 | ||
| Scheme 1 (a) Benzophenone imine, Pd2(dba)3·CHCl3, BINAP, NaOtBu, toluene, 80 °C, 4 h, then 3% aq. HCl, THF, rt, 2 h, 80%–quant.; (b) benzophenone imine, Pd(OAc)2, BINAP, Cs2CO3, THF, 65 °C, 17 h, then 3% aq. HCl, THF, rt, 2 h, 80%–quant.; c) 1,5-dibromopentane, K2CO3, toluene–EtOH: 1/1, MW, 150 °C, 40 min, 34–44%; (d) NaBO3·4H2O, H3PW12O40, CTAB (hexadecyltrimethylammonium bromide) (10 cmc in water), 55–60 °C, 16 h, 45–64%. | ||
Solid state structure
Single crystals of cyclophane 1c suitable for X-ray analysis were obtained upon slow evaporation of a solution of 1c in a mixture of iPrOH and hexane. The racemic mixture of 1c crystallised in the monoclinic, centrosymmetric space groupC2/c. One unit cell consists of 8 molecules with alternating M and P enantiomers of 1c (Fig. 2).† In Fig. 3 an ORTEP presentation of the P enantiomer of 1c is displayed.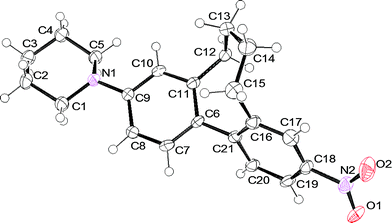 | ||
| Fig. 3 Solid state structure of the P enantiomer of 1c. Thermal ellipsoids are set at the 50% probability level. | ||
NMR studies
Samples of 1b (10 mM) were prepared in deuterated solvents (>99.8% D, Cambridge Isotope Laboratories, Burgdorf, CH). All NMR experiments were performed on a Bruker DRX-600 NMR spectrometer, equipped with a self-shielded z-axis pulsed field gradient dual broadband inverse probe-head. Chemical shifts were referenced to residual solvent peaks and the temperature was calibrated using a methanol sample.31 To ensure thermal equilibrium at the various temperatures, at least 15 min of equilibration time was allowed for each temperature step. Unambiguous resonance assignment was obtained by two-dimensional COSY, NOESY and HMQC experiments. The acquisition in the direct dimension was performed using 2048 points (170 ms) in all cases. For the indirect dimension 512 increments were measured, corresponding to 85 ms, 85 ms and 40 ms, respectively. The NOE mixing time was set to 1 s. The total experiment times were 60 min, 93 min and 20 min, respectively. For each solvent, several experiments with 10 K temperature steps were performed in order to estimate the coalescence temperature. The activation energy was calculated from the following form of the Eyring equation (eqn (1)):| ΔG = 0.0191Tc(9.97 + log(Tc/Δν)) | (1) |
Dynamic HPLC
For the determination of the free energy of rotation ΔG‡ around the central C–C bond of the biphenyl-based push-pull system 1c, temperature dependent dynamic HPLC was performed. An approximately 1 mg mL−1 solution of compound 1c in iPrOH was prepared. 1 μL of this solution was injected into a chiral CHIRALPAK AD-H column (0.46 × 25 cm; Daicel Chemical Industries Ltd.) at the defined temperature (CTO-10AS VP oven from Shimadzu). The atropisomers were eluted with a mixture of 97![[thin space (1/6-em)]](https://www.rsc.org/images/entities/char_2009.gif) :
:![[thin space (1/6-em)]](https://www.rsc.org/images/entities/char_2009.gif) 3 of n-hexane and iPrOH (SCL-10A VP HPLC from Shimadzu) at a flow rate of 0.5 mL min−1. To guarantee an efficient mixing of both solvents the eluent was prepared as a 94
3 of n-hexane and iPrOH (SCL-10A VP HPLC from Shimadzu) at a flow rate of 0.5 mL min−1. To guarantee an efficient mixing of both solvents the eluent was prepared as a 94![[thin space (1/6-em)]](https://www.rsc.org/images/entities/char_2009.gif) :
:![[thin space (1/6-em)]](https://www.rsc.org/images/entities/char_2009.gif) 6 mixture of n-hexane and iPrOH–n-hexane 1
6 mixture of n-hexane and iPrOH–n-hexane 1![[thin space (1/6-em)]](https://www.rsc.org/images/entities/char_2009.gif) :
:![[thin space (1/6-em)]](https://www.rsc.org/images/entities/char_2009.gif) 1. This premixing procedure turned out to be required due to the poor solubility of 1c at low concentrations of iPrOH in n-hexane. For detection of the chromatogram a UV/vis detector (SPD-M10A VP from Shimadzu) operating at the absorption maxima of the compound under investigation was used (λmax = 270 nm and 371 nm). The column was preconditioned for 10 h under the conditions used for dynamic HPLC experiments before a set of temperature dependent measurements was performed. The studies were performed at temperatures between 10 and 25 °C in 5 °C steps. Three different samples of 1c were measured twice in a row. The forward reaction rate constants k1 were evaluated with the unified equation32 valid for such first order processes by direct integration of the elution profiles by the software program DCXplorer33 developed by O. Trapp. The Gibbs free activation energy ΔG‡(T) was calculated by estimation of the activation enthalpy ΔH‡ of the enantiomerisation process from the slope of the Eyring plot (ln (k1/T) vs. 1/T) and the activation entropy ΔS‡ from the intercept.
1. This premixing procedure turned out to be required due to the poor solubility of 1c at low concentrations of iPrOH in n-hexane. For detection of the chromatogram a UV/vis detector (SPD-M10A VP from Shimadzu) operating at the absorption maxima of the compound under investigation was used (λmax = 270 nm and 371 nm). The column was preconditioned for 10 h under the conditions used for dynamic HPLC experiments before a set of temperature dependent measurements was performed. The studies were performed at temperatures between 10 and 25 °C in 5 °C steps. Three different samples of 1c were measured twice in a row. The forward reaction rate constants k1 were evaluated with the unified equation32 valid for such first order processes by direct integration of the elution profiles by the software program DCXplorer33 developed by O. Trapp. The Gibbs free activation energy ΔG‡(T) was calculated by estimation of the activation enthalpy ΔH‡ of the enantiomerisation process from the slope of the Eyring plot (ln (k1/T) vs. 1/T) and the activation entropy ΔS‡ from the intercept.
Results and discussion
The interconversion of the two atropisomers of cyclophanes 1a–1d can be monitored by NMR coalescence experiments if the half-lives of the enantiomers are in the range of microseconds to seconds. In this case, at temperatures below the coalescence temperature, the exchange between the two enantiomeric forms is slow compared to the NMR time scale (“slow exchange”) and the diastereotopic protons on a CH2-group in the alkyl bridge have different chemical environment and, hence, give rise to two separate signals. In contrast, at temperatures higher than the coalescence (“fast exchange”), an averaged signal is observed for the two methylene protons. Determination of the coalescence temperature and the difference in chemical shift of the diastereotopic methylene protons allows calculation of the Gibbs free activation energy for the racemisation at the coalescence temperature, ΔG‡(Tc) using a modified form of the Eyring equation (see Experimental Section). In order to compare the appropriate chemical shifts, it is necessary to have an unambiguous assignment for all protons of the cyclophanes in the slow exchange regime. This was accomplished by two-dimensional proton–proton and proton–carbon correlation experiments (COSY, NOESY, HMQC).The coalescence temperature (Tc) of the push-pull system shown in Fig. 4 (1b) was measured in different solvents to obtain changes in the activation energy due to solvent effects. As the chemical shifts for 1b can be solvent dependent, the coalescence temperature must also show a variation with the solvent, even in the case of unchanged activation parameters. It is, however, possible that differences in the solvation of the sterically demanding transition state of the racemisation lead to differences in the activation energy. The results of the measurements of 1b in different solvents are shown in Table 1.
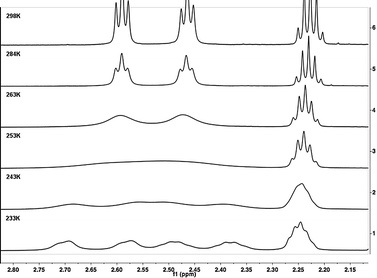 | ||
| Fig. 4 Stacked plot of the low temperature 1H NMR spectra of 1b measured in CDCl3. Starting from fast exchange at 298 K, reaching the coalescence temperature at 252 K, ending in the slow exchange at 233 K where the signals for the four protons are separated. | ||
It was possible to record NMR spectra below and above as well as exactly at the coalescence temperature for most solvents used. Only the melting point of benzene was too high, so that further cooling was not feasible. For toluene, two Tc values for two different sets of resonances were observed. The two different data sets lead to the very same activation energy, as expected. As seen in Table 1, the influence of different solvents on the activation energy is not very pronounced. The polarity of the solvent does not seem to significantly influence the activation energy for the interconversion of the enantiomers. Only in the case of strongly protic conditions (trifluoroacetic acid), a significantly higher activation energy was obtained. This is most likely due to the protonation of the amine group, leading to a pull-pull, rather than a push-pull substitution pattern. In a pull-pull system, the tendency to form a conjugated and, therefore, nearly planar arrangement will be less pronounced compared to the push-pull case, where this resonance stabilisation factor determines the racemisation energy.34 Additionally, two electron-withdrawing groups reduce the π-electron density at the 1 and 1′ positions, which makes an out-of-plane bending of the axis bond more difficult and therefore becomes the dominating contribution to the energy barrier.35,36 In turn, a higher activation is necessary to force the cyclophane to racemisation.
In the case of the ethyl-bridged biphenyl 1a, it was not possible to lower the temperature far enough (<230 K) to reach the coalescence in any solvent. In marked contrast, for compounds 1c and 1d there was no fast exchange regime obtained, even when heating was continued to 353 K in deuterated tetrachloroethane, consistent with findings of earlier studies on unsubstituted biphenyl cyclophanes.37,38 In addition, 2D-EXSY experiments at the elevated temperature indicated that the rate constant of the atropisomerisation has to be below 10−2s−1.39
As mentioned above, it was not possible to determine the rotation barrier of the C–C bond of the butyl- and pentyl-bridged biphenyl derivatives 1c and 1d by coalescence measurements using 1H NMR spectroscopy. Careful analysis of the 1H NMR spectra clearly showed a fixed torsion angle for both push-pull systems. Another useful method to estimate isomerisation energies in cases where NMR spectroscopy fails is dynamic chromatography.25–29 As previously described for such investigations only minute sample amounts are required and stereoisomers do not have to be isolated prior to the analysis. A chromatogram with two separated peaks is expected in the case of a fixed torsion angle of the compounds under investigation when they are separated on a chiral stationary phase. When racemisation occurs on the chromatographic time scale a temperature dependent plateau formation between the two peaks is expected. A third case that can occur in dynamic HPLC is peak coalescence. This occurs when the enantioconversion is significantly faster than the chromatographic separation process.40 Hence, we tried to separate the two atropisomers of 1c and 1d by chiral HPLC. Screening of several cellulose- and amylose-derived HPLC columns revealed that the enantiomers of 1c showed a tendency to separate on Chiralpak AD-H. At 20 °C the two peaks could be separated by approximately 2 min when the compound was eluted with a mixture of n-hexane–iPrOH 97![[thin space (1/6-em)]](https://www.rsc.org/images/entities/char_2009.gif) :
:![[thin space (1/6-em)]](https://www.rsc.org/images/entities/char_2009.gif) 3 at a flow rate of 0.5 mL min−1. Furthermore, plateau formation between the two peaks was observed pointing at the expected interconversion process of atropisomers (Fig. 6). The UV/vis spectra of the two distinctive peaks in the chromatogram and the plateau were the same (Fig. 5), indicating the presence of only one compound and therefore verifying the presence of two atropisomers. The rate constant of enantioconversions can be directly calculated from these typical chromatograms by iterative comparison of experimental and simulated chromatograms.
3 at a flow rate of 0.5 mL min−1. Furthermore, plateau formation between the two peaks was observed pointing at the expected interconversion process of atropisomers (Fig. 6). The UV/vis spectra of the two distinctive peaks in the chromatogram and the plateau were the same (Fig. 5), indicating the presence of only one compound and therefore verifying the presence of two atropisomers. The rate constant of enantioconversions can be directly calculated from these typical chromatograms by iterative comparison of experimental and simulated chromatograms.
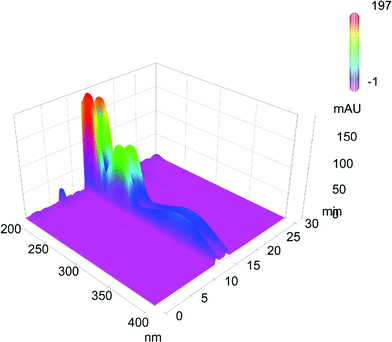 | ||
Fig. 5 Representative chromatogram of push-pull cyclophane 1c, separated by a Chiralpak AD-H column eluting with a mixture of n-hexane–iPrOH 97![[thin space (1/6-em)]](https://www.rsc.org/images/entities/char_2009.gif) : :![[thin space (1/6-em)]](https://www.rsc.org/images/entities/char_2009.gif) 3 and a flow rate of 0.5 mL min−1 at 25 °C. In the third dimension the UV/vis spectra of the separated parts are shown. 3 and a flow rate of 0.5 mL min−1 at 25 °C. In the third dimension the UV/vis spectra of the separated parts are shown. | ||
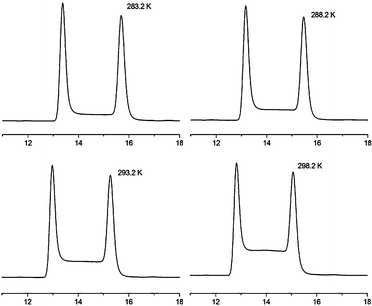 | ||
Fig. 6 Selected experimental enantiomerisation profiles of push-pull cyclophane 1c at different temperatures on Chiralpak AD-H using a mixture of n-hexane–iPrOH 97![[thin space (1/6-em)]](https://www.rsc.org/images/entities/char_2009.gif) : :![[thin space (1/6-em)]](https://www.rsc.org/images/entities/char_2009.gif) 3 as eluent. 3 as eluent. | ||
Thanks to the remarkable work of Schurig27 and Trapp,33,41 powerful computer simulation tools are now available. The simulation programs profit from the so-called “theoretical plate model”,26 its statistical description namely the “stochastic model”41 or more recently the “unified equation”32 to determine the rate constants of enantiomerisation. Temperature dependent dynamic chromatography gives access to thermodynamic data by applying the Eyring equation (eqn (2)).
| k1 = (kBT)/h exp(−ΔG/RT) | (2) |
Thus, temperature dependent dynamic HPLC experiments were performed for compound 1c. Repeated series of measurements were performed between 10 °C and 25 °C in 5 °C steps. To overcome reproducibility problems the column was preconditioned for 10 h operating at the desired conditions. After two series the conditioning was repeated and the measurements were then performed again with a different sample of the same compound. A statistical evaluation was then performed. Peak coalescence or baseline separation were not observed in this temperature range. By computer simulations, using the DCXplorer software,33 of the experimentally obtained elution profiles (Fig. 6) the enantiomerisation rate constants at different temperatures were obtained (Table 2). Since enantiomerisations are degenerate processes k1 and k−1 were assumed to be equal.
With the unified equation obtained, enantiomerisation rate constants of 1c were plotted according to the Eyring equation (ln(k1/T) versus 1/T). By linear regression analysis (Fig. 7), ΔH‡ was found to be ΔH‡ = 54.5 ± 3.9 kJ mol−1 and ΔS‡ = −120 ± 14 J K−1 mol−1. From this, ΔG‡ was calculated to be ΔG298 K‡ = 90.3 ± 0.2 kJ mol−1, which is in the region of 2-phenyl-2′-isopropylbiphenyl and 2-cyclohexyl-2′-phenylbiphenyl (both approx. 91 kJ mol−1) but above the rotational energy barrier of 2,2′-dimethylbiphenyl (approx. 78 kJ mol−1) and below that of 2,2′-diisopropylbiphenyl (approx. 110 kJ mol−1) reported by C. Wolf.42
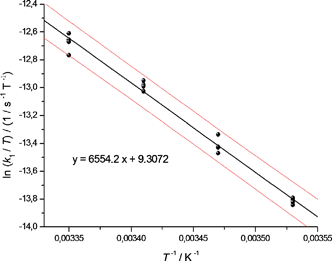 | ||
| Fig. 7 Eyring plot for the atropisomerisation of 1c: temperature dependent dynamic HPLC measurements analysed by linear regression. The upper and lower curves represent the error bands of the linear regression with a level of confidence of 95%. For the linear regression, four measurements for each temperature were considered. | ||
Unfortunately, such an investigation for the pentyl-bridged biphenyl-based push-pull system 1d was not possible by dynamic chromatography as coalescence was observed even at low temperatures. Thus, an enantioconversion faster than the chromatographic separation process can be assumed. Since 1H NMR coalescence measurements showed a fixed conformation of the two phenyls of compound 1d, it is obvious that the free energy of rotation is between 50 kJ mol−1 obtained for the 7-membered ring derivative 1b and 90 kJ mol−1 obtained for the 8-membered cyclophane 1c.
By comparison of the rotational energy barriers of the torsion angle restricted biphenyl-based push-pull cyclophanes 1a–1d it is obvious that the butyl-bridged system 1c is the conformationally most stable compound of the series followed by the pentyl-bridged derivative 1d. Compound 1c atropisomerises with a half life time τ1/2 of 12.5 min which means that this compound can be assumed to have a fixed torsion angle in most physical investigations such as EFISH measurements. For the propyl-bridged push-pull system 1b this is not the case since the energy barrier for atropisomerisation is relatively low and therefore, depending on the time frame of the experiment, isomerisation can take place during measurements which would lead to a distribution of different torsion angles and therefore to an averaged torsion angle over the course of the experiment. The same is true for the ethyl-bridged derivative 1a which is even more flexible than 1b.
To explain this rather unexpected grading in enantiomerisation energies, we hypothesise a sterically more crowded transition through a planar, linear conformation in the isomerisation process. Linearity of the biphenyl core can be assumed since partial double-bond character of the central C–C bond was observed in the crystal structure of the 2 and 2′ position unsubstituted push-pull system. This means that the longer the alkyl-bridge, the closer the methylene groups have to pass by each other in the planar conformation. The pentyl-bridge in system 1d seems to have too many degrees of freedom and hence it can arrange in a sterically more favourable fashion to allow isomerisation in an energetically more convenient way.
Conclusion
In summary, the rotational energy barrier of 1b (3-nitro-9-(piperidin-1-yl)-6,7-dihydro-5H-dibenzo[a,c]cycloheptene) was estimated to be ΔG298 K‡ = 50 kJ mol−1 by 1H NMR coalescence measurements. Using computer simulation of experimentally obtained temperature dependent dynamic HPLC elution profiles the barrier of rotation of 1c (3-nitro-10-(piperidin-1-yl)-5,6,7,8-tetrahydrodibenzo[a,c]cyclooctene) was determined to be ΔG298 K‡ = 90 kJ mol−1. The rotational energy barrier of 1a (1-(7-nitro-9,10-dihydrophenanthren-2-yl)piperidine) and 1d (3-nitro-11-(piperidin-1-yl)-6,7,8,9-tetrahydro-5H-dibenzo[a,c]cyclononene) could only be evaluated qualitatively by comparing them with the two quantitatively analysed derivatives 1b and 1c.Unfortunately, the separation of the two atropisomers failed for all non-linear optically active compounds 1a–1d, and thus it was not possible to grow noncentrosymmetric crystals. Nevertheless, we obtained insight in the conformational stability of our systems 1a–1d. For compound 1a, the rotation around the central C–C bond is rather fast and so the system has to be considered to be flexible. Also, the rotation around the central axis of the propyl-bridged push-pull cyclophane 1b is quite fast at room temperature. Depending on the physical experiment, compound 1c and 1d can be assumed as torsion angle fixed systems when the experimental timescale is in the region of seconds. Nevertheless, the maximal possible torsion angle was defined by bridging the biphenyl core with alkyl chains. Motivated by these results, it will now be of interest to determine the rotational energy barrier of 2,2′-alkyl-bridged and 4 and 4′ position donor-substituted biphenyl systems and 4,4′-diacceptor-substituted biphenyl systems which are available in our group and have already been investigated in single molecule conductance measurements.30,43,44
Acknowledgements
The authors acknowledge financial support from the Swiss National Science Foundation and the National Center of Competence in Research ‘Nanoscale Science’. We thank Oliver Trapp for kindly providing his software tools for the analyses of chromatograms. Furthermore we thank Paolo Clerici and Dominik Frank for their support in performing HPLC measurements and Thomas Eaton for proofreading the manuscript.Notes and references
- D. J. Williams, Angew. Chem., 1984, 96, 637–51 CAS.
- D. R. Kanis, M. A. Ratner and T. J. Marks, Chem. Rev., 1994, 94, 195–242 CrossRef CAS.
- L. R. Dalton, Pure Appl. Chem., 2004, 76, 1421–1433 CrossRef CAS.
- L. R. Dalton, W. H. Steier, B. H. Robinson, C. Zhang, A. Ren, S. Garner, A. Chen, T. Londergan, L. Irwin, B. Carlson, L. Fifield, G. Phelan, C. Kincaid, J. Amend and A. Jen, J. Mater. Chem., 1999, 9, 1905–1920 RSC.
- B. H. Robinson, L. R. Dalton, A. W. Harper, A. Ren, F. Wang, C. Zhang, G. Todorova, M. Lee, R. Aniszfeld, S. Garner, A. Chen, W. H. Steier, S. Houbrecht, A. Persoons, I. Ledoux, J. Zyss and A. K. Y. Jen, Chem. Phys., 1999, 245, 35–50 CrossRef CAS.
- C.-Z. Zhang, C. Lu, J. Zhu, C.-Y. Wang, G.-Y. Lu, C.-S. Wang, D.-L. Wu, F. Liu and Y. Cui, Chem. Mater., 2008, 20, 4628–4641 CrossRef CAS.
- R. D. Wampler, A. J. Moad, C. W. Moad, R. Heiland and G. J. Simpson, Acc. Chem. Res., 2007, 40, 953–960 CrossRef CAS.
- E. M. Graham, V. M. Miskowski, J. W. Perry, D. R. Coulter, A. E. Stiegman, W. P. Schaefer and R. E. Marsh, J. Am. Chem. Soc., 1989, 111, 8771–9 CrossRef CAS.
- K. S. Thanthiriwatte and K. M. Nalin de Silva, THEOCHEM, 2002, 617, 169–175 CrossRef CAS.
- W. Bartkowiak and T. Misiaszek, Chem. Phys., 2000, 261, 353–357 CrossRef CAS.
- H. Kang, A. Facchetti, H. Jiang, E. Cariati, S. Righetto, R. Ugo, C. Zuccaccia, A. Macchioni, C. L. Stern, Z. Liu, S.-T. Ho, E. C. Brown, M. A. Ratner and T. J. Marks, J. Am. Chem. Soc., 2007, 129, 3267–3286 CrossRef CAS.
- N. J. Long, Angew. Chem., Int. Ed. Engl., 1995, 34, 21–38 CrossRef CAS.
- M. Barzoukas, M. Blanchard-Desce, D. Josse, J. M. Lehn and J. Zyss, Chem. Phys., 1989, 133, 323–9 CrossRef CAS.
- T. Verbiest, S. Houbrechts, M. Kauranen, K. Clays and A. Persoons, J. Mater. Chem., 1997, 7, 2175–2189 RSC.
- C. Bosshard, G. Knoepfle, P. Pretre and P. Guenter, J. Appl. Phys., 1992, 71, 1594–605 CrossRef CAS.
- R. Spreiter, C. Bosshard, G. Knopfle, P. Gunter, R. R. Tykwinski, M. Schreiber and F. Diederich, J. Phys. Chem. B, 1998, 102, 29–32 CrossRef CAS.
- A. Facchetti, A. Abbotto, L. Beverina, M. E. Van Der Boom, P. Dutta, G. Evmenenko, T. J. Marks and G. A. Pagani, Chem. Mater., 2002, 14, 4996–5005 CrossRef CAS.
- T. J. Marks and M. A. Ratner, Angew. Chem., Int. Ed. Engl., 1995, 34, 155–73 CrossRef CAS.
- J. Zyss, J. F. Nicoud and M. Coquillay, J. Chem. Phys., 1984, 81, 4160–7 CrossRef CAS.
- J. L. Oudar and R. Hierle, J. Appl. Phys., 1977, 48, 2699–704 CrossRef CAS.
- T. Verbiest, S. Van Elshocht, M. Karuanen, L. Heliemans, J. Snauwaert, C. Nuckolls, T. J. Katz and A. Persoons, Science, 1998, 282, 913–915 CrossRef CAS.
- G. Iftime, G. G. A. Balavoine, J.-C. Daran, P. G. Lacroix and E. Manoury, C. R. Acad. Sci., Ser. IIc: Chim., 2000, 3, 139–146 CrossRef CAS.
- J. Rotzler, D. Vonlanthen, A. Barsella, A. Boeglin, A. Fort and M. Mayor, Eur. J. Org. Chem., 2010, 6, 1096–1110.
- G. Binsch and H. Kessler, Angew. Chem., 1980, 92, 445–63 CrossRef CAS.
- V. Schurig, W. Buerkle, A. Zlatkis and C. F. Poole, Naturwissenschaften, 1979, 66, 423–4 CrossRef CAS.
- W. Buerkle, H. Karfunkel and V. Schurig, J. Chromatogr., A, 1984, 288, 1–14 CrossRef.
- M. Jung and V. Schurig, J. Am. Chem. Soc., 1992, 114, 529–34 CrossRef CAS.
- O. Trapp, G. Schoetz and V. Schurig, Chirality, 2001, 13, 403–414 CrossRef CAS.
- C. Wolf, Chem. Soc. Rev., 2005, 34, 595–608 RSC.
- D. Vonlanthen, J. Rotzler, M. Neuburger and M. Mayor, Eur. J. Org. Chem., 2010, 1, 120–133.
- A Van Geet, Anal. Chem., 1968, 40, 2227–9 CrossRef CAS.
- O. Trapp, Anal. Chem., 2006, 78, 189–198 CrossRef CAS.
- O. Trapp, J. Chromatogr., B: Anal. Technol. Biomed. Life Sci., 2008, 875, 42–47 CrossRef CAS.
- M. Oki, H. Iwamura and G. Yamamoto, Bull. Chem. Soc. Jpn., 1971, 44, 262–5 CAS.
- M. Oki and G. Yamamoto, Bull. Chem. Soc. Jpn., 1971, 44, 266–70 CrossRef CAS.
- M. Oki, Methods in Stereochemical Analysis, Vol. 4: Applications of Dynamic NMR Spectroscopy to Organic Chemistry, 1985 Search PubMed.
- K. Ohkata, R. L. Paquette and L. A. Paquette, J. Am. Chem. Soc., 1979, 101, 6687–93 CrossRef CAS.
- R. B. Bates, F. A. Camou, V. V. Kane, P. K. Mishra, K. Suvannachut and J. J. White, J. Org. Chem., 1989, 54, 311–17 CrossRef CAS.
- C. L. Perrin and T. J. Dwyer, Chem. Rev., 1990, 90, 935–67 CrossRef CAS.
- V. Schurig, Chirality, 1998, 10, 140–146 CAS.
- O. Trapp and V. Schurig, Comput. Chem., 2001, 25, 187–195 CrossRef CAS.
- C. Wolf and H. Xu, Tetrahedron Lett., 2007, 48, 6886–6889 CrossRef CAS.
- D. Vonlanthen, A. Mishchenko, M. Elbing, M. Neuburger, T. Wandlowski and M. Mayor, Angew. Chem., Int. Ed., 2009, 48, 8886–8890 CrossRef CAS.
- A. Mishchenko, D. Vonlanthen, V. Meded, M. Burkle, C. Li, I. V. Pobelov, A. Bagrets, J. K. Viljas, F. Pauly, F. Evers, M. Mayor and T. Wandlowski, Nano Lett., 2010, 10, 156–163 CrossRef CAS.
Footnote |
† Crystal data and structure refinement for cyclophane 1c: The crystal was measured on a Bruker Kappa Apex2 diffractometer at 123 K using graphite-monochromated Mo-Kα-radiation with λ = 0.71073 Å, Θmax = 27.655°. Minimal/maximal transmission 0.99/0.99, μ = 0.083 mm−1. 1c formula C21H24N2O2, M = 336.43 g mol−1, F(000) = 1440, yellow block, size 0.070 0.130 0.290 mm3, monoclinic, space groupC2/c, Z = 8, a = 25.437(6) Å, b = 10.510(2) Å, c = 17.615(5) Å, α = 90°, β = 132.55(2)°, γ = 90°, V = 3469.1(18) Å3, Dc = 1.288 Mg m−3. The Apex2 suite has been used for data collection and integration. From a total of 21![[thin space (1/6-em)]](https://www.rsc.org/images/entities/char_2009.gif) 978 reflections, 4017 were independent (merging r = 0.111). From these, 2392 were considered as observed (I > 2.0σ(I)) and were used to refine 226 parameters. The structure was solved by direct methods using the program SIR92. Least-squares refinement against F was carried out on all non-hydrogen atoms using the program CRYSTALS. R = 0.0533 (observed data), wR = 0.1511 (all data), GOF = 1.0519. Minimal/maximal residual electron density = −0.31/0.33 e Å−3. Chebychev polynomial weights were used to complete the refinement. Plots were produced using Mercury 2.3 and ORTEP3 for Windows. 978 reflections, 4017 were independent (merging r = 0.111). From these, 2392 were considered as observed (I > 2.0σ(I)) and were used to refine 226 parameters. The structure was solved by direct methods using the program SIR92. Least-squares refinement against F was carried out on all non-hydrogen atoms using the program CRYSTALS. R = 0.0533 (observed data), wR = 0.1511 (all data), GOF = 1.0519. Minimal/maximal residual electron density = −0.31/0.33 e Å−3. Chebychev polynomial weights were used to complete the refinement. Plots were produced using Mercury 2.3 and ORTEP3 for Windows. |
| This journal is © The Royal Society of Chemistry 2011 |
