Composition tuning the upconversion emission in NaYF4:Yb/Tm hexaplate nanocrystals
Hua
Zhang
a,
Yujing
Li
a,
Yungchen
Lin
a,
Yu
Huang
*ac and
Xiangfeng
Duan
*bc
aDepartment of Materials Science and Engineering, University of California, Los Angeles, CA 90095, USA. E-mail: yhuang@seas.ucla.edu
bDepartment of Chemistry and Biochemistry, University of California, Los Angeles, CA 90095, USA. E-mail: xduan@chem.ucla.edu
cCalifornia Nanosystems Institute, University of California, Los Angeles, CA 90095, USA
First published on 25th January 2011
Abstract
Single crystal hexagonal NaYF4:Yb/Tm nanocrystals have been synthesized with uniform size, morphology and controlled chemical composition. Spectroscopic studies show that these nanocrystals exhibit strong energy upconversion emission when excited with a 980 nm diode laser, with two primary emission peaks centered around 452 nm and 476 nm. Importantly, the overall and relative emission intensity at these wavelengths can be readily tuned by controlling the concentration of the trivalent rare earth element dopants at the beginning of the synthesis which has been confirmed by EDX for the first time. Through systematic studies, the optimum rare earth ion doping concentration can be determined for the strongest emission intensity at the selected peak(s). Confocal microscopy studies show that the upconversion emission from individual NCs can be readily visualized. These studies demonstrate a rational approach for fine tuning the upconversion properties in rare-earth doped nanostructures and can broadly impact areas ranging from energy harvesting, energy conversion to biomedical imaging and therapeutics.
When a medium emits fluorescence as a result of being excited with an incident light, the wavelength of the fluorescence is usually longer than that of the excitation light which is called down-conversion.1 However, under some special circumstances, one can observe upconversion fluorescence, in which the wavelength of the emitted light is shorter than that of the excitation light.2,3 This unique property makes upconversion materials attractive for a wide range of applications.4–7 In particular, the fact that they can be excited with infrared light makes them attractive candidates as biological probes for deeper imaging with lower noise, in contrast to traditional organic dyes and quantum dots.8–11 Recently, considerable efforts have been devoted to the synthesis of energy upconversion nanoparticles.12,13
Trivalent rare earth element (RE3+) doped materials are among the most promising materials for energy upconversion because they have multiple long-lived excited states and can exhibit highly efficient energy transfer processes that are responsible for upconversion emission under certain conditions.2,3,14–16 Here, we focus our efforts on Yb–Tm doped systems that can emit violet (452 nm) or blue (476 nm) light. The ability to achieve this shorter wavelength emission is of significance for activating certain chemical or biological processes. For example, the 476 nm light can be used to excite channelrhodopsins, which are a subfamily of opsin proteins that function as light-gated ion channels in neural cells.17 Therefore, it is important that the emission wavelength can be tuned by introducing different dopants or doping ratios. By varying the exact doping concentration during the chemical synthesis process, we show that the overall and relative emission intensity of the selected spectral peaks can be readily tuned.
NaYF4 can adopt either a cubic or hexagonal structure.12,15,18 It is well known that the hexagonal structure is a more efficient matrix for upconversion phosphors.19–21 However, most synthetic approaches result in the cubic phase NaYF4/NaYbF4.22–24 Here we discuss the synthesis of NaYF4 hexaplate nanocrystals (NCs) through a solution chemical approach at high temperature.
The synthesis was carried out with standard oxygen-free procedures as reported before.25,26 All chemicals were purchased from Sigma-Aldrich and used without further purification. In a typical procedure, a certain amount of yttrium(III) oxide (Y2O3, 99.99%), ytterbium(III) oxide (Yb2O3, 99.9%) and thulium(III) oxide (Tm2O3, 99.9%) (1.25 mmol in all with the relative ratio depending on the exact doping concentration) were dissolved in 5 mL trifluoroacetic acid (TFA, 99%) in a 100 mL three-necked flask. The slurry was then heated to 80 °C with vigorous magnetic stirring under vacuum for 30 minutes to remove water and excessive TFA. Next, 2.5 mmol sodium trifluoroacetate (NaCOOCF3, 98%) was added, along with 7.5 mL of oleic acid (OA, 90%) and 7.5 mL of 1-octadecene (ODE, 90%) at 100 °C. Afterwards, the solution was heated to 330 °C with a rate of 30 °C min−1 and maintained at 330 °C for 60 minutes to obtain the NCs.
The microstructures, morphologies and compositions of the NaYF4:Yb/Tm NCs were characterized by a JEOL 6700 FEG scanning electron microscope (SEM) with an energy-dispersive X-ray spectroscopy (EDX). The microstructures and lattice images of NaYF4:Yb/Tm NCs were observed by an FEI CM120 transmission electron microscope (TEM) and an FEI Titan high-resolution transmission electron microscope (HRTEM). Room temperature photoluminescence spectra were collected on a Spec-10® system from Princeton Instruments including a liquid nitrogen cooled CCD camera (Spectra Pro® 2300i, Model: 7509-0001). Confocal photoluminescence images were taken on a Leica TCS-SP2 AOBS inverted Confocal and Multiphoton Microscope (Mannheim, Germany) equipped with a Spectra-Physics MaiTai picosecond pulsed infrared laser (Mountain View, CA) set at 980 nm for infrared excitation.
The SEM and TEM images show that the NaYb0.99Tm0.01F4 NCs have a hexagonal plate structure with a nearly mono-dispersed size (Fig. 1a and b). The diagonal length of the hexagonal plate is about 180 nm with a thickness of 50 nm. The well-defined hexagonal morphology of the NCs suggests that they are single crystals. Indeed, the HRTEM and SAED images confirmed that the as-prepared NCs are single crystals with a hexagonal phase. The lattice spacing of 5.13 Å in HRTEM image corresponds to (100) lattice planes (Fig. 1c and inset).
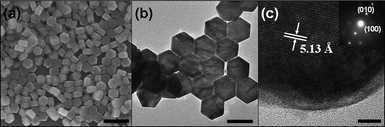 | ||
| Fig. 1 (a) SEM, (b)TEM, (c and inset) HRTEM and SAED images of NaYbF4:Tm NPs with uniform hexagonal shape (the scale bars correspond to 400 nm, 200 nm and 5 nm, respectively). | ||
Although the upconversion emission peak positions usually cannot be changed for a given upconversion material, the emission efficiency at different wavelengths can be greatly affected by different doping concentrations. To this end, we have carried out systematic studies to control the rare earth element doping concentrations in these nanocrystals. Importantly, our studies show that the doping concentration in the final NC product is directly correlated to the initial reactant ratio. For example, we have prepared a series of NaY0.8−xYb0.2TmxF4 and NaYb1−xTmxF4 NCs with variable Tm3+ ion concentrations. The plot of the Tm3+ concentration in the NCs vs. the starting reactant ratio shows a clear linear relation with a slope close to one (Fig. 2). These studies demonstrate that all the rare earth elements can be effectively incorporated into the final NCs with our synthetic conditions. Therefore, the RE3+ doping concentration can be readily controlled by varying the initial reactant ratio. The size, morphology and dispersity of the NCs of variable compositions remained similar to what have been shown in Fig. 1.
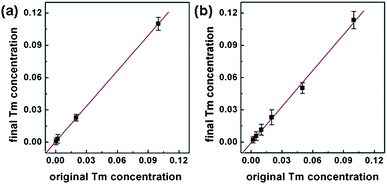 | ||
| Fig. 2 Diagram of final Tm3+ concentration versus original Tm3+ concentration in (a) NaY0.8−xYb0.2TmxF4 NCs and (b) NaYb1−xTmxF4 NCs. | ||
In RE3+ doped materials, the energy transfer process between adjacent ions is the primary reason responsible for the upconversion emission. Therefore, a close match between different transition levels of the rare earth ions can critically impact the probability of the energy transfer process and the efficiency of the upconversion process. In the Yb–Tm co-doped materials, the infrared radiation can be efficiently converted into blue emission by a three-photon process or violet emission by a four-photon upconversion process due to the existence of multiple energy resonances in the system (Fig. 3). One energy transfer step from Yb3+ ion to Tm3+ ion populates the 3H5 level of Tm3+ from 3H6. The 3H5 decays rapidly to the 3F4 level. The second energy transfer step raises the Tm3+ ion from 3F4 to 3F2 that quickly decays to 3H4. Subsequently, the third transfer step raises the Tm3+ ion from 3H4 to 1G4 that can yield a blue emission upon radiative relaxation back to 3H6. A fourth energy transfer step from Yb3+ ion to Tm3+ ion may also take place to populate the Tm3+ ion from 1G4 to 1D2, which is however usually less efficient due to the relative large energy mismatch. An alternative way to populate 1D2 is through cross relaxation between adjacent Tm3+ ions with three possible routes: 3F2 → 3H6 and 3H4 → 1D2; 1G4 → 3F4 and 3H4 → 1D2; and 1G4 → 1D2 and 3H4 → 3F4.27 The relaxation of 1D2 to 3F4 leads to a violet emission.
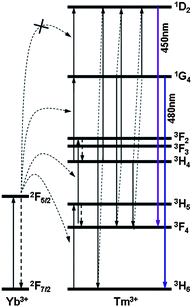 | ||
| Fig. 3 Schematic illustration of the energy levels involved in the upconversion process of Tm3+ with Yb3+ as the promoter for NaYF4:Yb,Tm NCs. | ||
The upconversion emission of the NCs was characterized in chloroform solution with a fixed amount of NCs (typically 1 wt%) of variable Tm3+ concentration under 980 nm diode laser excitation with a total power of 38 mW.
Fig. 4a shows the emission spectra of NaY0.8−xYb0.2TmxF4nanoparticles at different doping concentrations of Tm3+ ions. The two strongest peaks occur at 452 nm (violet) and 476 nm (blue), corresponding to relaxation of 1D2 → 3F4 and 1G4 → 3H6, respectively. The intensity increases slightly when the Tm3+ concentration is increased from 0.05 to 0.2 molar fraction and then decreases with a further increase of Tm3+ concentration. It is reasonable to assume that if the Tm3+ ion concentration is too low, there will not be enough Tm3+ ion to be populated or excited.2,3 At this point, the emission intensity increases with increasing number of Tm3+ ions in the system. On the other hand, a further increase in the Tm3+ concentration beyond a certain threshold can lead to a decrease in the emission intensity. This is partly because a cross-relaxation mechanism exists between Tm3+ ions that can lead to a self-quenching effect: the increase of the Tm3+ concentration leads to a decrease in the distance between adjacent Tm3+ ions and an increase in the probability of cross-relaxation that reduces radiative relaxation, and thus suppresses the upconversion emission in high Tm3+ ion concentrated samples. At the same time, for a given overall excitation energy, the excitation received by individual Tm ions decreases with increasing Tm doping concentrations, which could also contribute to the weakened Tm emission.28–30 Plotting the upconversion emission intensity normalized by the number of Tm3+ ions as a function of Tm3+ concentration, a monotonic decrease in intensity could be observed (Fig. 4c), suggesting that the cross-relaxation between neighboring Tm3+ ions exists in all samples including the very low-dope samples.
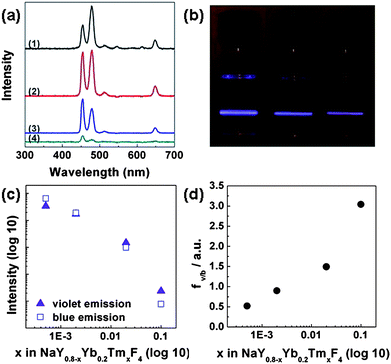 | ||
| Fig. 4 (a) Upconversion emission spectra of NaY0.8−xYb0.2TmxF4 NCs with different Tm3+ concentrations, x = 0.0005, 0.002, 0.02, 0.1, for (1), (2), (3), (4) respectively. (b) Digital camera pictures ofNaY0.7995Yb0.2Tm0.0005F4, NaY0.798Yb0.2Tm0.002F4 and NaY0.78Yb0.2Tm0.02F4 (from left to right) samples under 980 nm excitation. (c) Upconversion emission intensity (normalized by Tm3+ ion concentration) versus doping concentration of Tm3+ in NaY0.8−xYb0.2TmxF4 NCs. (d) Diagram of violet to blue emission (fv/b) ratio versusTm3+ doping concentration in NaY0.8−xYb0.2TmxF4 NCs. | ||
Fig. 4a also shows that the preferred emission wavelength changes from blue to violet with increasing the Tm3+ concentration. The digital camera images of NCs fluorescence clearly show different colors (from blue to violet) for the samples with increasing Tm3+ ion doping concentration (Fig. 4b). Plotting the ratio of violet vs. blue emission (fv/b) shows a monotonic increase with the increasing Tm3+ ion concentration (Fig. 4d). This colour change as a function of Tm3+ ion concentration may be attributed to possible cross-relaxation processes: 1G4 → 3F4 and 3H4 → 1D2; and 1G4 → 1D2 and 3H4 → 3F4. These cross-relaxation processes decrease the 1G4 population and increase the 1D2 population. Therefore, with increasing Tm3+ ion concentration and increasing the probability of cross-relaxation, one would expect to see relatively stronger violet emission originated from 1D2 state and weaker blue emission originated from 1G4 state, resulting in an increase in violet/blue ratio (fv/b) with the increase of Tm3+ concentration.
Additionally, we have further explored a simpler NaYbF4:Tm system, using NaYbF4 as the matrix and Tm as the dopant, and investigated the emission intensity vs. doping concentration. Fig. 5a shows the emission spectra of a series of NaYbF4:Tm NCs with variable Tm3+ concentrations. Interestingly, only one dominant emission peak at 452 nm can be seen in this system. A maximum violet over blue emission ratio of 5.5 is observed. Removing Y3+ ion away from the system increases the Yb3+ ion concentration, which makes it possible that cross-relaxation between Tm3+ ions to Yb3+ ions can also take place, reducing the population of the 1G4 state in a more significant way than the 1D2 state,31 and thus significantly suppressing 476 nm emission from 1G4 state, leaving the 452 nm (violet) emission from the 1D2 state the dominant peak here.
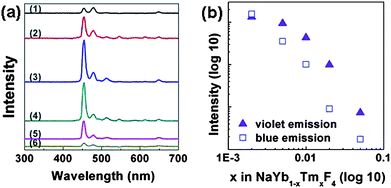 | ||
| Fig. 5 (a) Upconversion emission spectra of NaYb1−xTmxF4 NCs with different Tm3+ concentrations, x = 0.002, 0.005, 0.01, 0.02, 0.05, 0.1, for (1), (2), (3), (4), (5), (6) respectively. (b) Tm3+ normalized upconversion emission intensity versus doping concentration of Tm3+ in NaYb1−xTmxF4. | ||
The spectra in Fig. 5a also show that the best intensity is observed in the sample with a composition of NaYb0.99Tm0.01F4; an additional decrease or increase in the Tm3+ concentration will result in a decrease in overall upconversion intensity. Normalizing the emission intensity by the number of Tm3+ ions, a monotonic decrease of the emission intensity vs. doping concentration could be easily observed (Fig. 5b), which is consistent with the result shown in Fig. 4c, suggesting that the cross-relaxation between adjacent Tm3+ ions is primarily responsible for the self-quenching and the decrease of emission intensity at high Tm3+ concentration.
Lastly, we have also used confocal microscopy to investigate the upconversion emission from individual NCs. To this end, the NCs were first spin-coated onto a glass slide. The reflection image of the NCs on glass slide shows well separated NCs or NC clusters (Fig. 6a). SEM image of a similar sample prepared on silicon wafer further shows the NCs are either single NCs or a few NC clusters (inset, Fig. 6a). Importantly, the confocal photoluminescence image (Fig. 6b) clearly shows strong emission from the NCs when excited with the 980 nm laser, with each bright spot in the image corresponding to emission from one or a few NCs. These studies clearly show that upconversion emission from the NCs can be readily visualized by a confocal microscope, which is of significance for exploring them as fluorescence tags for biomedical imaging.
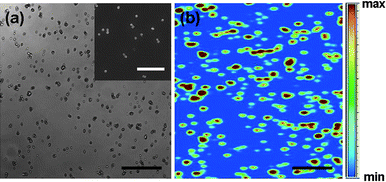 | ||
| Fig. 6 (a) Reflection image of NCs on glass substrate. (Inset) SEM image of a similar sample prepared on silicon wafer. (b) Confocal photoluminescence image of the upconversion nanocrystals shown in (a). (Scale bar: 25 µm for (a) and (b), and 5µm for the inset). | ||
In summary, we successfully prepared NaYF4:Yb/Tm hexagonal plate NCs with controlled composition by varying the doping concentrations when synthesizing the NCs. Photoluminescence studies show strong upconversion emission in blue and violet region from the NCs when excited with 980 nm light. Importantly, the overall emission intensity and relative ratio of these two emission colours can be readily tuned by varying the exact RE3+ doping concentration. These studies demonstrate a rational approach to tune the upconversion emission from rare earth element doped nanomaterials, and can broadly impact fields ranging from energy harvesting and energy conversion to biomedical imaging and therapeutics.
Acknowledgements
X.D. acknowledges support by the NIH Director's New Innovator Award Program, part of the NIH Roadmap for Medical Research, through grant number 1DP2OD004342-01. We acknowledge Electron Imaging Center for Nanomachines (EICN) at UCLA for the support of TEM. Confocal laser scanning microscopy was performed at the CNSI Advanced Light Microscopy/Spectroscopy Shared Resource Facility at UCLA, supported with funding from NIH-NCRR shared resources grant (CJX1-443835-WS-29646) and NSF Major Research Instrumentation grant (CHE-0722519). We acknowledge Dr Matthew Schibler for technical support on the confocal miscroscope. Y.H. acknowledges partial support from the Chinese American Faculty Association (CAFA) Faculty Development award.Notes and references
- G. Blasse and B. C. Grabmaier, Luminescent Materials, Springer, Berlin, 1994 Search PubMed.
- F. Auzel, Chem. Rev., 2004, 104, 139 CrossRef CAS.
- F. Wang and X. Liu, Chem. Soc. Rev., 2009, 38, 976 RSC.
- S. F. Lim, R. Riehn, W. S. Ryu, N. Khanarian, C. K. Tung, D. Tank and R. H. Austin, Nano Lett., 2006, 6, 169 CrossRef CAS.
- D. K. Chatterjee, A. J. Rufaihah and Y. Zhang, Biomaterials, 2008, 29, 937 CrossRef CAS.
- D. K. Chatterjee, L. S. Fong and Y. Zhang, Adv. Drug Delivery Rev., 2008, 60, 1627–1637 CrossRef CAS.
- L. Y. Wang, R. X. Yan, Z. Y. Huo, L. Wang, J. H. Zeng, J. Bao, X. Wang, Q. Peng and Y. D. Li, Angew. Chem., Int. Ed., 2005, 44, 6054 CrossRef CAS.
- F. Wang, W. B. Tan, Y. Zhang, X. P. Fan and M. Q. Wang, Nanotechnology, 2006, 17, R1 CrossRef.
- C. A. Mirkin, R. L. Letsinger, R. C. Mucic and J. J. Storhoff, Nature, 1996, 382, 607 CrossRef CAS.
- J. L. Seifert, R. E. Connor, S. A. Kushon, M. Wang and A. Armitage, J. Am. Chem. Soc., 1999, 121, 2987 CrossRef CAS.
- W. C. W. Chan and S. M. Nie, Science., 1998, 281, 2016 CrossRef CAS.
- H. X. Mai, Y. W. Zhang, R. Si, Z. G. Yan, L. D. Sun, L. P. You and C. H. Yan, J. Am. Chem. Soc., 2006, 128, 6426 CrossRef CAS.
- O. Ehlert, R. Thomann, M. Darbandi and T. Nann, ACS Nano, 2008, 2, 120 CrossRef CAS.
- D. R. Gamelin and H. U. Gudel, Top. Curr. Chem., 2001, 214, 1 CAS.
- H. X. Mai, Y. W. Zhang, L. D. Sun and C. H. Yan, J. Phys. Chem. C, 2007, 111, 13730 CrossRef CAS.
- H. X. Mai, Y. W. Zhang, L. D. Sun and C. H. Yan, J. Phys. Chem. C, 2007, 111, 13721 CrossRef CAS.
- G. Nagel, T. Szellas, W. Huhn, S. Kateriya, N. Adeishvili, P. Berthold, D. Ollig, P. Hegemann and E. Bamberg, Proc. Natl. Acad. Sci. U. S. A., 2003, 100, 13940 CrossRef CAS.
- L. Y. Wang and Y. D. Li, Chem. Mater., 2007, 19, 727 CrossRef CAS.
- L. F. Liang, H. Wu, H. L. Hu, M. M. Wu and Q. Su, J. Alloys Compd., 2004, 368, 94 CrossRef CAS.
- A. Aebischer, M. Hostettler, J. Hause, K. Kramer, T. Weber, H. U. Gudel and H. B. Buergi, Angew. Chem., Int. Ed., 2006, 45, 2802 CrossRef CAS.
- K. W. Kramer, D. Biner, G. Frei, H. U. Gudel, M. P. Hehlen and S. R. Luthi, Chem. Mater., 2004, 16, 1244 CrossRef.
- S. Heer, K. Kompe, H. U. Gudel and M. Haase, Adv. Mater., 2004, 16, 2102 CrossRef CAS.
- J. C. Boyer, F. Vetrone, L. A. Cuccia and J. A. Capobianco, J. Am. Chem. Soc., 2006, 128, 7444 CrossRef CAS.
- Z. Q. Li and Y. Zhang, Angew. Chem., Int. Ed., 2006, 45, 7732 CrossRef CAS.
- H. Zhang, Y. Li, I. A. Ivanov, Y. Qu, Y. Huang and X. Duan, Angew. Chem., Int. Ed., 2010, 16, 2865.
- H. Zhang, D. Xu, Y. Huang and X. Duan, Chem. Commun., 2011, 47, 979 RSC.
- G. Wang, W. Qin, L. Wang, G. Wei, P. Zhu and R. Kim, Opt. Express, 2008, 16, 11907 CrossRef CAS.
- F. Wang and X. G. Liu, J. Am. Chem. Soc., 2008, 130, 5642 CrossRef CAS.
- F. Wang, Y. Han, C. S. Lim, Y. Lu, J. Wang, J. Xu, H. Chen, C. Zhang, M. Hong and X. Liu, Nature, 2010, 463, 1061 CrossRef CAS.
- A. Yin, Y. Zhang, L. Sun and C. Yan, Nanoscale, 2010, 2, 953 RSC.
- W. Ryba-Romanowski, S. Golab, G. Dominiak-Dzik, M. Zelechower and J. Gabrys-Pisarska, J. Alloys Compd., 2001, 325, 215 CrossRef CAS.
| This journal is © The Royal Society of Chemistry 2011 |