Carbon-coated SnO2 nanotubes: template-engaged synthesis and their application in lithium-ion batteries
Ping
Wu
,
Ning
Du
,
Hui
Zhang
,
Jingxue
Yu
,
Yue
Qi
and
Deren
Yang
*
State Key Lab of Silicon Materials and Department of Materials Science and Engineering, Zhejiang University, Hangzhou, 310027, P. R. China. E-mail: mseyang@zju.edu.cn; Fax: +86 571 87952322; Tel: +86 571 87951667
First published on 29th November 2010
Abstract
This paper reports the synthesis of carbon-coated SnO2 (SnO2–C) nanotubes through a simple glucose hydrothermal and subsequent carbonization approach by using Sn nanorods as sacrificial templates. The as-synthesized SnO2–C nanotubes have been applied as anode materials for lithium-ion batteries, which exhibit improved cyclic performance compared to pure SnO2 nanotubes. The hollow nanostructure, together with the carbon matrix which has good buffering effect and high electronic conductivity, can be responsible for the improved cyclic performance.
Introduction
Lithium-ion batteries has conquered the portable electronic market, such as cellular telephone and lap-top computer, and it's also the prime candidate for the next generation of electric vehicles.1Graphite is commonly used as anode materials in most commercial Li-ion batteries. However, the relatively low theoretical capacity of graphite (372 mAh g−1) limits its applications for high energy density electric vehicles. Recently, much attention has been paid to the search for alternative anodes with high reversible capacity. Tin-based anode materials (SnO2, Sn–Co alloy, SnS2, etc) have been regarded as one of the most promising replacements of graphite anodes.2–5 For example, the recently announced Sony Nexelion™ battery, which adopts amorphous Sn–Co–C composites as anode materials, increases the overall capacity by 30% compared to graphite anode batteries.As the most intensively studied tin-based anode materials, SnO2 has been considered as an ideal graphite substitute owing to its high theoretical capacity (781 mAh g−1) and safety.6–11 However, the practical application of SnO2 anodes has been frustrated by their poor cycling performance due to the large volume expansion–contraction (∼300%) during the charge–discharge process. Various SnO2 nanostructures, especially hollow nanostructures having large surface areas and short solid-state diffusion lengths, have been designed to improve their electrochemical performance to a large extent.7–11 However, stability of these SnO2 nanostructures remains an existing issue. The breaking down of these nanostructures upon cycling often causes considerable capacity fading. Recently, extensive work has been focused on the synthesis of SnO2-based hybrid nanostructures by introducing “buffering matrixes”, such as CoO reticular films,12 porous Cu sheets,13CuO nanotubes,14 and etc,15–24 to preserve the nanostructures of SnO2 anodes during cycling. Among various buffering matrixes, carbon has been proved to be the most promising choice primarily due to its excellent buffering effect and high electronic conductivity.15–24 Therefore, hollow SnO2–C hybrid nanostructures, which integrate both a nanostructure and carbon matrix design of electrode materials, are expected to show the improved electrochemical performance.
Up to now, several hollow SnO2–C hybrid nanostructures have been prepared with markedly improved electrochemical performance compared to pure SnO2 nanostructures.22–24 However, the synthetic approaches often involve multiple steps, which usually include the preparation of hollow carbon22 (or SnO223,24) nanostructures first and subsequent depositing of SnO2 (or carbon) layer. Carbon and SnO2 components are introduced into the hybrid nanostructures separately. In addition, hard templates such as silica are needed for the formation of hollow carbon22 or SnO224nanostructures, which restricts their mass production. It's desirable to obtain hollow SnO2–C nanostructures through more facile and economic processes.
Herein, we report the synthesis of SnO2–C nanotubes through a simple glucose hydrothermal approach by using Sn nanorods as sacrificial templates. This nanostructure has been obtained through a single reaction, in which the formation of SnO2 nanotubes and carbonaceous layer are both included. Moreover, the as-synthesized SnO2–C nanotubes have been applied as anode materials for lithium-ion batteries, which exhibit improved cyclic performance compared to pure SnO2 nanotubes.
Experimental
Synthesis of SnO2–C nanotubes
All the chemicals were analytical grade without further purification. Sn nanorods were prepared by a simple reaction between SnCl4, NaBH4 and poly(diallyldimethylammonium chloride) (PDDA) at room temperature as reported in our previous paper.25 SnO2–C nanotubes were prepared by a glucose hydrothermal process and subsequent carbonization approach. Briefly, 0.1 g Sn nanorods were dispersed in 40 ml 0.25 M aqueous glucose solution. After sonication for 20 min, the solution was transferred into a 50 ml Teflon-lined stainless steel autoclave, sealed, and maintained at 180 °C for 3 h. After the reaction was finished, the resulting brown solid products were centrifuged, washed with distilled water and ethanol to remove the ions possibly remaining in the final products, and then dried at 80 °C under vacuum. Finally, the brown products were kept in a tube furnace at 500 °C for 3 h under N2 at a ramping rate of 5 °C min−1.Characterization
The obtained samples were characterized by X-ray powder diffraction (XRD) using a Rigaku D/max-ga X-ray diffractometer with graphite monochromatized Cu-Kα radiation (γ = 1.54178 Å). The morphology and structure of the samples were examined by transmission electron microscopy (TEM, JEM-200 CX, 160 kV), high-resolution transmission electron microscopy (HRTEM, JEOL JEM-2010) and field emission scanning electron microscopy (FESEM, Hitachi S-4800) with energy-dispersive X-ray spectrometer (EDX). Thermogravimetric analysis (TGA) was tested on SDT Q600 V8.2 Bulid 100.Electrochemical measurements of SnO2–C nanotubes
Electrochemical measurements were carried out using two-electrode cells with lithium metal as the counter and reference electrodes. The working electrodes were composed of the active material (SnO2–C nanotubes), conductive materials (acetylene black, AB), and binder (polyvinyldifluoride, PVDF) in a weight ratio of SnO2–C nanotubes/AB/PVDF = 80![[thin space (1/6-em)]](https://www.rsc.org/images/entities/char_2009.gif) :
:![[thin space (1/6-em)]](https://www.rsc.org/images/entities/char_2009.gif) 10
10![[thin space (1/6-em)]](https://www.rsc.org/images/entities/char_2009.gif) :
:![[thin space (1/6-em)]](https://www.rsc.org/images/entities/char_2009.gif) 10, and pasted on Cu foil. The electrolyte solution was 1 M LiPF6 dissolved in a mixture of ethylene carbonate (EC), propylene carbonate (PC), and diethyl carbonate (DEC) with the volume ratio of EC/PC/DEC = 3
10, and pasted on Cu foil. The electrolyte solution was 1 M LiPF6 dissolved in a mixture of ethylene carbonate (EC), propylene carbonate (PC), and diethyl carbonate (DEC) with the volume ratio of EC/PC/DEC = 3![[thin space (1/6-em)]](https://www.rsc.org/images/entities/char_2009.gif) :
:![[thin space (1/6-em)]](https://www.rsc.org/images/entities/char_2009.gif) 1
1![[thin space (1/6-em)]](https://www.rsc.org/images/entities/char_2009.gif) :
:![[thin space (1/6-em)]](https://www.rsc.org/images/entities/char_2009.gif) 1. The cell assembly was performed in a glovebox filled with pure argon (99.999%) in the presence of an oxygen scavenger and a sodium-drying agent. The electrode capacity was measured by a galvanostatic discharge–charge method at a current density of 100 mA g−1 in the potential range of 0.01–2 V at 20 °C. Cyclic voltammetry (CV) were recorded on a MSTAT4 (Arbin Instruments) system in the potential range of 0.0–2.0 V at a scan rate of 0.1 mV s−1.
1. The cell assembly was performed in a glovebox filled with pure argon (99.999%) in the presence of an oxygen scavenger and a sodium-drying agent. The electrode capacity was measured by a galvanostatic discharge–charge method at a current density of 100 mA g−1 in the potential range of 0.01–2 V at 20 °C. Cyclic voltammetry (CV) were recorded on a MSTAT4 (Arbin Instruments) system in the potential range of 0.0–2.0 V at a scan rate of 0.1 mV s−1.
Results and discussion
SnO2–C nanotubes were synthesized through a simple glucose hydrothermal and subsequent carbonization approach, in which Sn nanorods were used as sacrificial templates. The synthetic procedure of SnO2–C nanotubes is schematically illustrated in Fig. 1. After a glucose hydrothermal process, Sn nanorods have converted to glucose-derived carbon-rich polysaccharide (GCP) coated SnO2 nanotubes. Subsequently, the GCP layer is fully carbonized to a carbon layer under an inert atmosphere, resulting in SnO2–C nanotubes.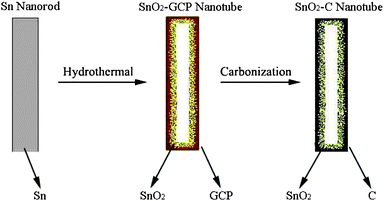 | ||
| Fig. 1 Schematic illustration for the synthesis of SnO2–C nanotubes. | ||
The crystallographic structure of the products was characterized by XRD (Fig. 2). It can be seen from the curves a and b, the crystalline phase can be assigned to tetragonal Sn (JCPDS: 04-0673) and SnO2 (JCPDS: 41-1445), respectively, indicating the phase transformation during the hydrothermal process. It's known that the GCP layer can be carbonized at a temperature higher than 400 °C.26 In addition, carbothermal reduction of SnO2 to metallic Sn is reported to take place at 600 °C.19,26 Herein, SnO2–C nanotubes were obtained when the SnO2-GCP nanotubes were carbonized at 500 °C, which can be verified from the curve c. However, when the carbonization temperature was increased to 550 °C (curve d), a mixed phase of SnO2 together with SnO and Sn appears, revealing the partial reduction of SnO2.
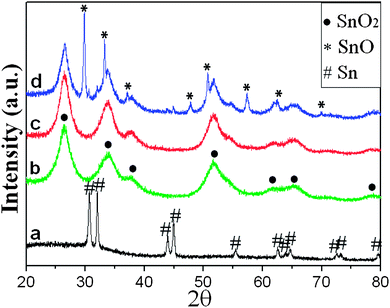 | ||
| Fig. 2 XRD patterns of Sn nanorods (curve a), SnO2-GCP nanotubes (curve b), and the products when SnO2-GCP nanotubes are carbonized at 500 °C (curve c) and 550 °C (curve d). | ||
The morphology, structure and composition of the as-synthesized SnO2–C nanotubes were further characterized by TEM and EDX. Fig. 3a and 3b display the TEM images of the Sn nanorods and SnO2–C nanotubes, respectively. It can be seen that the SnO2–C nanotubes have a tube-like morphology with continuous carbon layer, which is different from the rod-like morphology of sacrificing Sn nanorods. During the hydrothermal process, the Sn nanorods were oxidized to SnO2 by oxygen dissolved in water which was accompanied by a nanoscale Kirkendall effect, yielding the hollow structures rather than solid nanorods.27 Meanwhile, a GCP layer was formed and gradually deposited on the SnO2 nanotubes with increasing time, resulting in SnO2–GCP formation and subsequent SnO2–C nanotubes after carbonization. The magnified TEM image of a single SnO2–C nanotube (Fig. 3c) indicates that the carbon layer is smooth, continuous and the thickness of the layer is about 5–10 nm. It has been noted that nanostructures synthesized based on the nanoscale Kirkendall effect are often polycrystalline in nature.28 In our experiments, the SnO2 nanotubes also show a polycrystalline structure, which can be confirmed by its selected-area electron diffraction (SAED) pattern (Fig. 3c, inset). As observed, there are three diffraction rings corresponding to the (110), (101), and (211) planes of polycrystalline SnO2, respectively. Thus, the carbon precursor not only appears on exterior surfaces of SnO2 nanotubes, but also infiltrates into interspaces between polycrystalline nanoparticles and interior surfaces of SnO2 nanotubes, which is favorable for their application in lithium-ion batteries.23Fig. 3d reveals the EDX spectrum of SnO2–C nanotubes. As can be seen, the strong peaks for C, O, and Sn elements are expected from carbon layer and SnO2, respectively. The Cu peak comes from the sample stage used in the FESEM measurements. The HRTEM image (Fig. 3e) clearly reveals this novel nanostructure. As observed, the SnO2 tube consists of numerous homogeneous nanoparticles which are fully embedded in carbon matrix. As can be seen from the HRTEM image (Fig. 3f), there are two kinds of lattice fringes with lattice spacings of about 0.335 and 0.264 nm, corresponding to (110) and (101) planes of SnO2 nanoparticles, respectively, while the carbon layer is not well crystallized.
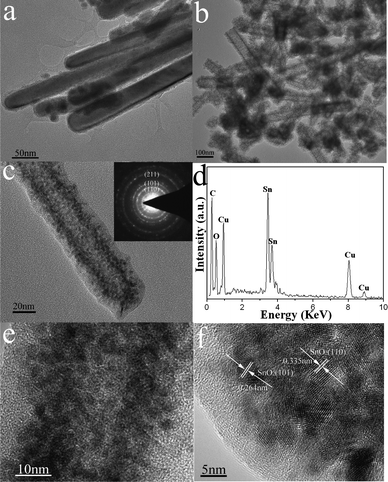 | ||
| Fig. 3 (a) TEM image of Sn nanorods and morphological, structural and compositional characterizations of SnO2–C nanotubes: (b) TEM image; (c) magnified TEM image and its SAED pattern (inset); (d) EDX spectrum; (e,f) HRTEM images. | ||
SnO2 nanotubes were obtained when the SnO2-GCP nanotubes were annealed in air at 500 °C. Fig. 4 shows the TEM images of the as-synthesized SnO2 nanotubes. As can be seen from Fig. 4a, most of the products maintain tube-like morphology, while the others break up into nanoparticles. Fig. 4b gives a magnified TEM image of a single SnO2 nanotube. As observed, the SnO2 nanotube is also composed of numerous nanoparticles, which is similar to the SnO2–C nanotube (Fig. 3c). However, the diameter of nanoparticles in SnO2 nanotubes (∼10 nm) is much larger than that of nanoparticles in SnO2–C nanotubes (∼5 nm). Therefore, the carbon layer can not only preserve the tube-like morphology, but also prevent particle growth due to Ostwald ripening during carbonization process. Moreover, TGA was performed to determine the carbon content in SnO2–C nanotubes. As shown in Fig. 5, the initial weight loss (up to 200 °C) is due to the evaporation of physically adsorbed water, while the weight loss between 200 and 600 °C could be attributed mainly to the removal of the carbon layer. Thus, the carbon content of SnO2–C nanotubes is determined to be about 31.5% by weight.
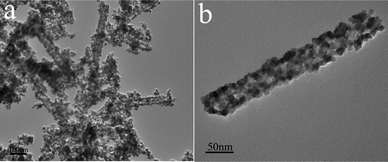 | ||
| Fig. 4 TEM images of pure SnO2 nanotubes. | ||
The as-synthesized SnO2–C nanotubes were used as potential anode materials for lithium-ion batteries. Fig. 6 shows the first three cyclic voltammogram (CV) curves of SnO2–C nanotubes electrodes in the potential range of 0.0–2.0 V at a slow scan rate of 0.1 mV s−1. In the first cycle, there are two characteristic pairs (cathodic, anodic) of current peaks at the potential of (0.76, 1.3 V) and (0.07, 0.57 V), respectively, which is in good agreement with the previous reported SnO2–C anodes.17–20 It is generally accepted that the electrochemical process of SnO2 anodes can be described by two principal reactions:
| SnO2 + 4Li+ + 4e− → Sn + 2Li2O | (1) |
| Sn + xLi+ +xe− ↔ LixSn (0 ≤ x ≤ 4.4) | (2) |
 | ||
| Fig. 6 The first three CV curves of SnO2–C nanotubes in the potential range of 0.0–2.0 V at a scan rate of 0.1 mV s−1. | ||
Herein, the cathodic peak at about 0.76 V could be ascribed to the formation of a solid electrolyte interface (SEI) layer, and reduction of SnO2 to Sn and Li2O which is given by the reaction (1). This process is believed to be irreversible. However, this cathodic peak, together with the anodic peak at 1.3 V, is still present in subsequent cycles, indicating partially reversibility of this reaction.17–20 In addition, the second pair of current peaks at (0.07, 0.57 V) could be attributed to the alloying and dealloying process described by the reaction (2), which is believed to be highly reversible. It is worth mentioning that the intensity of the anodic peak at 0.57 V gradually increases in the second and third cycles, possibly suggesting an activating process in SnO2–C nanotubes in the first several cycles.18
Fig. 7a displays the discharge–charge capacity versus cycle number for the SnO2–C anodes. For comparison, cycling performance of pure SnO2 nanotubes was also investigated under the same conditions (Fig. 7b). As can be seen, the SnO2–C anodes exhibit a high discharge capacity of 492.5 mAh g−1 after 30 cycles with a retention of 55.2% compared with the first reversible capacity. The discharge capacity of SnO2–C anodes after 30 cycles is slightly lower than those of previously reported SnO2–graphene29 (570 mAh g−1) and SnO2–carbon nanofibers (539.4 mAh g−1),30 but obviously higher than those of SnO2–carbon nanotubes (345 mAh g−1)31 and SnO2–C nanowire arrays (353 mAh g−1).32 After 50 cycles, the discharge capacity of SnO2–C anodes is about 400 mAh g−1, which is still higher than the theoretical capacity of graphite (372 mAh g−1). Moreover, the SnO2–C anodes display an initial Coulombic efficiency of 53.1% which is higher than that of pure SnO2 anodes (44.9%). As observed from Fig. 7b, the discharge capacity of the SnO2–C nanotubes (1504 mAh g−1) is smaller than that of the pure SnO2 nanotubes (1813.8 mAh g−1) in the first cycle due to the addition of carbon layer. However, the capacity of the pure SnO2 nanotubes decreases very fast during cycling. After 20 cycles, the value is only 240 mAh g−1, which is much lower than that of the SnO2–C nanotubes. Compared to the pure SnO2 nanotubes, the markedly improved electrochemical performance of the SnO2–C nanotubes can be attributed to the carbon matrix which has excellent buffering effect and high electronic conductivity.
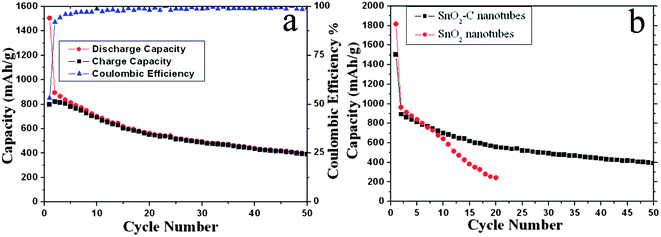 | ||
| Fig. 7 (a) Discharge and charge capacity versus cycle number for the SnO2–C nanotubes anodes at a current density of 100 mA g−1 in the potential range of 0.01–2 V at 20 °C; (b) Cycling performances of SnO2–C nanotubes and pure SnO2 nanotubes as anodes for lithium-ion batteries. | ||
Conclusions
In summary, we have synthesized a novel hollow SnO2–C nanostructure, SnO2–C nanotubes, through a simple glucose hydrothermal and subsequent carbonization approach by using Sn nanorods as sacrificial templates. The SnO2–C nanotubes exhibit an higher initial Coulombic efficiency and markedly improved cyclic performance compared to pure SnO2 nanotubes. The hollow nanostructure, together with the carbon matrix which has good buffering effect and high electronic conductivity, can be responsible for the improved cyclic performance.Acknowledgements
The authors would like to appreciate the financial supports from 973 Project (No. 2007CB613403), 863 Project (No. 2007AA02Z476), NSFC (No. 50802086), China Postdoctoral Science Foundation funded project (No. 20090461350).Notes and references
- J. Goodenough and Y. Kim, Chem. Mater., 2010, 22, 587 CrossRef CAS.
- A. D. W. Todd, P. P. Ferguson, M. D. Fleischauer and J. R. Dahn, Int. J. Energy Res., 2010, 34, 535 CrossRef.
- Y. Idota, T. Kubota, A. Matsufuji, Y. Maekawa and T. Miyasaka, Science, 1997, 276, 1395 CrossRef CAS.
- N. Tamura, M. Fujimoto, M. Kamino and S. Fujitani, Electrochim. Acta, 2004, 49, 1949 CrossRef CAS.
- J. Seo, J. Jang, S. Park, C. Kim, B. Park and J. Cheon, Adv. Mater., 2008, 20, 4269 CrossRef CAS.
- T. Brousse, R. Retoux, U. Herterich and D. M. Schleich, J. Electrochem. Soc., 1998, 145, 1 CAS.
- J. Liu, Y. Li, X. Huang, R. Ding, Y. Hu, J. Jiang and L. Liao, J. Mater. Chem., 2009, 19, 1859 RSC.
- C. Wang, Y. Zhou, M. Ge, X. Xu, Z. Zhang and J. Jiang, J. Am. Chem. Soc., 2010, 132, 46 CrossRef CAS.
- S. Han, B. Jang, T. Kim, S. M. Oh and T. Hyeon, Adv. Funct. Mater., 2005, 15, 1845 CrossRef CAS.
- N. Du, H. Zhang, J. Chen, J. Sun, B. Chen and D. Yang, J. Phys. Chem. B, 2008, 112, 14836 CrossRef CAS.
- N. Du, H. Zhang, B. Chen, X. Ma, X. Huang, J. Tu and D. Yang, Mater. Res. Bull., 2009, 44, 211 CrossRef CAS.
- X. J. Zhu, Z. P. Guo, P. Zhang, G. D. Du, R. Zeng, Z. X. Chen, S. Li and H. K. Liu, J. Mater. Chem., 2009, 19, 8360 RSC.
- W. Xu, N. L. Canfield, D. Wang, J. Xiao, Z. Nie and J. Zhang, J. Power Sources, 2010, 195, 7403 CrossRef CAS.
- C. Li, W. Wei, S. M. Fang, H. X. Wang, Y. Zhang, Y. H. Gui and R. F. Chen, J. Power Sources, 2010, 195, 2939 CrossRef CAS.
- H. Qiao, Z. Zheng, L. Zhang and L. Xiao, J. Mater. Sci., 2008, 43, 2778 CrossRef CAS.
- S. Chou, J. Wang, C. Zhong, M. M. Rahman, H. Liu and S. Dou, Electrochim. Acta, 2009, 54, 7519 CrossRef CAS.
- H. Liu, D. Long, X. Liu, W. Qiao, L. Zhan and L. Ling, Electrochim. Acta, 2009, 54, 5782 CrossRef CAS.
- J. S. Chen, Y. L. Cheah, Y. T. Chen, N. Jayaprakash, S. Madhavi, Y. H. Yang and X. W. Lou, J. Phys. Chem. C, 2009, 113, 20504 CrossRef CAS.
- X. W. Lou, J. S. Chen, P. Chen and L. A. Archer, Chem. Mater., 2009, 21, 2868 CrossRef CAS.
- B. Liu, Z. P. Guo, G. Du, Y. N. Nuli, M. F. Hassan and D. Jia, J. Power Sources, 2010, 195, 5382 CrossRef CAS.
- J. Liu, W. Li and A. Manthiram, Chem. Commun., 2010, 46, 1437 RSC.
- Y. Wang, F. Su, J. Y. Lee and X. S. Zhao, Chem. Mater., 2006, 18, 1347 CrossRef CAS.
- X. W. Lou, D. Deng, J. Y. Lee and L. A. Archer, Chem. Mater., 2008, 20, 6562 CrossRef CAS.
- X. W. Lou, C. M. Li and L. A. Archer, Adv. Mater., 2009, 21, 2536 CrossRef CAS.
- N. Du, H. Zhang, B. Chen, X. Ma and D. Yang, Chem. Commun., 2008, 3028 RSC.
- X. Sun, J. Liu and Y. Li, Chem. Mater., 2006, 18, 3486 CrossRef CAS.
- Y. Yin, R. M. Rioux, C. K. Erdonmez, S. Hughes, G. A. Somorjai and A. P. Alivisatos, Science, 2004, 304, 711 CrossRef CAS.
- J. Park, H. Zheng, Y. Jun and A. P. Alivisatos, J. Am. Chem. Soc., 2009, 131, 13943 CrossRef CAS.
- S. Park, E. Yoo and I. Honma, Nano Lett., 2009, 9, 72 CrossRef CAS.
- Z. Yang, G. Du, Z. Guo, X. Yu, S. Li, Z. Chen, P. Zhang and H. Liu, Nanoscale, 2010, 2, 1011 RSC.
- Z. Wen, Q. Wang, Q. Zhang and J. Li, Adv. Funct. Mater., 2007, 17, 2772 CrossRef CAS.
- N. Zhao, G. Wang, Y. Huang, B. Wang, B. Yao and Y. Wu, Chem. Mater., 2008, 20, 2612 CrossRef CAS.
| This journal is © The Royal Society of Chemistry 2011 |

