Superparamagnetic colloidal nanocrystal clusters coated with polyethylene glycol fumarate: a possible novel theranostic agent†
Houshang
Amiri
ab,
Morteza
Mahmoudi
*c and
Alessandro
Lascialfari
abd
aDepartment of Molecular Sciences Applied to Biosystems, Università degli Studi di Milano, I-20134, Milano, Italy
bDepartment of Physics “A. Volta”, Università degli Studi di Pavia, I-27100, Pavia, Italy
cNational Cell Bank, Pasteur Institute, Tehran, Iran. E-mail: mahmoudi@biospion.com; Web: www.biospion.com
dCentro S3, CNR-Istituto di Nanoscienze, I-41125, Modena, Italy
First published on 10th December 2010
Abstract
We report cell endocytosis, drug release, NMR relaxometry and in vitro MRI studies on a novel class of superparamagnetic colloidal nanocrystal clusters (CNCs) with various biocompatible coatings. It is shown that the transverse relaxivity r2, the parameter representing the MRI efficiency in negative contrast agents, for the PVA-coated, PEGF-coated, and crosslinked PEGF-coated CNCs, is high enough to contrast suitably the magnetic resonance images. The same samples have shown a good ability also in drug releasing (particularly the crosslinked PEGF-coated compound), thus finally allowing us to propose this class of compounds for future applications in theranostics.
1. Introduction
Due to its possibility of noninvasive, three-dimensional examination of biological events in living organisms and its capability to formulate diagnosis and follow treatments, magnetic resonance imaging (MRI) has been recognized as a powerful technique in medicine.1–4 In order to increase the contrast of the MRI images, which is essential for a better and more precise detection, contrast agents (CAs) can be used.5,6 The gadolinium chelates are the most common compounds used as CAs: they are characterized by a strong paramagnetism due to the seven unpaired electrons, thus giving a source of shortening of the longitudinal T1 and transverse T2 nuclear relaxation times. However, the recently acquired good control in the synthesis of superparamagnetic (SP) compounds5–7 gave new perspectives to the use of low-toxicity novel and possibly multifunctional CAs. The ideal multifunctional SP-based compound should be able to have applications not only in the MR Molecular Imaging but also in magnetic moving and separation, optical detection by fluorescence, magnetic hyperthermia (for local release of heat) and so on.7–10 In this regard, superparamagnetic iron oxide nanoparticles (SPIONs) are the most promising candidate, not only for their efficacy in enhancing magnetic resonance image contrast but also for their high biocompatibility.11,12 In order to increase the targeting ability of the SPIONs at cellular-/nanoscale (e.g. cells, protein and biomolecules), in recent years a big effort has been also done to label SPIONs with targeting molecules,13–15 in the direction of the so-called Molecular Imaging.SPIONs are commercially produced. Endorem® (by Guerbet Group, Feridex in the USA) is one of the most known commercial MRI contrast agents and it is constituted by a magnetic core (diameter ∼6 to 7 nm) of mixed γ-Fe2O3 and Fe3O4 oxides coated with dextran, giving a nanoparticle which has an average ∼150 nm hydrodynamic diameter. Despite the undoubtful efficacy of Endorem®, problems of reproducibility of the MR images are often encountered, possibly because the nanoparticles present high polydispersity and different batches of sample possess different mix of the two iron oxides. The limited reproducibility together with the necessity of obtaining systems with better controlled microscopic properties, motivated many research groups to synthesize new monodispersed SPIONs families.
A fundamental ingredient for using SPIONs in MRI is the high value of the saturation magnetization that induces the shortening of T2 and, consequently, a better contrast in the image.16,17 There are three ways for increasing the saturation magnetization of the nanoparticles i.e. the size enhancement, the uni-direction growth of magnetite nanoparticles and the synthesis of colloidal nanocrystal clusters (CNCs) starting from a collection of SPIONs.18 Increasing the size of nanoparticles enhances the saturation magnetization and a particular ability is requested to not generate an unstable colloidal dispersion of nanoparticles that easily can agglomerate, precipitate and provoke a possible embolization of the capillary vessels.7,19–21 On the other hand, it was shown that the polyvinyl alcohol (PVA) molecules act as a template in hot water (e.g. 70 °C), leading to the oriented growth of Fe3O4 nanorods;18 although the saturation magnetization of the prepared nanorods was significantly increased, these systems were not fully stable. In order to overcome the problem, post-synthesis process (e.g. freezing/thawing technique) should be applied to fabricate stable nanorods with rigid walls.
The CNCs approach allows creation of a very stable colloidal dispersion with high saturation magnetization and superparamagnetic properties.16 In addition, these CNCs have been used as colloidal photonic crystals with magnetically tunable stop bands covering the entire visible spectrum; they were prepared by hydrolyzing FeCl3 with the addition of a base agent (NaOH) at around 220 °C in a solution containing polyacrylic acid as a surfactant in diethylene glycol.16,22
Several synthesis methods for SPIONs have been suggested. However, due to their scale up capability and to the ability of controlling size, shape and surface characteristics, the chemical routes (co-precipitation, microemulsions, hydrothermal, solvent and solvent free thermal decomposition, sol–gel, polyol, sonochemical, and electrochemical deposition) are highly preferred by the scientific community.7,17 Among chemical routes, the co-precipitation is used widely due to its easy, efficient chemical pathway and the possibility to achieve both type of iron oxide nanoparticles i.e. magnetite (Fe3O4) and maghemite (γ-Fe2O3) through the forced hydrolysis of iron salt (i.e. Fe2+ and Fe3+) solutions (e.g. in deionized (DI) water) in the presence of the base. The main problem of the co-precipitation method is its poor size, shape and monodispersity control.23 In order to overcome the problem, Mahmoudi et al.19 employed a novel design of experimental methodology, in agreement also with the resulting 3-D response surfaces; it was shown that optimum regions for stirring rate and molarity could be obtained to synthesize coated SPIONs with desirable size, purity, magnetization and shape. It must be remarked that particles with diameter bigger than 50 nm are mainly captured by the reticuloendothelial system, making them suitable for, but confining themselves to, liver or spleen imaging/therapy.24
The aim of the present work is the synthesis and first efficiency tests for biomedical purposes of highly water dispersible and biocompatible coated magnetite CNCs (composed of several single magnetite crystallites approximately 5 nm in size) with high saturation magnetization and superparamagnetic properties, using an easy and optimized-co-precipitation method. The CNCs are coated with crosslinked poly(ethylene glycol)-co-fumarate (PEGF); the first use of this hydrogel on the surface of CNCs, which have the potential to decrease the protein interaction and to reduce the drug burst effect (i.e. quick release of drugs upon injection), has been reported by Mahmoudi and co-workers.25–27 The potentialities of the samples here investigated in drug release and MRI contrast are evidenced. As it will be shown, the obtained crosslinked-coated CNCs are ideal candidates for ‘theranostics’ (i.e. therapy and diagnostics applications with the same compound), tracing the pathway for targeted drug delivery and imaging.
2. Materials and methods
2.1. Materials
Iron salts (i.e. chloride) and sodium hydroxide (NaOH), with analytical grades, were purchased from Merck Inc. (Darmstadt, Germany) and used without further purification. Polyvinyl alcohol (Mw = 30![[thin space (1/6-em)]](https://www.rsc.org/images/entities/char_2009.gif) 000–40000) was obtained from Fluka. PEG diol (Mw 1 kDa), fumaryl chloride, calcium hydride and propylene oxide were all purchased from Aldrich (Milwaukee, MN, USA). Ammonium persulfate and methylene chloride (DCM) were obtained from Merck (Germany). Fumaryl chloride was purified by distillation at 161 °C under ambient pressure. Tamoxifen (TMX) and Doxorubicin (DOX) were obtained from Pharma Chemie Company (Tehran, Iran). Anhydrous DCM was obtained by distillation under reflux condition for 1 h in the presence of calcium hydride. Other solvents were reagent grades and used without any further purification.
000–40000) was obtained from Fluka. PEG diol (Mw 1 kDa), fumaryl chloride, calcium hydride and propylene oxide were all purchased from Aldrich (Milwaukee, MN, USA). Ammonium persulfate and methylene chloride (DCM) were obtained from Merck (Germany). Fumaryl chloride was purified by distillation at 161 °C under ambient pressure. Tamoxifen (TMX) and Doxorubicin (DOX) were obtained from Pharma Chemie Company (Tehran, Iran). Anhydrous DCM was obtained by distillation under reflux condition for 1 h in the presence of calcium hydride. Other solvents were reagent grades and used without any further purification.
2.2. Preparation of SPIONs
SPIONs were prepared via the well known co-precipitation method, which was optimized previously.19 Typically, iron salts (the mole fraction of Fe2+ to Fe3+ was adjusted to 1:2) were dissolved in DI water containing 0.5 M HCl and all solutions were deoxygenated by the bubbling process with argon gas. The magnetite nanoparticles were precipitated by dropwise addition of iron salt solutions to NaOH solutions (with various molarities) under an argon atmosphere. In order to control mass transfer, which may allow particles to combine and build larger polycrystalline particles, turbulent flow was created by placing the reaction flask in an ultrasonic bath and changing the homogenization rates during the first 2 minutes of the reaction.19 It is notable that the stirring rate was fixed at 9000 rpm for all samples in the synthesis period (1 h). Various molarities of the NaOH solutions (1, 2, 3, and 4) were examined. The obtained Fe3O4 nanoparticles were collected by external magnetic field and re-dispersed in DI water.
2.3. Preparation of PVA-coated SPIONs
PVA was dissolved in DI water and was added to the alkaline solution before introducing the iron salts. Then the method, which is given in Section 2.2, was employed in order to obtain coated nanoparticles.2.4. Preparation of PEGF
The Temenoff method was used for the preparation of PEGF macromer.28 Commonly, 0.03 mole of PEG diol was dissolved in 100 ml of anhydrous methylene chloride (DCM) in a three-necked 250 ml reaction flask equipped with a reflux condenser and a magnetic stirrer. Propylene oxide was employed as a catalyst for binding to the HCl, which is produced during the polymerization. The purified fumaryl chloride was dissolved in 50 ml of DCM and added dropwise in 1 h to the stirred reaction flask at −2 °C under nitrogen atmosphere. Consequently, the reaction temperature was enhanced to room temperature and run overnight. In order to remove the by-product (e.g. chlorinated propanols), the product was washed with 0.1 N NaOH several times. The PEGF macromer was then obtained by rotoevaporation, dried at 25 °C in vacuum for 24 h, and then stored at −15 °C until further use.2.5. Preparation of crosslinked-PEGF-coated SPIONs
The synthesis stages and parameters of PEGF were fully described in a previous report.26 The obtained PEGF solution was diluted in DI water and was added to the alkaline solution before introducing the iron salts. Then the method, which is given in Section 2.2., was employed in order to obtain coated nanoparticles. The coated-SPIONs were then collected by external magnetic field and re-dispersed in DI water in order to remove the unbounded polymers. The crosslinking of the unsaturated coating was started with ammonium persulfate [(NH4)2S2O8] as initiator system29 and an optimized amount of accelerator (DMAEMA)26via the redox polymerization. After stirring for 2 h, the particles were washed several times and were kept at 4 °C for future use. A schematic representation of the various synthesized magnetic nanoparticles is shown in Fig. 1. | ||
| Fig. 1 Schemes of the various synthesized magnetic nanoparticles including (a) single coated SPIONs, (b) crosslinked coated SPION, and (c) PVA- and crosslinked PEGF-coated CNCs. | ||
2.6. Drug loading of CNCs
Tamoxifen citrate (TMX), which is an anti-oestrogen drug for treatment of breast cancer,30 and doxorubicin (DOX), an anticancer drug which has therapeutic index of 1.2–1.4 and gives good activity on solid tumor,31 were selected as model drugs. The same amounts of PVA-, non-cross-linked PEGF- and cross-linked PEGF-coated CNCs, which are defined by atomic absorption, were dried in vacuum at 40 °C. Phosphate Buffered Saline (PBS) with pH of 7.4 containing 1 mg drug per ml was added to the dried CNCs and a stable colloidal suspension was formed by dispersion of the CNCs with both ultrasonic probe and homogenization. Due to their hydrogel properties, PVA and PEGF adsorbed the PBS containing drugs on their structures. After 10 h of incubation, the CNCs were collected using external magnetic field and re-dispersed in fresh PBS. In this case, the drug is going to be released from the polymeric shells due to their high-gradient concentration compared to the fresh PBS. Drug release data were collected for the duration of 200 and 300 hours for TMX and DOX, respectively. Two millilitre of each sample was centrifuged at selected times and the drug concentration was measured in the supernatant using an ultraviolet (UV) spectrometer (Milton Roy Spectronic 601) at 277 and 498 nm for TMX and DOX, respectively. The calibration curves of drugs were drawn and their concentrations in PBS solution were measured before and after interaction with CNCs by UV spectrometry, in order to define the approximated amount of drug which is adsorbed at the surface of the CNCs. Consequently, the differences between the obtained amounts were taken as drug uptake by the CNCs. All release and adsorption measurements were done in triplicates and the standard deviations calculated.2.7. Cell endocytosis assessments
Mouse fibroblast adhesive cells (L929) were obtained from the National Cell Bank of Iran (NCBI) at the Pasteur Institute of Iran. The seeded-cells (after 24 h) cultured in DMEM (Gibco, USA) supplemented with 10% fetal bovine serum (FBS) (Gibco, USA) and 1% streptomycin–penicillin (Gibco, USA) at 37 °C in a 5% CO2 atmosphere were exposed to the surface-saturated32 PVA-coated CNCs and cross-linked PEGF-coated CNCs with the iron concentration of 100 µg ml−1; it is notable that the iron concentrations of various CNCs were defined and fixed by atomic absorption.2.8. Experimental methods
For the TEM analysis, the cells were fixed with 2.5% pentane-1,5-dial in a 0.1 M sodium cacodylate buffer (pH = 7.4) and post-fixed in 1% osmium tetroxide. After a final wash with the sodium cacodylate buffer, the specimens were dehydrated through a graded series of alcohol baths (30–100%) and then embedded in Epon resin. Ultrathin sections were cut using a Reichert-Jung Ultracut E ultramicrotome, transferred onto 200-mesh Cu TEM grids with formvar support film, and stained with uranyl acetate and lead citrate (see Fig. S2 in the ESI†). The samples were imaged with an FEI Tecnai 12 TEM equipped with a Gatan CCD Camera Model 792 at an accelerating voltage of 120 kV.
For the frequency range 10 kHz ≤ ν ≤ 10 MHz, the NMR data were collected with a Smartracer Stelar relaxometer using the Fast-Field-Cycling technique27 while for ν > 10 MHz a Stelar Spinmaster spectrometer has been employed. Standard radio frequency excitation sequences CPMG-like and saturation-recovery were applied to determine T2 and T1 values, respectively.
3. Results and discussion
3.1. Electron microscopy and XRD characterizations of CNCs
TEM of the bare SPIONs showed uncoated SPIONs with a mean diameter of 5 nm in the absence of surfactants (Fig. 2a). By increasing the alkalinity of the solution (NaOH molarity from 1 to 4) in the presence of PVA, the magnetite nanoparticles spontaneously aggregate to form CNCs, as shown in the representative TEM images in Fig. 2b–e. It is noted that the single coated SPIONs were formed in the lowest base molarity (i.e. 1). According to the TEM images, these monodisperse PVA-coated CNCs consist of superparamagnetic magnetite nanoparticles with size of 5 nm. The hydrodynamic size of the obtained monodispersed CNCs is about 50 nm and increases by simply increasing the molarity of NaOH while keeping all the other parameters fixed. The same behavior was detected for the CNCs which were synthesized by using a high-temperature hydrolysis reaction in the presence of polyacrylic acid.16,22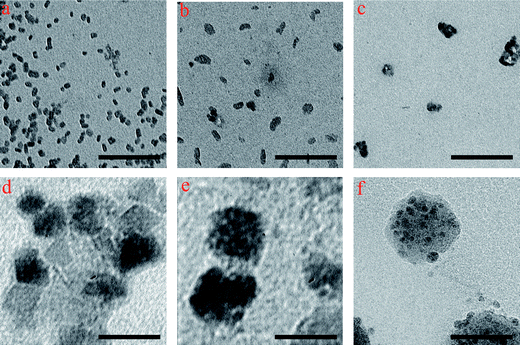 | ||
| Fig. 2 TEM images of (a) the bare SPIONs, and magnetite CNCs obtained from the solutions with the molarity of (b) 1, (c) 2, (d) 3, and (e) 4 in the presence of PVA; (f) TEM image of the crosslinked-PEGF coated CNCs prepared from the solution with the molarity of 4. The scale bar is 50 nm. | ||
In order to define the polydispersity of the various coated SPIONs, we calculated the variance over 20 particles in the TEM images using the standard formula (data reported in Table 1).33
| Sample | Remark | Average size of magnetic cores measured by XRD/nm | Average hydrodynamic size measured by TEM/nm | Average hydrodynamic size measured by DLS/nm |
|---|---|---|---|---|
| a Since bare SPIONs are very eager to reduce their surface energy in the absence of surfactants, severe agglomeration may occur; hence, their DLS data are not reliable. | ||||
| Bare SPIONs | There was no surfactant in the synthesis medium | 5 | 5 (core size) ± 1.1 | —a |
| PVA-coated CNCs | Synthesis base molarity was 1 | 5 | 10.5 ± 1.7 | 12.5 |
| Synthesis base molarity was 2 | 4.5 | 21 ± 2.3 | 23 | |
| Synthesis base molarity was 3 | 5 | 33 ± 3.1 | 41.5 | |
| Synthesis base molarity was 4 | 4.5 | 48 ± 4.9 | 55.1 | |
| PEGF-coated CNCs | Polymeric shell has been cross-linked | 5 | 52 ± 5.6 | 56.5 |
It is well recognized that the saturation magnetization of the CNCs is enhanced by increasing their size; hence we employed the CNCs, which were synthesized in basic molarity of 4, for crosslinkable PEGF coating. TEM and SEM images of crosslinked magnetite CNCs revealed the existence of a rigid shell on the surface of iron oxide nanoparticle clusters (Fig. 2f). From Fig. 2f and 3a–f it can be concluded that PEGF has been crosslinked on the surface of the CNCs. The XRD patterns of the samples are illustrated in Fig. 4. The average size of the nanoparticles was calculated from the broadening of the XRD peaks (the full width at half maximum (FWHM) of the (311) reflection) using the Scherrer formula: d = 0.9λ/(w − w1) cos (θ), where d is the crystal diameter, w and w1 are the half-intensity width of the relevant diffraction peak and the instrument broadening, respectively, λ is the X-ray wavelength, and θ is the angle of diffraction. The XRD spectra for all samples match well with magnetite (Fe3O4, reference JCPDS No. 82-1533), indicating that the samples have a cubic crystal system.
 | ||
| Fig. 3 (a–e) TEM images of crosslinked PEGF-coated CNCs with various magnifications; (f) high resolution TEM showing the lattice fringes of single SPION core. | ||
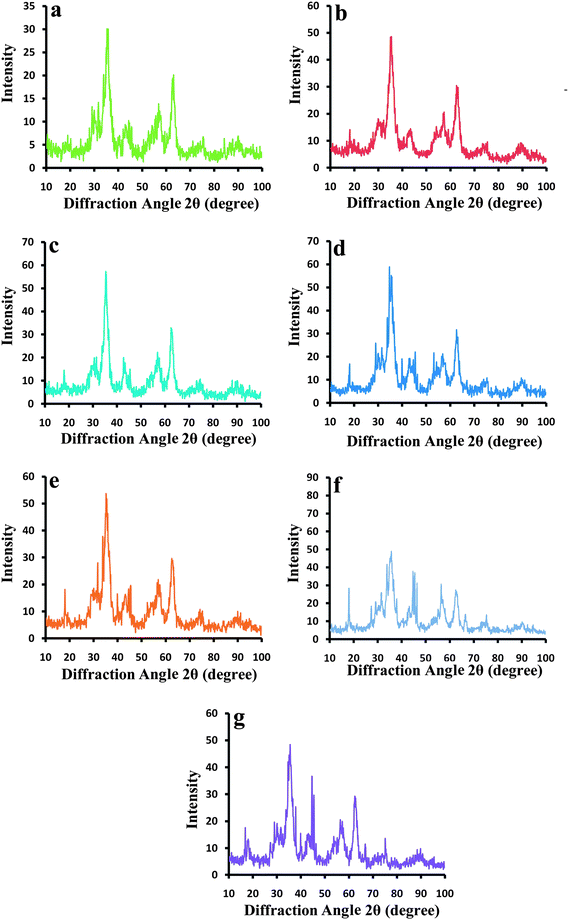 | ||
| Fig. 4 XRD patterns of (a) the bare SPIONs and the PVA coated CNCs obtained from the solutions with the molarity of (b) 1, (c) 2, (d) 3, and (e) 4; (f) and (g) XRD patterns of PEGF coated CNCs and crosslinked PEGF coated CNCs, respectively. | ||
3.2. Magnetic characterization of CNCs
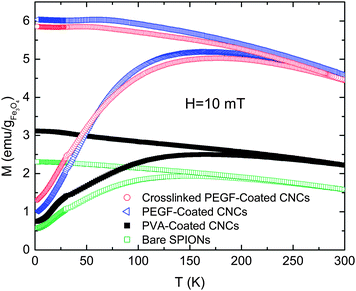 | ||
| Fig. 5 ZFC and FC magnetization measurements of dry powder of CNCs. The data are reported per gram of magnetite. | ||
In Fig. 6a and b the hysteresis curves, collected at T = 2 K and 300 K, are reported. The low temperature curves (Fig. 6a) are slightly open with small coercive fields in the range 53 mTesla < Hc < 57 mTesla and a small remanent magnetization, 5 emu per gFe3O4 < Mr < 17 emu per gFe3O4, while the high temperature ones (Fig. 2c) are not open, as observed for SPIONs and superparamagnetic CNCs with the dimensions of the magnetic core similar to our samples.20,21,37–41 The extracted data are given in Table 2.
| Compound | Bare SPIONs | PVA-coated CNCs | PEGF-coated CNCs | Crosslinked PEGF-coated CNCs |
|---|---|---|---|---|
| T B/K | 148.54 | 166.54 | 161.26 | 178.34 |
| H c/mT | 53.8 | 56.1 | 53.0 | 54.9 |
| M r/emu per gFe3O4 | 5.31 | 7.16 | 16.27 | 14.73 |
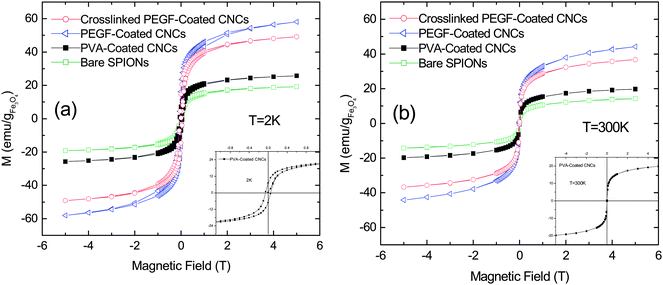 | ||
| Fig. 6 Magnetization vs. magnetic field at (a) 2 K and (b) 300 K for all the CNCs; the insets (with the same units) are zooms on the curves of PVA-coated CNCs. | ||
| ri = [(1/Ti)s − (1/Ti)d]/c (i = 1,2) | (1) |
Once r1 and r2 are measured as a function of frequency, the NMR-D profiles are obtained. The NMR-D profiles for all samples and for the commercial compound Endorem® are shown in Fig. 7a and b. Fig. 7a shows that the longitudinal relaxivity values of the PEGF-coated and the PVA-coated CNCs at very low frequencies are comparable with Endorem® while for higher frequencies all the samples have lower values. Fig. 7b shows that the transverse relaxivities of all the samples are approximately constant in the frequency range of study. The transverse relaxivities of PEGF-coated, PVA-coated, and crosslinked PEGF-coated CNCs are almost comparable to Endorem®. As the r2 value is the crucial parameter for a negative contrast agent (the higher r2, the better the MRI contrast), our samples can be in principle usefully employed in MRI.
 | ||
| Fig. 7 (a) Longitudinal r1 and (b) transverse r21H NMR relaxivities vs. Larmor frequency for all CNCs together with the commercial CA, Endorem®. | ||
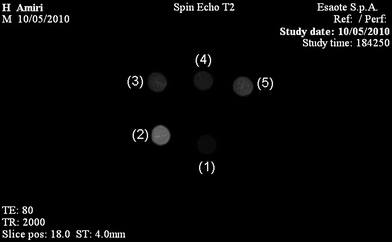 | ||
| Fig. 8 MRI image of vials containing different samples with the same iron concentrations (0.02 mg ml−1) obtained by Artoscan S.p.A. imager at H = 0.2 T. (1) Endorem®, (2) bare SPIONs, (3) PVA-coated CNCs, (4) PEGF-coated CNCs, (5) crosslinked PEGF-coated CNCs. Image parameters are given in the text. | ||
3.3. Cell endocytosis and drug release studies
Previous studies confirmed the biocompatibility of PVA- and PEGF-coated SPIONs using the 3-(4,5-dimethylthiazol-2-yl)-2,5-diphenyltetrazolium bromide (MTT) assay.26,27 Here, TEM was employed to investigate the possibility of entrance of the coated CNCs inside the L929 cells through a mechanism of uptaking induced by their hydrophilic and biocompatible coatings; the uptake of these CNCs are essential for the cellular drug delivery and imaging purposes. As shown in Fig. 9b and c, both the PVA-coated CNCs and cross-linked PEGF-coated CNCs accumulated within the cells. This is likely to be due to electrostatic interactions between the negatively charged membranes and the positively charged surface-saturated PVA-coated CNCs and cross-linked PEGF-coated CNCs (9.5 and 11 mV, respectively), resulting in the uptake of the CNCs by the cells. The TEM observations show that the CNCs were present in the membrane-bound multivesicular bodies, having entered the cells as larger aggregates. Little organelle damage following exposure to both the PVA-coated CNCs and crosslinked PEGF-coated CNCs is also evident. The level of damage in the cells exposed to the coated CNCs was negligible, confirming the biocompatibility of magnetic CNCs. The nuclei and organelles in the control cells remained intact. | ||
| Fig. 9 (a) TEM image of the control L929 cells. (b) TEM image of the L929 cells exposed to the PVA-coated CNCs. (c) TEM image of the L929 cells exposed to the cross-linked PEGF-coated CNCs. | ||
Fig. 10 illustrates drug releases from PEGF- and crosslinked PEGF-coated single nanoparticles, PVA-, PEGF- and crosslinked PEGF-coated CNCs over 12 days. According to the results, the crosslinking of the PEGF hydrogel caused a significant decrease in the burst effect not only for the coated CNCs but also for the single coated SPION; thus, as predicted, the crosslinked system has a great potential to control the burst effect even in this very simple drug loading system. Here, the drug was trapped in the crosslinked shell and consequently the barriers, for the reduction of the drug-gradient concentration, are gradually increased because of the existence of the crosslinked shell; hence its release (due to the lower diffusion process) has been kinetically controlled. More specifically, the TMX burst effect of the single PEGF coated SPIONs and PEGF coated CNCs reduced from 73% to 52% and from 61% to 41%, respectively. The crosslinked PEGF-coated CNCs have the lower burst effect compared to the single coated nanoparticles: the reason is the lower chemical activity of CNCs in comparison to single nanoparticle one. Additionally, PVA coated CNCs have a burst effect similar to non-crosslinked PEGF one. It should be noted that a better control over burst effect could be obtained using more sophisticated drug loading methods, like e.g. conjugating the drug to the crosslinked PEGF CNCs.
 | ||
| Fig. 10 Release profile of (a) TMX and (b) DOX from PEGF- and crosslinked PEGF-coated single nanoparticles; and PVA- (obtained by the base molarity of 4), PEGF- and crosslinked PEGF-coated CNCs over 300 and 200 hours, respectively. | ||
4. Conclusions
We have synthesized a class of PVA-, PEGF- and cross-linked PEGF-coated colloidal nanocrystals with a magnetic core of magnetite. In these systems the drug release can be obtained in a massive way. In addition, the efficiency of our systems as MRI contrast agents has been demonstrated by the relatively high values (almost comparable to the commercial compound Endorem®) of the 1H NMR transverse relaxivity r2 in the PEGF-coated, crosslinked PEGF-coated and PVA-coated CNCs, at frequencies of clinical application. This efficiency has been confirmed by MRI in vitro experiments. The ability of our PEGF-coated, PVA-coated and crosslinked PEGF-coated systems in both releasing drug and contrasting MR images, open the way to the synthesis of a well controlled novel class of theranostic agents.Acknowledgements
The SQUID and NMR/MRI experiments have been performed with the funds from PUR2008 project from Università degli Studi di Milano. M. Corti is gratefully acknowledged for his help in experimental measurements.References
- E. M. Haacke, R. W. Brown, M. R. Thompson and R. Venkatesan, in Magnetic Resonance Imaging. Physical Principles and Sequence Design, Wiley-Liss, 1999 Search PubMed.
- M. V. Yigit, D. Mazumdar and Y. Lu, Bioconjugate Chem., 2008, 19, 412–417 CrossRef CAS.
- J. Lee, M. J. Zylka, D. J. Anderson, J. E. Burdette, T. K. Woodruff and T. J. Meade, J. Am. Chem. Soc., 2005, 127, 13164–13166 CrossRef CAS.
- L. Frullano, B. Tejerina and T. J. Meade, Inorg. Chem., 2006, 45, 8489–8491 CrossRef CAS.
- See various contributions in The Chemistry of Contrast Agents in Medical Magnetic Resonance Imaging, ed. A. E. Merbach and E. Toth, J. Wiley and sons, 2001 Search PubMed.
- M. Mahmoudi, H. Hosseinkhani, M. Hosseinkhani, S. Broutry, A. Simchi, W. S. Journeay, K. Subramani and S. Laurent, Chem. Rev., 2010 DOI:10.1021/cr1001832.
- A. G. Roca, R. Costo, A. F. Rebolledo, S. Veintemillas-Verdaguer, P. Tartaj, T. Gonzalez-Carreno, M. P. Morales and C. J. Serna, J. Phys. D: Appl. Phys., 2009, 42, 224002 CrossRef.
- Q. A. Pankhurst, J. Connolly, S. K. Jones and J. Dobson, J. Phys. D: Appl. Phys., 2003, 36, R167–R181 CrossRef CAS.
- Q. A. Pankhurst, N. K. T. Thanh, S. K. Jones and J. Dobson, J. Phys. D: Appl. Phys., 2009, 42, 224001 CrossRef.
- C. C. Berry, J. Phys. D: Appl. Phys., 2009, 42, 224003 CrossRef.
- L. Josephson, J. Lewis, P. Jacobs, P. F. Hahn and D. D. Stark, Magn. Reson. Imaging, 1988, 6, 647–653 CrossRef CAS.
- M. Mahmoudi, S. Sant, B. Wang and T. Sen, Adv. Drug Delivery Rev., 2010 DOI:10.1016/j.addr.2010.05.006.
- N. Nitin, L. E. W. LaConte, O. Zurkiya, X. Hu and G. Bao, JBIC, J. Biol. Inorg. Chem., 2004, 9, 706–712 CAS.
- M. Lewin, N. Carlesso, C.-H. Tung, X.-W. Tang, D. Cory, D. T. Scadden and R. Weissleder, Nat. Biotechnol., 2000, 18, 410–414 CrossRef CAS.
- L. Josephson, C.-H. Tung, A. Moore and R. Weissleder, Bioconjugate Chem., 1999, 10, 186–191 CrossRef CAS.
- J. Ge, Y. Hu, M. Biasini, W. P. Beyermann and Y. Yin, Angew. Chem., 2007, 119, 4420–4423 CrossRef.
- M. Mahmoudi, M. A. Shokrgozar, A. Simchi, M. Imani, A. S. Milani, P. Stroeve, H. Vali, U. O. Hafeli and S. Bonakdar, J. Phys. Chem. C, 2009, 113, 2322–2331 CrossRef CAS.
- M. Mahmoudi, A. Simchi, M. Imani, P. Stroeve and A. Sohrabi, Thin Solid Films, 2010, 518, 4281–4289 CrossRef CAS.
- M. Mahmoudi, A. Simchi, M. Imani, A. S. Milani and P. Stroeve, J. Phys. Chem. B, 2008, 112, 14470–14481 CrossRef CAS.
- A. Boni, M. Marinone, C. Innocenti, C. Sangregorio, M. Corti, A. Lascialfari, M. Mariani, F. Orsini, G. Poletti and M. F. Casula, J. Phys. D: Appl. Phys., 2008, 41, 134021 CrossRef.
- M. Corti, A. Lascialfari, M. Marinone, A. Masotti, E. Micotti, F. Orsini, G. Ortaggi, G. Poletti, C. Innocenti and C. Sangregorio, J. Magn. Magn. Mater., 2008, 320, 316 CrossRef.
- J. Ge, Y. Hu and Y. Yin, Angew. Chem., Int. Ed., 2007, 46, 7428–7431 CrossRef CAS.
- S. Laurent, D. Forge, M. Port, A. Roch, C. Robic, L. Vander Elst and R. N. Muller, Chem. Rev., 2008, 108, 2064–2110 CrossRef CAS.
- M. Arruebo, R. Fernandez-Pacheco, M. R. Ibarra and J. Santamaria, Nano Today, 2007, 2, 22–32 CrossRef.
- M. Mahmoudi, M. Imani and A. Simchi, US Pat. pending, US12/723,646, 2010.
- M. Mahmoudi, A. Simchi, M. Imani and U. O. Hafeli, J. Phys. Chem. C, 2009, 113, 8124–8131 CrossRef CAS.
- M. Mahmoudi, A. Simchi, M. Imani, A. S. Milani and P. Stroeve, Nanotechnology, 2009, 20, 225104 CrossRef.
- J. S. Temenoff, H. Shin, D. E. Conway, P. S. Engel and A. G. Mikos, Biomacromolecules, 2003, 4, 1605–1613 CrossRef CAS.
- H. Park, J. S. Temenoff, Y. Tabata, A. Caplan and A. G. Mikos, Biomaterials, 2007, 28, 3217–3227 CrossRef CAS.
- V. C. Jordan, Br. J. Pharmacol., 2006, 147, S269–S276 CAS.
- A. Di Marco, M. Gaetani and B. Scarpinato, Cancer Chemother. Rep., 1969, 53, 33 Search PubMed.
- M. Mahmoudi, A. Simchi, M. Imani, M. A. Shokrgozar, A. S. Milani, U. Hafeli and P. Stroeve, Colloids Surf., B, 2010, 75, 300–309 CrossRef CAS.
- W. E. Biles and J. J. Swain, Optimization and Industrial Experimentation, Wiley, New York, 1980 Search PubMed.
- U. Jeong, X. Teng, Y. Wang, H. Yang and Y. Xia, Adv. Mater., 2007, 19, 33 CrossRef CAS.
- R. H. Kodama, J. Magn. Magn. Mater., 1999, 200, 359 CrossRef CAS.
- J. L. Dormann, D. Fiorani and E. Tronc, Magnetic Relaxation in Fine Particle Systems, in Advances in Chemical Physics, vol. XCVIII, ed. I. Prigogine and S. A. Rice, J. Wiley and sons, 1997 Search PubMed.
- L. Lartigue, K. Oumzil, Y. Guari, J. Larionova, C. GueLrin, J. L. Montero, V. Barragan-Montero, C. Sangregorio, A. Caneschi, C. Innocenti, T. Kalaivani, P. Arosio and A. Lascialfari, Org. Lett., 2009, 11, 2992 CrossRef CAS.
- M. F. Casula, P. Floris, C. Innocenti, A. Lascialfari, M. Marinone, M. Corti, R. A. Sperling, W. J. Parak and C. Sangregorio, Chem. Mater., 2010, 22, 1739 CrossRef CAS.
- E. Taboada, E. Rodriguez, A. Roig, J. Oro, A. Roch and R. N. Muller, Langmuir, 2007, 23, 4583 CrossRef CAS.
- U. I. Tromsdorf, N. C. Bigall, M. G. Kaul, O. T. Bruns, M. S. Nikolic, B. Mollwitz, R. A. Sperling, R. Reimer, H. Hohenberg, W. J. Parak, S. Forster, U. Beisiegel, G. Adam and H. Weller, Nano Lett., 2007, 7, 2422 CrossRef CAS.
- J.-F. Berret, N. Schonbeck, F. Gazeau, D. El Kharrat, O. Sandre, A. Vacher and M. Airiau, J. Am. Chem. Soc., 2006, 128, 1755 CrossRef CAS.
Footnote |
| † Electronic supplementary information (ESI) available: Preparation of SPIONs-treated cells for Bio-TEM. See DOI: 10.1039/c0nr00603c |
| This journal is © The Royal Society of Chemistry 2011 |