Comparative hydrolysis and plasma protein binding of cis-platin and carboplatin in human plasma in vitro†
Melani
Sooriyaarachchi
a,
Aru
Narendran
b and
Jürgen
Gailer
*a
aDepartment of Chemistry, University of Calgary, 2500 University Drive NW, Calgary, AB, T2N 1N4, Canada. E-mail: jgailer@ucalgary.ca; Fax: +1 403-289-9488; Tel: +1 403-210-8899
bAlberta Children's Hospital, Pediatric Oncology, 2888 Shaganappi Trail N.W., Calgary, AB T3B 6A8, Canada
First published on 6th December 2010
Abstract
Platinum-based anti-cancer drugs are widely used to treat cancer in patients, but they also exhibit severe toxic side-effects. Considering that cis-platin and carboplatin are intravenously administered, their biotransformations in the bloodstream are likely to be directly involved in determining their toxic side-effects, but they are poorly understood. We added pharmacologically relevant doses of cis-platin or carboplatin to human plasma from healthy male or female volunteers in vitro at 37 °C and determined the platinum-distribution in plasma after 5 min, 3 h and 24 h using size exclusion chromatography-inductively coupled plasma atomic emission spectrometry (SEC-ICP-AES). The results revealed a negligible inter-individual variation of the platinum-distribution between males and females and faster hydrolysis of cis-platin than carboplatin. Related to this, 95% of platinum was protein-bound 24 h after the addition of cis-platin to plasma, whereas 40% of platinum was protein-bound in the case of carboplatin. Interestingly, cis-platin and carboplatin-derived platinum species appeared to bind to the same 3 plasma proteins at the 3 h time point and thereafter. The analysis of cis-platin and carboplatin-spiked phosphate buffered saline (PBS) revealed a common platinum-containing hydrolysis product that was also detected in plasma. Since cis-platin is associated with more toxic side-effects in patients than carboplatin (even though it is administered at lower doses), our in vitro data suggest that the toxic side-effects of the investigated platinum-drugs may be predominantly determined by the indiscriminate translocation of the parent drugs to malignant and healthy cells. This information may help to mitigate the toxic side-effects of platinum-containing drugs by devising strategies to delay the influx of the parent drugs into non-target tissues.
Introduction
Platinum-based anti-cancer drugs, such as cis-platin and carboplatin (Fig. 1) are considered a mainstay for the treatment of cancer patients (adults and children), but a major limitation of these drugs is the toxicity that these drugs exert in healthy tissues.1 Approximately one-third of all cis-platin treated cancer patients, for instance, develop irreversible hearing loss.2 The development of new strategies to minimize the toxicity of these chemotherapeutic agents while leaving their antitumor activity uncompromised therefore represents a highly active area of research.1,3,4 After the intravenous administration of patients with platinum-drugs, the parent platinum-compound and the platinum-containing hydrolysis products that are generated in blood plasma are known to bind to several plasma proteins (Fig. 2).5 The in vitro addition of cis-platin to human serum from healthy subjects, for instance, was associated with a dramatic shift in the elution of platinum from the small (unchanged cis-platin) to the high molecular weight elution range over a 24 h-period.6 Interestingly, the toxic side-effects of platinum drugs differ dramatically depending on their structure,7 but little is known about the comparative hydrolysis and the subsequent binding of the platinum-containing metabolites to plasma proteins in plasma of healthy subjects8 and about dynamic changes in the platinum distribution among plasma proteins in plasma of cancer patients.5 Considering that the binding of cis-platin-derived entities to plasma proteins plays a role not only in the delivery of its toxic cargo to cancerous cells, but also in mediating their toxic side-effects in healthy cells,9 a better understanding of the plasma protein binding of platinum-based anticancer drugs may provide critical information in order to devise new strategies to ameliorate their toxic side-effects. The addition of sodium thiosulfate (STS) to whole blood, for instance, reduced the binding of cis-platin to plasma proteinsin vitro10 and studies which involved whole organisms demonstrated that STS can be used to reduce the toxic-side effects of platinum-based cancer drugs without reducing its antitumor activity in animal models11 and patients.12 It is therefore likely that the biochemical processes that occur after a platinum drug enters the bloodstream are critically involved in determining the toxic side effects that are observed in patients (Fig. 2). These processes are, however, incompletely understood.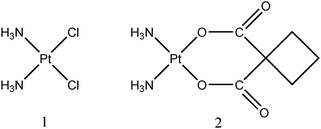 | ||
| Fig. 1 Molecular structure of cis-platin (1) and carboplatin (2). | ||
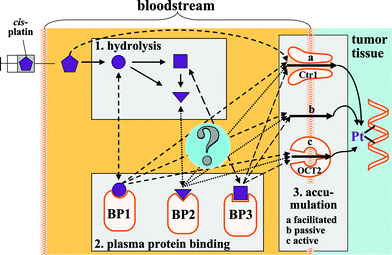 | ||
| Fig. 2 Conceptual depiction of the biochemistry of cis-platin after it is introduced into the mammalian bloodstream. Abbreviations: BP binding protein, Ctr1 Copper Transport Protein 1, OCT2 Organic Cation Transport Protein 2. | ||
In order to gain detailed insight into the aforementioned biotransformation of platinum-based anti-cancer drugs in the bloodstream in vitro, we employed a recently developed bioanalytical technique which allows to rapidly determine the major Cu, Fe and Zn-containing metalloproteins in mammalian blood plasma.13,14 This technique, however, also allows to probe the interaction of metal or metalloid-containing compounds with mammalian plasma proteins15 and has also been successfully applied to visualize the effect of the addition of iron chelation therapy drugs to human plasma at the metalloprotein level.16 Thus, this bioanalytical technique should be ideally suited to study the interaction of platinum-based anti-cancer drugs with human plasma. To this end, we have employed the developed SEC-ICP-AES method to compare the binding of cis-platin and carboplatin to plasma proteins after the addition of pharmacologically relevant doses to human plasma in vitro.
Experimental
Chemicals and solutions
Cis-platin (1 mg cis-Pt(NH3)2Cl2/mL; this solution also contained 1 mg mannitol and 9 mg NaCl; sterile) was obtained from Hospira (Montreal, QC, Canada) and carboplatin (10 mg cis-Pt(NH3)2C4H6(COO)2/mL) from Mayne Pharma (Montreal, QC, Canada). Phosphate-buffered saline buffer (PBS) tablets were purchased from Sigma-Aldrich (St. Louis, MO, USA) and the corresponding buffer (10 mM phosphate, 2.7 mM KCl, 137 mM NaCl, pH 7.4) was prepared by dissolving PBS tablets in the appropriate volume of water (followed by pH adjustment with dilute HCl). The obtained solution was filtered through 0.45 μm nylon-filter membranes (Mandel Scientific, Guelph, ON, Canada) before use. A mixture of protein standards which contained thyroglobulin (670 kDa), γ-globulin (158 kDa), ovalbumin (44 kDa), myoglobin (17 kDa), and vitamin B12 (1.35 kDa) was obtained from Bio-Rad Laboratories (Hercules, CA, USA) to calibrate the employed Superdex 200 SEC column. All solutions were prepared with water from a Simplicity water purification system (Millipore, Billerica, MA, USA).SEC-ICP-AES system
The SEC-ICP-AES system that was employed in the present study was comprised of a Smartline 1000 HPLC pump (Knauer, Berlin, Germany) and a Rheodyne 9010 PEEK injection valve (Rheodyne, Rhonert Park, CA, USA) which was equipped with a 0.5 mL PEEK injection loop (0.5 mL). A pre-packed Superdex™ 200 10/300 GL Tricorn™ high performance size-exclusion chromatography column (30 × 1.0 cm I.D., separates globular proteins between ∼600 and ∼10 kDa; GE Healthcare, Piscataway, NJ, USA) was used in conjunction with PBS-buffer and a flow rate of 1.0 mL min−1 (column temperature 22 °C). Simultaneous multielement-specific detection of C (193.091 nm), S (180.731 nm), P (213.618 nm), Cu (324.754 nm), Fe (259.940 nm), Zn (213.856 nm) and Pt (214.423 nm) in the column effluent was achieved with a Prodigy, high-dispersion, radial-view ICP-AES (Teledyne Leeman Labs, Hudson, NH, USA) at an Ar gas-flow rate of 19 L min−1, an RF power of 1.3 kW and a nebulizer gas pressure of 35 psi. A 7.0 min delay was implemented between injection and data acquisition based on the void volume (505 s/8.41 mL) that was determined by the injection of blue dextrane. The data acquisition window was 1700 s for cis-platin and 1300 s for carboplatin. The obtained raw data were imported into Sigmaplot 11 software and smoothed using a bisquare algorithm. The peak areas were determined using Sigmaplot 11 after baseline correction.Analysis of cis-platin/carboplatin spiked human plasma by SEC-ICP-AES
The collection of blood from humans was approved by the Calgary Conjoint Health Research Ethics Board (Approval No. E-21198) of the University of Calgary. A human plasma stock was prepared from blood that was collected from age-matched (age 28–41) male (n = 3) and female (n = 3) ∼ 12 h fasted and healthy volunteers into heparinized trace metal testing blood collection tubes (Greiner-Bio-One Vacuette™, NC, USA). After centrifugation at 1100 g (4 °C) for 10 min, the buffy coat was removed and the supernatant plasma was removed using a micropipette and pooled. Aliquots (3.0 mL) of this homogenous plasma stock were transferred to cryovials and stored at −30 °C. Plasma was thawed at room temperature for 45 min and incubated in a rotary shaker at 37 °C for 30 min before cis-platin or carboplatin was added. With regard to cis-platin 117 μL and with regard to carboplatin 70 μL of the corresponding stock solutions were added to 3.0 mL plasma. The final concentration was 0.04 mg cis-platin/mL and 0.23 mg carboplatin/mL plasma. The mixtures were maintained at 37 °C and samples were withdrawn for analysis by SEC-ICP-AES after 5 min, 3 h and 24 h. These time points were chosen in part according to previous studies6 and based on changes in the plasma protein binding of platinum that were observed over a 24 h period in preliminary experiments. All experiments were carried out in duplicate and representative chromatograms are presented.Analysis of cis-platin/carboplatin spiked PBS-buffer by SEC-ICP-AES
PBS (3.0 mL) was incubated at 37 °C for 10 min after which cis-platin (117 μL of corresponding stock solution) or carboplatin (70 μL of corresponding stock solution) was added. The obtained mixtures were maintained at 37 °C and samples were withdrawn for analysis by SEC-ICP-AES after 5 min, 3 h and 24 h.Quantification of human serum albumin and transferrin in plasma
Albumin was measured by a bromocresol purple spectrophotometric method on a Roche P-Modular clinical chemistry analyzer. Transferrin was measured with an immunoturbidometric immunosassay on a Roche Integra 800 analyzer. Albumin and transferrin were determined using the manufacturer's recommended method, reagents and calibrators, (Roche Diagnostics Canada, Laval, PQ).Results and discussion
Even though five platinum anticancer compounds are currently in clinical use to treat a large variety of cancers,17 severe side-effects often limit their use in patients.18 It is well known that the toxicity and the nature of the toxic side-effects of cis-platin and carboplatin differ considerably.19–21 The biomolecular basis of the toxic side-effects that are associated with cis-platin and carboplatin, however, are incompletely understood. Whereas some studies clearly indicate that the nephrotoxicity associated with cis-platin is based on biochemical events that occur inside the kidney,22 others have demonstrated that at least some toxic side-effects of cis-platin, carboplatin and oxaliplatin are based on biochemical processes that occur in the bloodstream, namely inside erythrocytes.23 Considering that all clinically used platinum-based anti-cancer drugs are intravenously administered,24 a better understanding of their biochemistry that unfolds in the bloodstream is likely to provide important information for the development of effective strategies to ameliorate some of the adverse side-effects currently associated with cis-platin and carboplatin. In principle and in the context of this study three separate biochemical events must be identified after a platinum-based anticancer drug is injected into the bloodstream, namely (a) its hydrolysis, (b) the binding of the parent drug and/or its hydrolysis products to plasma proteins, and (c) the uptake of the parent drug and/or its hydrolysis products (either free or protein-bound) into cancerous as well as healthy cells (Fig. 2).With regard to event (a), the hydrolysis of cis-platin gives rise to the aqua-adducts [PtClOH2(NH3)2]+ and [Pt(OH2)2(NH3)2]2+![[thin space (1/6-em)]](https://www.rsc.org/images/entities/char_2009.gif) 25 as well as other platinum-containing compounds, such as dimers and trimer complexes.24,26,27 The hydrolysis of cis-platin and carboplatin in mammalian plasma, however, is less well understood and it is presently unknown how many platinum-containing hydrolysis products are generated in vivo. Regarding event (b), it is known that some of the hydrolysis products of cis-platin bind to plasma proteins.6 In fact, a day after the rapid intravenous infusion of humans with this anticancer drug 65–98% of platinum in blood was protein-bound.10,28 Human serum albumin (HSA)—the most abundant plasma protein—is one plasma protein to which cis-platin-derived entities bind,28 but there is direct experimental evidence that other plasma proteins, such as transferrin are also involved.6,29–32 With regard to event (c), it is currently unknown which molecular cis-platin-derived platinum-species actually enters the target cells,3 but it is known that the integral membrane protein Ctr-1 (which is responsible for cellular Cu-uptake)3,33 and the organic cation transporter OCT2 as well as passive diffusion are likely involved (Fig. 2).34,35 The fact that cis-platin has also been demonstrated to bind to transferrin29–32 strongly suggests that this anticancer drug may also be able to enter cellsvia the transferrin receptor pathway.
25 as well as other platinum-containing compounds, such as dimers and trimer complexes.24,26,27 The hydrolysis of cis-platin and carboplatin in mammalian plasma, however, is less well understood and it is presently unknown how many platinum-containing hydrolysis products are generated in vivo. Regarding event (b), it is known that some of the hydrolysis products of cis-platin bind to plasma proteins.6 In fact, a day after the rapid intravenous infusion of humans with this anticancer drug 65–98% of platinum in blood was protein-bound.10,28 Human serum albumin (HSA)—the most abundant plasma protein—is one plasma protein to which cis-platin-derived entities bind,28 but there is direct experimental evidence that other plasma proteins, such as transferrin are also involved.6,29–32 With regard to event (c), it is currently unknown which molecular cis-platin-derived platinum-species actually enters the target cells,3 but it is known that the integral membrane protein Ctr-1 (which is responsible for cellular Cu-uptake)3,33 and the organic cation transporter OCT2 as well as passive diffusion are likely involved (Fig. 2).34,35 The fact that cis-platin has also been demonstrated to bind to transferrin29–32 strongly suggests that this anticancer drug may also be able to enter cellsvia the transferrin receptor pathway.
In an effort to better understand the biotransformations of platinum-based anticancer drugs in human blood plasma, we added pharmacologically relevant doses of cis-platin and carboplatin to human plasma which was obtained from healthy volunteers. Typical Pt-specific chromatograms that were obtained over a 24-h period after the addition of cis-platin to human plasma from a male volunteer are depicted in Fig. 3 (A corresponds to the results obtained for cis-platin and B to those for carboplatin). Average values of the peak areas of each detected Pt-peak (as percent of the total Pt area) for 3 males (as well as 3 females) are depicted in Table 1. At the 5 min time point ∼6.5% Pt was protein bound to 3 different proteins (peaks 1, 2 and 3 in Fig. 3A), ∼4.6% Pt eluted in the inclusion volume (peak 6 in inset of Fig. 3A) and ∼89% of Pt eluted after the inclusion volume (peak 7) as unchanged cis-platin. The latter was identified by the injection of a cis-platin standard (data not shown). Based on the elution of size calibration standards and considering the molecular weight of cis-platin, the latter was expected to elute in the inclusion volume (retention time ∼1300 s), but it eluted with a retention time of ∼1900 s. This retention behavior of cis-platin can be explained in terms of the interaction of this neutral species with the stationary phase by an as yet unknown mechanism and is in accord with previous observations on a closely related stationary phase (Superdex 75).6 A similar retention phenomenon has been observed for arsenous acid on a Sephadex G-10 stationary phase and PBS-buffer and is therefore not totally unexpected.36Pt peak 6 eluted ∼100 s after the inclusion volume, which suggests it to be a small molecular weight Pt-species. Based on previous studies regarding the hydrolysis of cis-platin and the binding of cis-platin-derived hydrolysis products to HSA,7,28Pt peak 6 (only detected at the 5 min and the 3 h time point) is tentatively identified as [PtClOH2(NH3)2]+. A fraction containing Pt peak 6 was analyzed by electrospray ionization mass spectrometry (ESI-MS) and atmospheric pressure chemical ionization mass spectrometry (APCI-MS), but did not give useful results (possibly because of the low concentration of the Pt species and the salt content of the collected fraction). At the 3 h time point ∼76% of Pt was protein bound (peaks 1, 2 and 3 in Fig. 3A), ∼8.2% of Pt eluted close to the inclusion volume (peak 5 and 6 in inset of Fig. 3A) and ∼16% of Pt eluted in form of cis-platin (peak 7). We note that Pt peak 5 was only detected at the 3 h time point and that this peak contained carbon as evidenced from the C-specific chromatogram (data not shown). These data suggest that this Pt-peak corresponds to a Pt-metabolite that is bound to small molecular weight peptides, which is in good accord with previous findings.37 24 h after the addition ∼95% of Pt was protein-bound (peaks 1, 2 and 3 in Fig. 3A), ∼4.6% of Pt eluted as peak 4 and no Pt eluted in form of cis-platin. The corresponding results that were obtained for plasma collected from female volunteers were virtually identical to those obtained for males (ESI: S1, Table 1).
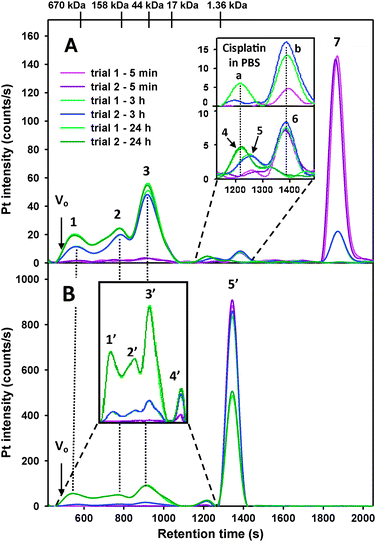 | ||
| Fig. 3 Representative Pt-specific chromatograms (2 replicates superimposed) obtained for the analysis of male human plasma (3.0 mL) spiked with (A) cis-platin (0.024 mg Pt/mL plasma) and (B) carboplatin (0.12 mg Pt/mL plasma). The mixture was incubated at 37 °C and samples were analyzed after 5 min (pink/purple), 3 h (light and dark blue) and 24 h (light and dark green) on a Superdex 200 10/300 GL SEC column (30 × 1.0 cm I.D., 13 μm particle size) at 22 °C using PBS buffer (0.15 M, pH 7.4) as the mobile phase. Flow rate 1.0 mL min−1, Injection volumn 500 μL, Detector: ICP-AES at 214.423 nm (Pt). The retention times of the molecular markers are depicted on top of the figure. | ||
| Incubation time | Peak number | Peak 1 | Peak 2 | Peak 3 | Peak 4 | Peak 5 | Peak 6 | Peak 7 | Total Pt area | Total C area |
|---|---|---|---|---|---|---|---|---|---|---|
| Retention time/s | 550 | 780 | 920 | 1220 | 1260 | 1380 | 1890 | |||
| 5 min | Male | 1.3 ± 0.1 | 1.6 ± 0.6 | 3.6 ± 0.12 | 0 | 0 | 4.6 ± 0.36 | 89 ± 0.6 | 13625 ± 214 |
18178312 ± 974900 |
| Female | 1.3 ± 0.2 | 1.8 ± 0.2 | 3.8 ± 0.16 | 0 | 0 | 5.1 ± 0.49 | 88 ± 1.1 | 13549 ± 1177 |
16342764 ± 1748963 |
|
| 3 h | Male | 10.1 ± 1.4 | 16.6 ± 3.1 | 49.4 ± 1.7 | 0 | 2.8 ± 0.2 | 5.4 ± 1.0 | 15.8 ± 1.9 | 13544 ± 370 |
17961617 ± 1066725 |
| Female | 10.2 ± 0.9 | 15.5 ± 1.8 | 48.5 ± 3.9 | 0 | 3.1 ± 0.7 | 5.8 ± 1.1 | 17.2 ± 1.4 | 13273 ± 825 |
16524088 ± 1719456 |
|
| 24 h | Male | 16.7 ± 1.9 | 23 ± 4.6 | 55.6 ± 5.4 | 4.7 ± 0.6 | 0 | 0 | 0 | 13570 ± 577 |
17602206 ± 840201 |
| Female | 17.6 ± 3.2 | 22.3 ± 2.6 | 55.9 ± 4.9 | 4.2 ± 0.6 | 0 | 0 | 0 | 12193 ± 1757 |
16300576 ± 1020184 |
The Pt-specific chromatograms that were obtained 5 min after the addition of carboplatin to human plasma from a male donor revealed no protein-bound platinum (Fig. 3B). However, ∼0.5% of Pt eluted in a peak essentially eluting in the inclusion volume (peak 4′) and >99.5% of Pt eluted as carboplatin (peak 5′), which was identified by the injection of a carboplatin standard (data not shown, Table 2). Based on the elution of size calibration standards and considering the molecular weight of carboplatin, the latter was expected to elute with a retention time of ∼1300 s, which it did. The strikingly different chromatographic retention behavior of carboplatin (Fig. 3B, peak 5′) compared to cis-platin (Fig. 3A, peak 7) must be attributed to the different structures of these Pt-compounds (Fig. 1) which, in turn, determines their interaction with the stationary phase. At the 3 h time point ∼7% of Pt was protein-bound (peaks 1′, 2′ and 3′ in Fig. 3B), ∼2% of Pt eluted in the inclusion volume (peak 4′) and ∼91% of Pt eluted as unchanged carboplatin (peak 5′). 24 h after the addition ∼40% of Pt was protein-bound (peaks 1′, 2′ and 3′ in Fig. 3B), ∼3% of Pt eluted in the inclusion volume (peak 4′) and ∼57% of Pt eluted as unchanged carboplatin (peak 5′). The results that were obtained for plasma collected from females were very similar (ESI: S1, Table 2).
| Incubation time | Peak number | Peak 1′ | Peak 2′ | Peak 3′ | Peak 4′ | Peak 5′ | Total Pt area | Total C area |
|---|---|---|---|---|---|---|---|---|
| Retention time/s | 550 | 780 | 920 | 1220 | 1340 | |||
| 5 min | Male | 0 | 0 | 0 | 0.54 ± 0.08 | 99.4 ± 0.08 | 59568 ± 5711 |
16864178 ± 1443793 |
| Female | 0 | 0 | 0 | 0.58 ± 0.07 | 99.4 ± 0.07 | 63361 ± 5562 |
16576528 ± 1417470 |
|
| 3 h | Male | 1.44 ± 0.06 | 1.48 ± 0.44 | 3.89 ± 0.24 | 2.18 ± 0.44 | 90.8 ± 0.07 | 60997 ± 3881 |
17104899 ± 1643822 |
| Female | 1.39 ± 0.08 | 1.53 ± 0.36 | 3.56 ± 0.39 | 2.25 ± 0.47 | 91.3 ± 1.04 | 64790 ± 3728 |
16618272 ± 1371951 |
|
| 24 h | Male | 9.15 ± 2.07 | 10.2 ± 1.7 | 20.3 ± 0.7 | 2.9 ± 0.14 | 57.4 ± 2.95 | 58888 ± 7725 |
17281877 ± 1377219 |
| Female | 9.59 ± 0.78 | 9.82 ± 0.37 | 19.5 ± 1.5 | 2.8 ± 0.12 | 58.3 ± 0.51 | 60003 ± 8141 |
16962826 ± 1277297 |
The observed minimal inter-individual variation between the results obtained for the binding of cis-platin and carboplatin to plasma of males (N = 3) and females (N = 3) and the negligible differences between the results for males and females (Fig. 3, ESI: S1, Tables 1 and 2) is in general accord with the previously reported small inter-individual variation in the plasma protein binding of anticancer drugs in metabolically normal individuals.38 The determination of the concentrations of HSA and transferrin in the plasma samples revealed concentrations that were within the range of healthy individuals which eliminates the presence of pathological extremes among the volunteers [HSA in g L−1: 44.7 ± 2.1 (male), 43.0 ± 4.6 (female); Tf: 2.8 ± 0.6 (male), 2.3 ± 0.7 (female)]. Overall, however, the rate at with which each platinum compound (or their hydrolysis products) bound to plasma proteins was strikingly different between cis-platin and carboplatin (Table 1 and 2). After 3 h and in case of cis-platin, for instance, ∼76% of total platinum was protein-bound, whereas only ∼6.6% of total platinum was protein-bound in the case of carboplatin. At the 24 h time point, 95.5% of the total Pt was protein-bound after the addition of cis-platin, whereas only 39.3% of the total Pt was protein-bound in case of carboplatin. Despite the observed difference regarding the changes in the dynamic binding of cis-platin/carboplatin to plasma proteins over time (Fig. 3, ESI: S1), a superposition of the Pt-specific chromatograms at the 24 h time point clearly demonstrates that both platinum drugs appear to be bound to the same ∼3 plasma proteins (Fig. 4). The smallest plasma protein which bound Pt (Pt peak 3 and 3′) likely corresponds to HSA based on its retention time (slightly larger than the 44 kDa molecular weight standard), on its co-elution with Zn-HSA (Fig. 4) and based on previous studies.28 The shape of the Pt-peak which eluted before HSA (Pt peak 2 and 2′) indicates the presence of more than one Pt-binding protein and is tentatively identified as HSA multimers based on previous studies.28 The largest molecular weight plasma protein which contained bound Pt after the addition of cis-platin (Pt peak 1 and 1′; >670 kDa) may correspond to α2-macroglobulin based on their co-elution (Fig. 4). A similar co-elution of a Pt and a Zn-peak was obtained after the addition of carboplatin to plasma (data not shown).
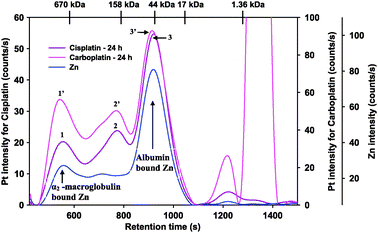 | ||
| Fig. 4 Superimposed Pt-specific chromatograms that were obtained 24 h after the addition of cis-platin or carboplatin to human plasma (from a healthy male volunteer) and incubated at 37 °C. Stationary phase: Superdex 200 10/300 GL (30 × 1.0 cm I.D., 13 μm particle size) SEC column (22 °C); Mobile phase: PBS buffer (0.15 M, pH 7.4); Flow rate: 1.0 mL min−1, Injection volume: 500 μL; Detector: ICP-AES at 214.423 nm (Pt) and 213.856 nm (Zn). The retention times of the molecular markers are depicted on top of the figure. The Zn-specific chromatogram was obtained after the addition of cis-platin. | ||
In order to rationalize the results depicted in Fig. 3 and Fig. S1 (ESI), we added identical amounts of cis-platin or carboplatin to PBS-buffer (at 37 °C) and analyzed the obtained mixtures by SEC-ICP-AES at the same time points as the plasma samples. The resulting Pt-specific chromatograms are shown in Fig. 5A (cis-platin) and in Fig. 5B (carboplatin). With regard to cis-platin and the 5 min time point, unchanged cis-platin corresponded to the most intense Pt-peak (retention time ∼1900 s), whereas a small Pt-peak (peak b) eluted at ∼1400 s. At the 3 h time point, the intensity of the peak corresponding to cis-platin was decreased, whereas that of peak b was increased (∼5-fold). At the 24 h time point, the intensity of the cis-platin peak had further decreased and that of peak b was slightly smaller than at the 3 h time point. Most importantly, however, an additional Pt-peak (peak a) eluted at ∼1200 s. 5 min after the addition of carboplatin to PBS-buffer, unchanged carboplatin corresponded to the most intense Pt-peak (retention time ∼1350 s), whereas a very small Pt-peak (peak c) eluted at ∼1200 s. At the 3 h time point, the intensity of the carboplatin peak was slightly decreased and the intensity of peak c had increased ∼3–4-fold. 24 h after the addition, the intensity of the carboplatin peak had further decreased and the intensity of peak c was slightly more pronounced than at the 3 h time point. Most importantly, peak c which was detected at the 5 min time point after the addition of carboplatin had the same retention time as peak a which was observed after the addition of cis-platin at the 24 h time point (Fig. 5, dotted line). Since the hydrolysis of cis-platin and carboplatin is known to eventually result in the formation of [Pt(OH2)2(NH3)2]2+,35,39,40 Pt-peaks a and c likely correspond to this platinum-species.
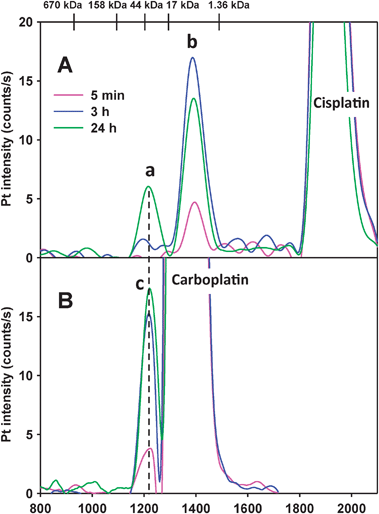 | ||
| Fig. 5 Pt-specific chromatograms obtained after the analysis of PBS-buffer (3.0 mL, pH = 7.4) incubated at 37 °C and spiked with (A) cis-platin (0.024 mg Pt/mL) and (B) carboplatin (0.12 mg Pt/mL). Stationary phase: Superdex 200 10/300 GL (30 × 1.0 cm I.D., 13 μm particle size) SEC column (22 °C); Mobile phase: PBS buffer (0.15 M, pH 7.4); Flow rate: 1.0 mL min−1, Injection volume: 500 μL; Detector: ICP-AES at 214.423 nm (Pt). The retention times of the molecular markers are depicted on top of the figure. | ||
Comparing the results for cis-platin in human plasma (Fig. 3A, ESI: Fig. S1) to those obtained after adding this platinum compound to PBS-buffer (Fig. 5A), it is evident that Pt-peak 6 eluted with an identical retention time as Pt-peak b (inset in Fig. 3A). Importantly, this finding indicates that the same hydrolysis product that is formed from cis-platin in PBS-buffer is also formed in human plasma. Based on the fact that this hydrolysis product is already present at the 5 min and the 3 h time point and absent at the 24 h time point in plasma, this Pt-species is identified as [PtClOH2(NH3)2]+. Similarly, Pt-peak 4 which was detected in plasma (inset in Fig. 3A) eluted with a similar retention time as Pt-peak a in PBS-buffer (Fig. 5A). Interestingly, both of these Pt-peaks were detected only at the 24 h time point, which indicates that the underlying chemistry is closely related. This Pt-peak is tentatively identified as [Pt(OH2)2(NH3)2]2+. We note that Pt-peak 5 was only observed in plasma (at the 3 h time point), but was not detected in PBS-buffer at any time point. The results that were obtained for carboplatin in human plasma demonstrate that Pt peak 4′ was detected at all time points (Fig. 3B, ESI: Fig. S1 and Table 2). The results for carboplatin in PBS-buffer revealed that Pt-peak c was detected at all time points (Fig. 5B). Owing to the similar retention times of these Pt-peaks, this Pt-species is identified as the known hydrolysis product [Pt(OH2)2(NH3)2]2+.39,40
Conclusion
The detailed biochemical reactions that unfold in vivo after patients are administered with platinum-based anticancer drugs with respect to their potential side-effects are incompletely understood. The addition of pharmacologically relevant doses of cis-platin or carboplatin to plasma from healthy male and female volunteers in vitro and the subsequent analysis of the obtained mixtures (after incubation at 37 °C) over a 24 h period with a recently developed bioanalytical method revealed minimal inter-individual variation between males and between females. In addition, striking differences in the dynamic plasma protein binding of these platinum-containing anticancer drugs over time were observed. Interestingly, the Pt-specific chromatograms that were obtained after the addition of cis-platin and carboplatin to human plasma resulted in ∼3 Pt-peaks that corresponded to proteins with similar retention times. Remarkably, some of the Pt-containing hydrolysis products that were detected in human plasma were also detected after the addition of cis-platin or carboplatin to PBS-buffer. This finding suggests that the biochemistry of the investigated platinum-based anticancer drugs in blood is largely determined by basic inorganic processes and the subsequent interaction of the formed hydrolysis products with plasma proteins. Based on these results, SEC-ICP-AES is identified as an ideal tool to study the effect of compounds which have been demonstrated to ameliorate some of the toxic side-effects of investigated platinum compounds in patients and animal models in vitro.10–12Acknowledgements
This research was funded by the University of Calgary (University Research Grant Committee grant No. F1031017002). Andrew W. Lyon is gratefully acknowledged for analyzing plasma samples for HSA and transferrin. AN is supported by grants form the Kids Cancer Care Foundation of Alberta (KCCFA) and the Alberta Children's Hospital Foundation.References
- B. W. Harper, A. M. Krause-Heuer, M. P. Grant, M. Manohar, K. B. Garbutcheon-Singh and J. R. Aldrich-Wright, Chem. Eur. J., 2010, 16, 7064–7077.
- Y. Li, R. B. Womer and J. H. Silber, Eur. J. Cancer, 2004, 40, 2445–2451 CrossRef CAS.
- D. Wang and S. J. Lippard, Nat. Rev. Drug Discovery, 2005, 4, 307–320 CrossRef CAS.
- S. van Zutphen and J. Reedijk, Coord. Chem. Rev., 2005, 249, 2845–2853 CrossRef CAS.
- R. Xie, W. Johnson, L. Rodriguez, M. Gounder, G. S. Hall and B. Buckley, Anal. Bioanal. Chem., 2007, 387, 2815–2822 CrossRef CAS.
- J. Szpunar, A. Makarov, T. Pieper, B. K. Keppler and R. Lobinski, Anal. Chim. Acta, 1999, 387, 135–144 CrossRef CAS.
- S. E. Sherman and S. J. Lippard, Chem. Rev., 1987, 87, 1153–1181 CrossRef CAS.
- D. N. Bell, J. J. Liu, M. D. Tingle, B. Rattel, T. U. Meyer and M. J. McKeage, Clin. Exp. Pharmacol. Physiol., 2008, 35, 1440–1446 CAS.
- E. Gamellin, M. Boisdron-Celle, A. Lebouil, A. Turcant, A. Cailleux, A. Krikorian, S. Brienza, E. Cvitkovic, F. Larra, J. Robert and P. Allain, Anti-Cancer Drugs, 1998, 9, 223–228 CAS.
- E. E. M. Brouwers, A. D. R. Huitema, J. H. M. Schellens and J. H. Beijnen, Anti-Cancer Drugs, 2008, 19, 621–630 CrossRef CAS.
- L. L. Muldoon, M. A. Pagel, R. A. Kroll, R. E. Brummett, N. D. Doolittle, E. G. Zuhowski, M. J. Egorin and E. A. Neuwelt, Clin. Cancer Res., 2000, 6, 309–315 CAS.
- S. B. Howell, C. L. Pfeifle, W. E. Wung, R. A. Olshen, W. E. Lucas, J. L. Yon and M. Green, Ann. Intern. Med., 1982, 97, 845–851 CAS.
- S. A. Manley, S. Byrns, A. W. Lyon, P. Brown and J. Gailer, JBIC, J. Biol. Inorg. Chem., 2009, 14, 61–74 CrossRef CAS.
- S. A. Manley and J. Gailer, Expert Rev. Proteomics, 2009, 6, 251–265 Search PubMed.
- K. L. Pei and J. Gailer, Metallomics, 2009, 1, 403–408 RSC.
- M. Sooriyaarachchi and J. Gailer, Dalton Trans., 2010, 39, 7466–7473 RSC.
- K. S. Lovejoy and S. J. Lippard, Dalton Trans., 2009, 10651–10659 RSC.
- V. Sahni, D. Choudhury and Z. Ahmed, Nat. Rev. Nephrol., 2009, 5, 450–462 Search PubMed.
- R. E. Sanborn, Curr. Treatm. Opt. Oncol., 2008, 9, 4–6 Search PubMed.
- R. Riccardi, A. Lasorella and R. Mastrangelo, in Cancer in Children: Clinical Management, ed. P. A. Voute, C. Kalifa and A. Barret, Oxford University Press, Oxford, 1998, pp. 44–59 Search PubMed.
- C. A. Rabik and M. E. Dolan, Cancer Treat. Rev., 2007, 33, 9–23 CrossRef CAS.
- R. Baliga, Z. Zhang, M. Baliga, N. Ueda and S. V. Shah, Kidney Int., 1998, 53, 394–401 CrossRef CAS.
- R. Mandal, R. Kalke and X.-F. Li, Chem. Res. Toxicol., 2004, 17, 1391–1397 CrossRef CAS.
- D. Esteban-Fernández, E. Moreno-Gordaliza, B. Canas, M. A. Palacios and M. M. Gómez-Gómez, Metallomics, 2010, 2, 19–38 RSC.
- K. J. Haxton and H. M. Burt, J. Pharm. Sci., 2009, 98, 2299–2316 CrossRef CAS.
- M. C. Lim and R. B. Martin, J. Inorg. Nucl. Chem., 1976, 38, 1911–1914 CrossRef CAS.
- K. W. Lee and D. S. J. Martin, Inorg. Chim. Acta, 1976, 17, 105–110 CrossRef CAS.
- A. I. Ivanov, J. Christodoulou, J. A. Parkinson, K. J. Barnham, A. Tucker, J. Woodrow and P. J. Sadler, J. Biol. Chem., 1998, 273, 14721–14730 CrossRef CAS.
- I. Khalaila, C. S. Allardyce, C. S. Verma and P. J. Dyson, ChemBioChem, 2005, 6, 1788–1795 CrossRef CAS.
- C. S. Allardyce, P. J. Dyson, J. Coffey and N. Johnson, Rapid Commun. Mass Spectrom., 2002, 16, 933–935 CrossRef CAS.
- D. Esteban-Fernández, M. Montes-Bayón, E. B. González, M. M. Gómez-Gómez, M. A. Palacios and A. Sanz-Medel, J. Anal. At. Spectrom., 2008, 23, 378–384 RSC.
- H. Sun, H. Li and P. J. Sadler, Chem. Rev., 1999, 99, 2817–2842 CrossRef CAS.
- D. Sinani, D. J. Adle, H. Kim and J. Lee, J. Biol. Chem., 2007, 282, 26775–26785 CrossRef CAS.
- S. S. More, O. Akil, A. G. Ianculescu, E. G. Geier, L. R. Lustig and K. M. Giacomini, J. Neurosci., 2010, 30, 9500–9509 CAS.
- A. V. Klein and T. W. Hambley, Chem. Rev., 2009, 109, 4911–4920 CrossRef CAS.
- J. Gailer and W. Lindner, J. Chromatogr., B: Biomed. Sci. Appl., 1998, 716, 83–93 CrossRef CAS.
- A. Perrera, H. Jackson, H. L. Sharma, C. A. McAuliffe and B. W. Fox, Chem.-Biol. Interact., 1992, 85, 199–213 CrossRef.
- A. Sparreboom, K. Nooter, W. J. Loos and J. Verweij, Neth. J. Med., 2001, 59, 196–207 CrossRef CAS.
- R. Gust and B. Schnurr, Monatshefte für Chemie, 1999, 130, 637–644 CrossRef CAS.
- M. A. Allsopp, G. J. Sewell, C. G. Rowland, C. M. Riley and R. L. Schowen, Int. J. Pharm., 1991, 69, 197–210 CrossRef CAS.
Footnote |
| † Electronic supplementary information (ESI) available. See DOI: 10.1039/c0mt00058b |
| This journal is © The Royal Society of Chemistry 2011 |