DOI:
10.1039/C0MD00157K
(Review Article)
Med. Chem. Commun., 2011,
2, 91-105
Impact of ion class and time on oral drug molecular properties
Received
10th September 2010
, Accepted 13th October 2010
First published on 10th November 2010
Abstract
Using databases of oral drugs and recent compounds from the patents of major pharmaceutical companies, trends in molecular properties over time are identified. It is shown that the physical property profiles of oral drugs are not absolute, but depend on both ion class and the time of the drug invention. Properties examined include lipophilicity, molecular weight, hydrogen bond donors and acceptors, polar surface area, aromaticity, chirality and tetrahedral (sp3) carbon atom count. Lipophilicity is increasing over time in oral drugs that are neutral or acidic, but not in basic drugs, and has been converging in all ion classes towards a common constant range since the 1960s. In contrast, molecular weight is increasing over time in all ion classes. Hydrogen bond donors (OH + NH group count) are stable over time but hydrogen bond acceptors (O + N atom count) are increasing over time. It is shown that measures using sp3 atom and aromatic atom counts are inversely related and a new parameter, Ar atom count – sp3 atom count (Ar-sp3), describing shape or aromatic/aliphatic balance, is introduced. Ar-sp3 is constant over time in oral drugs, but is higher in patented compounds, independently of molecular weight and lipophilicity. The ion classes in patent compounds occupy distinct molecular weight/lipophilicity/shape chemical space. These properties are significantly increased versus oral drugs, with the exception of the most recently discovered acidic drugs, and occur in most, but not all target classes. While ceilings for lipophilicity in acids and neutral compounds may not have been reached, the design of potential drug molecules with reduced ADMET risk is indicated by a seeking a better balance between lipophilicity, 3-dimensionality and aromaticity.
Introduction
A significant body of evidence suggests that marketed drugs occupy distinct regions of physicochemical space.1,2,3,4 In addition, the overall distributions of size (molecular weight, Mol Wt) and lipophilicity (calculated 1-octanol-water partition coefficient, cLogP) of oral drugs differ from research compounds and clinical candidates.2,5,6,7,8 Both Mol Wt and cLogP increase in the order: research compounds > clinical candidates > drugs, but why is this? There are two major factors to consider: first, the drug discovery climate, capability and standards that existed at the time of the invention; and second, the pressures of the overall drug development processes and post-marketing surveillance, which ultimately remove compounds with compromised properties. Both elements have advanced scientifically and become more selective in decision making over recent decades, in response to the need for more effective, safer and cheaper drugs, together with a more demanding regulatory environment. These changes, and ever-increasing attrition rates,9 have placed enormous pressures on the pharmaceutical industry.10,11 Current drug discovery chemistry, driven by an expanding repertoire of useful synthesis methodology, is increasing patented compound physical properties,5 but this is accompanied by empirical increased risks to absorption, distribution, metabolism, excretion and toxicity (ADMET) properties.12–15 The risks to permeability and metabolic stability13,14 gradually increase as molecular weight and lipophilicity increase towards the boundaries proposed by the rule of 5.1 Nevertheless, as these new molecules enter drug development, the profile of successful drugs may change further in future.16 For these reasons, it is important to evaluate the progression of drug-like properties over time. Earlier studies have addressed this issue with oral drugs, using the rule of 51 and related properties. The results4,5,17 showed increases over time in Mol Wt and hydrogen bond acceptors (HBA), but much less so in LogP, %polar surface area (%PSA) and hydrogen bond donors (HBD). We previously proposed17 that those drug-like physicochemical properties that are changing least over time (polar/nonpolar balance and HBD) are more important success factors than those properties that are changing more rapidly (size measures and HBA).
An extensive body of evidence suggests that the ionisation state of a compound has a major impact on its expected ADMET properties.12,18 Thus, acids have higher plasma protein binding19,20,21 and consequently lower volumes of distribution22,23,24 than the other ion classes, and therefore require high metabolic stability for a tolerable in vivo half-life. The higher volume of distribution of bases favours an increased half life, but, relative to acids and neutrals, bases have increased toxicity risks25 due to receptor promiscuity,5,26 binding to the hERG channel,27 and induction of phospholipidosis.28 Neutrals, being non-ionised, are generally less soluble than acids or bases.12 Renal clearance29 and cytochrome P450 inhibition30 are also ion class dependent. For these reasons, the ion class of a molecule is a primary property to consider in lead compound selection and subsequent design of an optimization programme. Knowingly (or perhaps less knowingly with older drugs), drug physical properties should reflect ion class ADMET characteristics. We therefore decided to test the ‘time stable’ property hypothesis,17 and to extend earlier studies,1–8 by examining the ion class physical properties of oral drugs over time. To estimate the full progression of practice, we compared all oral drugs, approved worldwide, with patented compounds from major Pharmaceutical Companies published in the period 2000–9. We also examine property differences between oral drugs and patent compounds by target class and look at compliance with recently published empirical ADMET guidelines.12,15
In addition to well-precedented molecular properties used previously, we added aromatic atom counts,31 sp3/total carbon fraction (sp3/C),32 and chiral atom counts,32 all recently shown to differ between development compounds and marketed drugs. Aromatic ring count reduced in the GlaxoSmithKline pipeline from 3.3 at candidate selection to 2.3 by proof of concept, compared to 1.6 in oral drugs. Aromatic ring count correlated positively with LogP and LogD (distribution coefficient between COMPOUND LINKS
Read more about this on ChemSpider
Download mol file of compound1-octanol and pH 7.4 buffer) and with developable parameters that are also LogP/D dependent, including albumin binding, hERG inhibition and cytochrome p450 3A inhibition.31 The parameter sp3/C increases from research compounds (0.36) to approved drugs (0.47) and a higher fraction of drugs are chiral (0.64) versus research compounds (0.53).32 Taken together, the aromatic ring, sp3/C and chiral carbon trends suggest that less ‘flatness’ and more ‘3-dimensionality’ are important drug-like attributes. In this study, we also examined total aromatic and sp3 carbon atom counts, and related parameters, including ‘aromatic content,’ the fraction of aromatic atoms to heavy atoms (Ar/HA).33 Because the fractional terms Ar/HA and sp3/C are shown to be inversely related, the difference between aromatic and sp3 atom counts (Ar-sp3) is used as an alternative to both.
Data collection
We used our database of oral drugs, launched worldwide, updated to mid-2010 (2,056 compounds) and annotated with the year of first publication or patent from Scifinder or the Merck Index.5 The drugs were divided, for simplicity of analysis and ease of presentation, into similarly sized time groups: pre-1930 (n = 142); 1930–44 (n = 136); then into nine quincennial periods: 1945–9 (n = 110); 1950–54 (n = 144); 1955–9 (n = 223); 1960–4 (n = 302); 1965–9 (n = 235); 1970–4 (n = 218); 1975–9 (n = 163); 1980–4 (n = 140); 1984–9 (104); and finally post-1990 (n = 139). Patented compounds originating from 12 large Pharmaceutical Companies were collected from WO filings only, covering 2000–9 using Thomson Reuters’ Integrity database.34 This provided a total of 10,271 compounds (mostly one ‘lead’ per patent is selected by Thomson Reuters), by Company as follows: AstraZeneca (n = 1337); GlaxoSmithKline (n = 1402); Merck (n = 1519); Pfizer (n = 1222); Abbott (n = 392); Bristol-Myers Squibb (n = 689); Janssen (n = 581); Lilly (n = 406); Novartis (n = 615); Roche (n = 784); Sanofi-Aventis (n = 856); and Wyeth (n = 467). Target class designations followed from the target annotation provided by Integrity. Molecular properties including ionic class designation were calculated for each of the drug and patented compound groups, using established methodology.2,3,5 cLogD at pH7.4 was calculated as described35a and cLogP was calculated using Biobyte software.35b
Results and discussion
Ion class fraction
In the oral drugs set used there are 352 (17%) acids, 803 (39%) bases, 714 (35%) neutrals, 126 (6%) zwitterions and 61 (3%) cations. The ion class fractions have remained relatively constant since the early 1950s and are similar in current patented compounds (Fig. 1). The increase in zwitterions in 1980–4 and 1985–9 is due to COMPOUND LINKS
Read more about this on ChemSpider
Download mol file of compoundangiotensin converting enzyme inhibitors and COMPOUND LINKS
Read more about this on ChemSpider
Download mol file of compoundquinolone antibiotics; it is interesting that other targets have not exploited zwitterions as much as these. The increased cations in the 1950s are predominantly due to quaternary cholinergic agents. Mean and percentile values of oral drugs by ion class are assembled in Table 1, together with their rank order by ion class. All properties show some significant differences between ion classes. Bases have the highest mean cLogP values and the rank order for cLogD values is neutrals > bases > acids. Zwitterions have, as might be expected, the highest mean H-bonding and PSA values, followed by acids, then neutrals and bases. Interestingly, acids have the highest Ar-sp3 values and fewest chiral centres. There are insufficient oral drug zwitterions or cations for full property analyses over time, so the results presented on this aspect focus on acids, bases and neutrals.
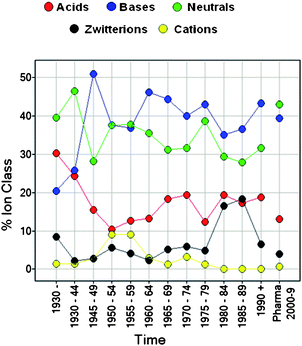 |
| | Fig. 1 Ion class composition of oral drugs over time and pharma patent compounds. | |
Table 1 Means, medians, 10 and 90 percentiles of oral drug physical properties by ion class
| |
Acid (n = 351) |
Base (n = 803) |
Neutral (n = 714) |
Zwitterion (n = 126) |
Cation (n = 63) |
| Propertya |
Ion class rankingb |
Mean |
Median |
10% |
90% |
Mean |
Median |
10% |
90% |
Mean |
Median |
10% |
90% |
Mean |
Median |
10% |
90% |
Mean |
Median |
10% |
90% |
|
HBA, HBD = hydrogen bond acceptor and donor counts; HA = heavy atom count; Ar = total aromatic count; Ar–H = aromatic hydrogen count.
> Indicates ion class differences are meaningful at p <0.05 (student's t test); A = acid, B = base, C= cation, N = neutral, Z = zwitterion.
|
| cLogP |
B>N = A>C = Z |
2.32 |
2.31 |
−0.57 |
5.14 |
3.11 |
3.29 |
0.54 |
5.47 |
2.45 |
2.23 |
−0.4 |
5.38 |
−0.62 |
−0.75 |
−3.46 |
2.55 |
−0.27 |
0.16 |
−3.94 |
2.64 |
| cLogD7.4 |
N>B>C = A>Z |
0.45 |
0.31 |
−1.13 |
2.23 |
1.75 |
1.88 |
−0.21 |
3.52 |
2.05 |
2.1 |
0.17 |
3.77 |
−0.13 |
−0.37 |
−1.47 |
1.4 |
0.81 |
0.84 |
−0.43 |
2.19 |
| Mol Wt |
Z>B = A = N = C |
330 |
305 |
206 |
479 |
341 |
319 |
212 |
477 |
331 |
313 |
176 |
494 |
379 |
367 |
169 |
532 |
328 |
321 |
206 |
456 |
| O + N |
Z>A>N>B>C |
5.97 |
5 |
3 |
9 |
4.61 |
4 |
2 |
8 |
5.40 |
5 |
2 |
9 |
7.13 |
7 |
4 |
10.3 |
3.34 |
3 |
2 |
5 |
|
OH + NH |
Z>A>N = B>C |
2.36 |
2 |
1 |
4 |
1.52 |
1 |
0 |
4 |
1.65 |
1 |
0 |
4 |
3.49 |
3 |
1 |
5.3 |
0.62 |
1 |
0 |
2 |
| HBA |
Z>A>N>B>C |
6.06 |
6 |
3 |
9 |
4.37 |
4 |
1 |
8 |
5.35 |
6 |
2 |
9 |
6.93 |
6 |
3 |
14 |
2.00 |
2 |
0 |
9 |
|
HBD
|
Z>A>N = B>C |
2.47 |
2 |
1 |
4 |
1.53 |
1 |
0 |
4 |
1.69 |
1 |
0 |
4 |
3.52 |
2 |
1 |
5 |
0.62 |
1 |
0 |
2 |
| PSA |
Z>A>N>B>C |
99.5 |
90.3 |
51.1 |
148.2 |
55.6 |
43 |
10 |
114.5 |
78.6 |
68 |
33.4 |
131.9 |
116.2 |
101.4 |
61.5 |
188.5 |
32.4 |
35.8 |
0.0 |
58.4 |
| %PSA |
Z = A>N>B>C |
28.5 |
26.5 |
16.1 |
43.2 |
13.7 |
11.8 |
2.5 |
26.8 |
22.9 |
20.8 |
9.3 |
38.7 |
29.8 |
26.2 |
16.4 |
48.7 |
8.0 |
9.1 |
0 |
13.9 |
| RotBonds |
Z = B = C>A = N |
4.98 |
4 |
2 |
9 |
6.65 |
6 |
2 |
11 |
4.73 |
3 |
1 |
10 |
6.74 |
5 |
3 |
11.3 |
6.21 |
6 |
3 |
9.8 |
| Rings |
B = C; C = N = Z>A |
2.23 |
2 |
1 |
4 |
2.84 |
3 |
1 |
4 |
2.60 |
2 |
1 |
4 |
2.56 |
3 |
0 |
4 |
2.70 |
3 |
1 |
4 |
| Chiral C atoms |
Z = N>B = C; C = A |
1.07 |
0 |
0 |
3 |
1.52 |
1 |
0 |
3 |
2.06 |
0 |
0 |
3 |
2.32 |
1 |
0 |
2 |
1.18 |
1 |
0 |
4.60 |
| sp3 C atoms |
C = Z = B>N>A |
5.08 |
4.00 |
0.3 |
11 |
8.81 |
8 |
4 |
14 |
7.76 |
5 |
1 |
17 |
8.32 |
7 |
3 |
14 |
9.70 |
9 |
5 |
15 |
| Ar atoms |
B = A = C>N = Z |
9.13 |
10.00 |
0 |
16 |
9.54 |
12 |
5 |
15 |
7.55 |
6 |
0 |
16 |
6.84 |
6 |
0 |
12 |
9.13 |
12 |
0 |
14.4 |
| Ar–H atoms |
C = B>A>N = Z |
4.74 |
5.00 |
0 |
9 |
5.71 |
5 |
0.4 |
10 |
3.78 |
3 |
0 |
8 |
3.18 |
3 |
0 |
8 |
6.61 |
8 |
0 |
10 |
| sp3/C |
C = Z; Z = B>C>D |
0.321 |
0.270 |
0.013 |
0.714 |
0.460 |
0.429 |
0.273 |
0.684 |
0.431 |
0.387 |
0.083 |
0.811 |
0.500 |
0.442 |
0.271 |
0.835 |
0.518 |
0.435 |
0.296 |
0.871 |
| Ar/HA |
A = B = C; C = N>Z |
0.409 |
0.462 |
0 |
0.667 |
0.40 |
0.429 |
0.176 |
0.600 |
0.354 |
0.375 |
0 |
0.694 |
0.251 |
0.250 |
0 |
0.500 |
0.375 |
0.454 |
0 |
0.571 |
| Ar-sp3 |
A>B = N = C; N = C = Z |
4.05 |
6 |
−7 |
13 |
0.732 |
2 |
−7 |
8 |
−0.219 |
2 |
−7 |
12 |
−1.48 |
0 |
−9 |
7 |
−0.574 |
2 |
−10.6 |
7 |
The Ar-sp3 parameter
The recent studies of aromatic ring content in GlaxoSmithKline compounds,31 and fraction of sp3 atoms in drugs and development compounds,32 provide a welcome addition of shape-based drug-like parameters to complement the well established bulk physical properties. However, it was shown that increasing aromatic ring count also increased lipophilicity; relationships of aromatic ring count with several developability properties followed the lipophilicity trends, with the exception of aqueous solubility, where at constant cLogP, increasing aromatic ring count reduced solubility.31 A similar correlation was found in our oral drug database between Ar–H (aromatic hydrogen atoms count) and cLogP (not shown). We examined the use of the ratio of aromatic atoms to total heavy atoms (Ar/HA)33 as a ‘flatness’ metric to consider using alongside the ‘3-dimensional’ metric sp3/C.32 However, Ar/HA and sp3/C are inversely related to each other (Fig. 2). The alternative parameter Ar-sp3 (total aromatic atoms minus sp3 carbon atoms) provides a simple sliding scale, independent of molecular size, and is correlated with both sp3/C and Ar/HA (Fig. 2). Increasing values of Ar-sp3 increase the contribution of ‘flatness’ and aromatic derived properties, and decreasing values increase the contribution of ‘3-dimensionality’ and aliphatic properties. Ar-sp3 will also be related to molecular rigidity and solubility31,32,33 as well as non-specific lipophilicity, and to the polarizability and quadropole moments of aromatic compounds that are responsible for their electrostatic interactions.
 |
| | Fig. 2 Relationships between Ar/HA (total aromatic count / heavy atoms), sp3 / C (total sp3 carbon count / total carbon count) and Ar-sp3 for oral drugs (top) and pharma patent compounds (bottom). | |
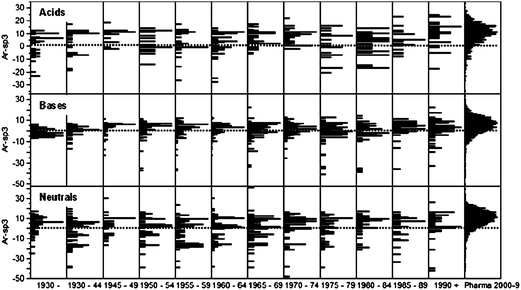
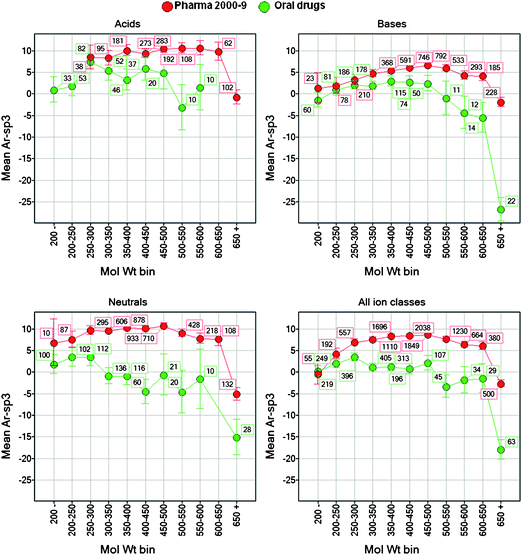
Because Ar-sp3 is not a ratio, a significant number of oral drugs compounds with zero aromatic atoms and zero sp3 atoms (18% and 4% respectively) are parameterized. The differing slopes of the correlations using Ar-sp3 (Fig. 2) suggest this property distinguishes in some way between oral drugs and Pharma patent compounds. Aromatic atom count itself is not a well distributed property (Fig. 3) because is it adjustable only by varying the numbers of aromatic rings. There is a large shift towards higher aromaticity in Pharma patent compounds compared with oral drugs; thus only 14% of oral drugs have more than two aromatic rings (more than 12 aromatic atoms) compared with 63% of patent compounds. In contrast, the sp3 atom distribution is similar in drugs (mean 7.8) and patent compounds (mean 8.2, see Fig. 3). The increased aromaticity in patented compounds versus oral drugs is a dominant factor contributing to increases in other bulk properties, especially cLogP and Mol Wt. Unlike aromatic count, Ar-sp3 is well distributed in drugs and patent compounds and differentiates these groups (Fig. 3), with 90 percentile values being 11 and 18 respectively, reflecting a balance of about one six-membered aromatic ring. The group of drugs with Ar-sp3 in the −14 to −20 range are mostly based on the steroid nucleus.
 |
| | Fig. 3 Distributions of aromatic atom count (Ar, top), sp3 atom count (middle) and Ar-sp3 atom count from oral drugs and pharma patent compounds. | |
Property trends over time (Figures 4–7)
While the overall trend in all drugs is known to show little change in lipophilicity over time,4,5,17 there are clearly different trends amongst ion classes (Fig. 4). Neutral and acidic drugs show increasing cLogP, whereas bases have a biphasic profile, with cLogP showing a downward trend since the 1950s. From the late 1960s the cLogP values of the three ion classes appear to converge in the 2.5–3 range, with acids showing a further increase in the post-1990 group. The overall trend is mirrored in the cLogD data (not shown) but with cLogD values of acids notably lower than bases or neutrals. In all ion classes, cLogP and cLogD values are increased significantly in current patent compounds. The trend in lipophilicity over time with bases is intriguing. The large increase in cLogP in the late 1940s to early 1960s is largely caused by a surge of tricyclic antidepressants, antipsychotics and antihistamines, all exploiting the discovery of biologically relevant ‘privileged’ aromatic – amine structures. Today, toxicity risk factors are recognized among highly basic, lipophilic compounds, including inhibition of the hERG ion channel,27,36membrane phospholipidosis,28 and receptor binding promiscuity.5,26 Toxicity and promiscuity risk increases when cLogP is >3,5,15 but this is ion class dependent, with acids having least risk and bases highest risk.5,26 The reduction in cLogP in bases since the 1950s may therefore reflect attrition due to increasing appreciation of safety issues. However, despite this knowledge, current patents appear to carry increased ‘base risk,’ being more lipophilic on average than any drug group. The increase in cLogP amongst neutrals and acids carries less risk of toxicity from receptor promiscuity than with bases and ‘ceilings’ for these ion classes may not have been reached yet; however further increasing lipophilicity in neutral compounds will result in higher risk of low solubility.
 |
| | Fig. 4 Rule of five property variance by ion class designation over time in oral drugs (pre 1930 to post 1990 publication dates) compared with pharma patent compounds (published 2000–9). From left to right, top graphs: Mol Wt and cLogP; lower graphs hydrogen bond donors (O + N count) and acceptors (OH + NH count). Error bars are ± 95% confidence limits of the mean values. | |
Mol Wt is increasing significantly over time in all drugs, and unlike lipophilicity, shows no ion class dependence (Fig. 4). Similar results were found for other measures of molecular size, such as volume, surface area, rotational bonds and ring count (not shown), all of which correlate positively with Mol Wt. Mol Wt is continuing to increase in current patented compounds. It is not clear that a ‘hard’ Mol Wt ceiling exists in general for all compound classes. However, bioavailability is reduced with increasing Mol Wt amongst drugs37 and at Mol Wt >500, permeability reduces significantly in diverse compound sets.13,14 In contrast to Mol Wt, the hydrogen bond acceptor values (O + N counts and OH + NH counts) of the ion classes are different, in the order acids>neutrals>bases. Hydrogen bond acceptors (O + N counts) are increasing over time in neutrals and bases, whereas acids show wider variability. Hydrogen bond donors (OH + NH counts), with the exception of post-1945 bases, are not changing over time (Fig. 4). These data reinforce previous conclusions4,17 that hydrogen bond donors are less susceptible to change over time than are hydrogen bond acceptors. The use of other more sophisticated H-bonding parameters, including donor/acceptor energies and surface areas, leads to the same conclusions (data not shown). Current patent compounds show reduced hydrogen bond donors in all classes, another factor that will contribute to increased lipophilicity.
The PSA data are similar to the hydrogen bond acceptor trends (Fig. 5), as expected given the correlation between these properties.3 PSA values of bases and neutral drugs have increased over time but acids have not. High PSA (>140 Å2) is known to limit absorption38 but PSA <75 Å2, when cLogP is also >3, carries toxicity risk.15 Bases and neutrals may not yet have reached the optimal PSA range, but, consistent with the increases in cLogP and Mol Wt, current practice is not increasing PSA in any ion class. In an earlier study,17%PSA was found to be the same (mean value 21%) in two groups of drugs, launched before and after 1983. In the same study, it was shown that the range of %PSA values (expressed by the 10–90% quantile difference) was lower in the post-1983 drugs. The results of the %PSA ion class changes over time are consistent with those findings, showing convergence to %PSA ∼20%, and provide a possible explanation for it, with acids and neutrals reducing, and bases increasing over time (Fig. 5). These observations are also influenced by property cross-correlations, since increasing cLogP will generally lead to lower %PSA. The %PSA and cLogP drug data together reinforce the importance of polar/non-polar balance in drugs and %PSA is an interesting alternative polar/non-polar descriptor property to cLogP.
 |
| | Fig. 5 Polar surface area (PSA) and %PSA variance over time in oral drugs (pre 1930 to post 1990 publication dates) compared with pharma patent compounds (published 2000–9). Error bars are ± 95% confidence limits of the mean values. | |
Over time, the fraction of drugs that are non-chiral is steadily falling, from ∼50% in the 1950s to 37% in the most recent drugs (Fig. 6), compared with 49% chiral compounds in current chemistry. The mean chiral atom count by ion class shows no consistent time dependence and significant variability. Current chemistry has lower mean chirality than drugs32 amongst bases and neutrals, but not acids. The high chiral content in late 1950s neutrals is due to the number of steroid drugs invented at that time. Total atom counts, including aromatic, sp3, carbon, and heavy atoms are all increasing over time, in concert with Mol Wt; sp3 and aromatic atoms trends are shown in Fig. 7. Because both numerator and denominator values are increasing, the sp3/C and Ar/HA fractions (latter not shown) show no meaningful changes over time. Although it is not a fraction, Ar-sp3 has positive values when Ar>sp3 and negative values when Ar<sp3 and the two elements appear to balance out with no substantial time dependence, showing a broadly inverse trend to sp3/C (Fig. 6), as expected from their co-correlation (Fig. 2). The Ar-sp3 values of neutrals and bases is higher in current patent compounds than in any of the drug groups over time, with bases having lower values than acids or neutrals. The increased aromaticity of post-1990 drugsversus earlier drugs probably causes increased lipophilicity (Fig. 4); however, this contrasts with less lipophilic acids from the late 1940s and 1960s–70s which have similar Ar-sp3 values. The variability of the distribution of Ar-sp3 by time is examined in more detail in Fig. 8. The comparison of bases and neutrals, with similar numbers of drugs (803 and 714 respectively) show notable differences, with neutrals having many high sp3 drugs – largely steroids, vitamins and macrocyclic antibiotics. The overall higher sp3 content in bases, and lower variability than neutrals, probably follows from most bases requiring between one and three substituent alkyl groups attached to a nitrogen atom. Taken together, the Ar-sp3, sp3/C and chiral data support the view32 that drugs are more 3-dimensional than current research compounds. However, the specific design choices taken, and fashionable trends (e.g.steroids in the 1950s, piperidine and COMPOUND LINKS
Read more about this on ChemSpider
Download mol file of compoundpiperazine bases in the 1960s) are underlying factors.
 |
| | Fig. 6 Chirality variance by ion class designation over time in oral drugs (pre 1930 to post 1990 publication dates) compared with pharma patent compounds (published 2000–9). Left graph shows percentage of compounds having from 0 to 4 or more chiral carbon atoms; right graph shows mean chiral carbon atoms. | |
 |
| | Fig. 7 Aromatic (Ar) and tetrahedral carbon atom (sp3) variance by ion class designation over time in oral drugs (pre 1930 to post 1990 publication dates) compared with pharma patent compounds (published 2000–9). From left to right, top graphs: Ar atoms and sp3 atom counts; bottom graphs, sp3/C fraction (sp3 carbon count / total carbon count) and Ar-sp3 count. Error bars are ± 95% confidence limits of the mean values. | |
 |
| | Fig. 8 Distributions of Ar-sp3 in oral drugs over time, compared with Pharma patent compounds, by ion class. Top graph, acids; middle graph, bases; lower graph, neutrals. See Fig. 7 for the mean value comparisons. The dotted lines represent Ar-sp3 = 0. Acids: Percentile values: all oral drugs (Pharma patent compounds): 10%, −7 (−3); median 6 (10); 90% 13 (19). Pharma patents compounds not different (p >0.05, student's t) from oral drugs 1945–49, 1970–74 and post-1990 and different to all other oral drug groups (p <0.05, student's t). Bases: Percentile values: all oral drugs (Pharma patent compounds): 10%, −7 (−6); median 2 (6); 90% 8 (15). Pharma patents compounds different (p <0.05, student's t) from all oral drug groups. Neutrals: Percentile values: all oral drugs (Pharma patent compounds): 10%, −17 (−3); median 2 (10); 90% 12 (20). Pharma patents compounds different (p <0.05, student's t) from all oral drug groups. Dotted lines are where Ar-sp3 = 0 (i.e. Ar=sp3). | |
Amongst the Pharma patented compounds, Mol Wt, cLogP and Ar-sp3, while showing some fluctuation over the period 2000–9, show no clear trends with year of publication (not shown). The inflation in these properties versus oral drugs may therefore be slowing down or levelling out.
Ion class and lipophilic-size-shape property space
Cross-correlations of molecular properties are common amongst and between the bulk physical properties,3 for example cLogP is a composite of other drug like properties in common use - size, polarity and hydrogen bonding.39,40 Correlations between three related physical properties such as Mol Wt, cLogP and PSA, result in a plane, whose axes were described in 1980 by Cramer41 as ‘bulk’ and ‘bulk-corrected cohesiveness’ (BC principal components). The use of separate bulk properties, however flawed, has held sway because medicinal chemists can compute them more easily than BC values, and they have proven relevance to compound ADMET risks. A principal components analysis of 30,000 GSK compounds concluded that most of the variance in drug like properties can be accounted for by LogP, Mol Wt and ion class.12 Hence closely related size, lipophilicity and hydrogen bonding physicochemical parameters provide different contributing information on the underlying molecular properties41 of ‘bulk’ and ‘cohesiveness.’ Thus it is relevant to examine links between the ‘shape’ parameter (Ar-sp3) and related bulk properties. The relationships between binned Mol Wt (Fig. 9) or cLogP (Fig. 10) and Ar-sp3 show different trends between oral drugs and Pharma patent compounds. In these comparisons, neutral compounds show the largest drug-Pharma differences, partly as a consequence of historical steroid-derived and other structures with high sp3 content. Oral drug Ar-sp3 values are lower than Pharma compounds, the differences in most cases increasing with increasing cLogP and Mol Wt. The binned cLogP data for acids (Fig. 10) shows the least difference between drugs and Pharma compounds. The data in Fig. 10 show that Ar-sp3 does not increase in oral drugs as binned cLogP is increased, in contrast to Pharma compounds, where increasing cLogP steadily increases aromaticity. The Ar-sp3 vs. Mol Wt correlations (Fig. 9) are not linear for Pharma compounds while drugs show increased sp3 content (i.e. reduced Ar-sp3) when Mol Wt is high (>500). Drugs with very high Mol Wt and cLogP (>650 and 6 respectively) are also significantly sp3 rich compounds; thus one way of accommodating extreme physical properties may be to decrease Ar-sp3 to <0.
 |
| | Fig. 9 Relationships between Ar-sp3 (total aromatic atom count – sp3 carbon count) and binned molecular weight, for oral drugs and pharma patent compounds, divided by ion class. From left to right: top graphs, acids and bases; bottom graphs, neutrals and all ion classes combined. Error bars are ± 95% confidence limits of the mean values. The numbers of compounds at each data point is shown. Points with <10 drugs are omitted. | |
 |
| | Fig. 10 Relationships between Ar-sp3 (total aromatic atom count – sp3 carbon count) and binned cLogP, for oral drugs and pharma patent compounds, divided by ion class. From left to right: top graphs, acids and bases; bottom graphs, neutrals and all ion classes combined. Error bars are ± 95% confidence limits of the mean values. The numbers of compounds at each data point is shown. | |
The relationships between cLogP, Mol Wt and Ar-sp3, by ion class, time of drug invention, and by originating Pharma Company serve to summarise oral drug and current Pharma property space (Fig. 11). The points on the graphs in Fig. 11 represent the centroids of the relevant group of drugs or company compounds. The data reveal further potential property redundancy as well as additional complexity. The 3-dimensional plot does not form a plane41 – this is because Ar-sp3 is not well correlated with either cLogP and Mol Wt (r2 values for all compounds: cLogP versus Ar-sp3, drugs 0.00031 and Pharma compounds 0.017; Mol Wtversus Ar-sp3, drugs 0.076 and Pharma compounds 0.025). The Ar-sp3 versus cLogP relationship (Fig. 11) suggests a need for more Pharma compounds with lower Ar-sp3 counts. The drug data indicate that, providing Ar-sp3 is <0, compounds may be more lipophilic, in contrast to the highly aromatic lipophilic compounds currently being pursued. There is distinct clustering in chemical space by ion class, which is especially evident amongst Pharma compounds. There is an apparent correlation between cLogP and Ar-sp3 for basic molecules, where current chemistry extends from historical drug space. In contrast, with the exception of post-1990 acidic drugs, acidic and neutral current chemistries occupy largely non-overlapping spaces relative to the drug groups. Combining ‘drug-like’ lipophilicity, size and shape in current patented compounds appears to be a major design issue, especially in neutral compounds where their rich history in steroids and other drugs derived from natural products contributes to a wider difference in Ar-sp3 with Pharma compounds than other ion classes. There is no real reason per se for the discrepancy, which can be addressed by appropriate design of more 3-dimensional molecules for a given cLogP (i.e. having lower Ar-sp3, or higher sp3/C values). In addition, the more recently invented oral drugs (the groups 1985–9 and post-1990) lie closer in property space to current chemistry than older compounds (all ion classes in post-1990 drugs showing comparable Mol Wt to Pharma compounds), but only post-1990 acids are similar in all properties to Pharma compounds. This definition of drug chemical space acts as a probability density, indicating potential for success or failure but not guaranteeing either. It is probably best used as a risk management tool to help balance the potential return of a project against the drug-like profile of its lead compounds.
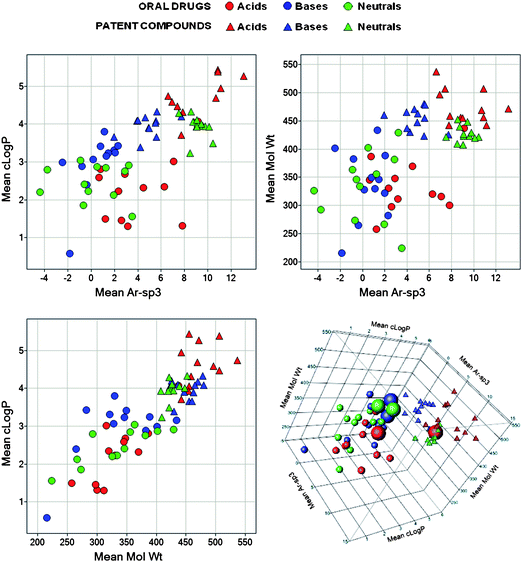 |
| | Fig. 11 Comparisons of oral drug and pharma patent compound groups showing mean cLogP vs. mean molecular weight vs. mean Ar-sp3 (total aromatic atom count – sp3 carbon count). The points are the centroids of property space for groups of oral drugs according to ion class and 12 time frames (data used in Fig. 4–6); and ion class and the 12 contributing Companies for pharma patent compounds. The 6 points represented by large circles in the 3-D plot (bottom right) are the most recently discovered oral drugs, published 1985–9 and post-1990; the rightmost drug group is the post-1990 acids. | |
Target class physical properties
One of the possible reasons for inflated physical properties in current Pharma compounds is that newer targets, with complex endogenous agonists (e.g. peptidic G-protein coupled receptors and proteases) require correspondingly more complex ligands. Mean cLogP, Mol Wt and Ar-sp3 values are compared by target class between oral drugs launched since 1983 and Pharma patent compounds in Table 2. The cLogP and Mol Wt differences between ion classes in drugs are consistent with literature observations,42 showing drugs acting at lipidergic and peptidergic GPCRs, kinases and nuclear hormone receptors (NHR) have the highest mean cLogP values (all >4). Lipidergic and peptidergic GPCRs, kinases and proteases have the highest mean Mol Wt values (>400). Despite these differences, the variance in each target class property in the current Pharma compounds is no greater than the differences between the target classes.43 The comparisons of oral drugs with Pharma compounds show that all target classes, with the exceptions of peptidic GPCRs and kinases show significantly increased cLogP and Ar-sp3 values. There are no Mol Wt differences between oral drugs and Pharma compounds in peptidic GPCRs, kinases, ion channels and proteases, with all others significant showing increases in Pharma compounds. The constant and low Mol Wt of ion channel drugs and Pharma compounds versus some other target classes is noteworthy. The largest increases in Ar-sp3 values are in lipidergic GPCRs and NHR, indicating the current near-exclusive use of aromatic replacements for sp3-rich endogenous ligands (e.g.prostanoids and steroids); arguably this practice, highly divergent from historical success, could lead to predictable failure in these target classes. The ‘most aromatic’ class is kinases, which employ aromatic H-bond donor/acceptor motifs mimicking the purine ring of the endogenous substrate, COMPOUND LINKS
Read more about this on ChemSpider
Download mol file of compoundadenosine triphosphate. As a result, this class may suffer from serious developability issues.31,44 Because of the small numbers of compounds, the results of ion class analyses over time are tentative and are restricted to GPCR amines and ion channels (Table 3). The GPCR amine trends show increased properties in Pharma compounds but there is more variability over time with ion channel drugs (for details see Table 3).
Table 2 Key physical properties of oral drugs launched since 1983 (n = 647) and Pharma patent compounds 2000–9 (n = 10,271), by target class. p Values are from the results of student's t-test comparisons of oral drugs and pharma compounds. Results from student t tests in order of descending property (groups in squared brackets are not different; > = p <0.05): Oral drugs: cLogP [kinase = GPCR peptide = NHR = GPCR lipid = transporter], [kinase = GPCR lipid = transporter = ion channel], [GPCR lipid = transporter = ion channel = protease], [transporter = ion channel = GPCR amine = protease], [protease = unknown] >other; Mol Wt [protease = kinase = GPCR peptide = GPCR lipid], [kinase = GPCR lipid = other = NHR], [GPCR lipid = other = NHR = ion channel = GPCR amine], [GPCR lipid = NHR = ion channel = GPCR amine = unknown], [GPCR amine = unknown = transporter]. Ar-sp3, [kinase = GPCR peptide] > [ion channel = transporter = GPCR amine = GPCR lipid], [transporter = GPCR lipid = other = unknown = protease], [GPCR lipid = other = unknown = protease = NHR]. Pharma compounds: cLogP [GPCR lipid = NHR] > [GPCR peptide = transporter] > [protease = other = kinase = ion channel = GPCR amine], [GPCR amine = unknown], Mol Wt [protease = GPCR peptide] > [unknown = GPCR lipid], [GPCR lipid = transporter], [transporter = NHR], [NHR = other], [other= kinase] > GPCR amine > ion channel; Ar-sp3kinase > GPCR lipid > [other = ion channel = NHR] > [GPCR peptide = transporter]; [transporter = protease]; [protease = GPCR amine] > unknown
| |
Number of Compounds |
Ar-sp3 |
cLogP |
Mol Wt |
| Target Class |
Oral Drug |
Pharma |
Mean Oral Drug (±95%) |
Mean Pharma (±95%) |
Pharma – Drug (p) |
Mean Oral Drug (±95%) |
Mean Pharma (±95%) |
Pharma – Drug (p) |
Mean Oral Drug (±95%) |
Mean Pharma (±95%) |
Pharma – Drug (p) |
|
GPCR - amine |
127 |
901 |
1.7 (±1.8) |
4.1 (±0.6) |
2.4 (0.0002) |
2.78 (±0.41) |
3.43 (±0.12) |
0.65 (<0.0001) |
353 (±24) |
403 (±7.2) |
50 (<0.0001) |
|
GPCR - lipid |
13 |
443 |
−1.2 (±5.5) |
9.3 (±0.8) |
10.5 (<0.0001) |
4.18 (±1.3) |
5.23 (±0.17) |
1.04 (0.0397) |
401 (±74) |
456 (±10) |
55 (0.0151) |
|
GPCR - other |
3 |
311 |
— |
9.8 (±1.0) |
— |
— |
3.57 (±0.21) |
— |
— |
403 (±12) |
— |
|
GPCR - peptide |
22 |
1360 |
9.7 (±4.2) |
5.9 (±0.5) |
−3.8 (0.0305) |
4.43 (±0.99) |
4.51 (±0.10) |
0.08 (>0.05) |
465 (±57) |
492 (±5.8) |
26 (>0.05) |
|
Ion channel
|
71 |
669 |
2.8 (±2.3) |
7.7 (±0.7) |
4.9 (<0.0001) |
3.06 (±0.55) |
3.61 (±0.14) |
0.56 (0.0109) |
366 (±32) |
379 (±8.3) |
13 (>0.05) |
|
Kinase
|
9 |
1790 |
14.2 (±6.6) |
12.5 (±0.4) |
−1.7 (>0.05) |
4.55 (±1.6) |
3.63 (±0.09) |
−0.92 (>0.05) |
470 (±89) |
427 (±5.1) |
−44 (>0.05) |
|
NHR
|
35 |
583 |
−4.4 (±3.3) |
7.6 (±0.7) |
11.9 (<0.0001) |
4.40 (±0.79) |
5.20 (±0.15) |
0.80 (0.0084) |
376 (±45) |
440 (±8.9) |
64 (<0.0001) |
|
Protease
|
36 |
1253 |
−2.8 (±3.3) |
4.5 (±0.5) |
7.3 (<0.0001) |
2.71 (±0.78) |
3.75 (±0.10) |
1.04 (0.0019) |
481 (±44) |
495 (±6.1) |
14 (>0.05) |
|
Transporter
|
25 |
396 |
2.2 (±3.9) |
5.2 (±0.9) |
3.0 (0.0192) |
3.52 (±0.93) |
4.43 (±0.18) |
0.90 (0.0191) |
298 (±53) |
451 (±11) |
154 (<0.0001) |
| Other |
222 |
1549 |
0.6 (±1.3) |
8.2 (±0.4) |
7.6 (<0.0001) |
1.66 (±0.31) |
3.61 (±0.09) |
1.95 (<0.0001) |
380 (±18) |
439 (±5.5) |
59 (<0.0001) |
| Unknown |
87 |
1016 |
−1.8 (±2.1) |
3.0 (±0.5) |
4.7 (0.0010) |
2.04 (±0.50) |
3.41 (±0.12) |
1.37 (<0.0001) |
344 (±29) |
467 (±6.7) |
123 (<0.0001) |
Table 3 Key physical properties of oral drug GPCR amine and ion channel target classes launched since 1983 and Pharma patent compounds 2000–9 by target class. GPCRamine data (students t test): cLogP Pharma 2000–9 different from 1970–74 and 1980–84 oral drugs (p <0.05), oral drug groups not different; Mol Wt Pharma 2000–9 different from all drug groups except 1990+ (p <0.05); all oral drug groups not different; Ar-sp3 Pharma 2000–9 different from 1970–74 and 1980–84 oral drugs (p <0.05), 1985–89 different from other drug groups (p <0.05). Ion channel data (students t test): cLogP Pharma 2000–9 different from 1975–79 and 1990+ oral drugs (p <0.05), oral drug 1985–89 and 1990+ groups different from other oral drugs; Mol Wt Pharma 2000–9 different from 1985–89 oral drugs (p <0.05), oral drug groups not different; Ar-sp3 Pharma 2000–9 different from 1980–84,1985–89 and 1990+ oral drugs (p <0.05), 1970–74 different from other drug groups (p <0.05)
| Target class |
Time |
n |
Mean Ar-sp3 (±95%) |
Mean cLogP (±95%) |
Mean Mol Wt (±95%) |
|
GCPR amine
|
1970–74 |
23 |
0.7 (±2.8) |
2.71 (±0.67) |
329 (±37) |
| 1975–79 |
29 |
1.7 (±2.5) |
2.94 (±0.60) |
357 (±33) |
| 1980–84 |
23 |
−0.3 (±2.8) |
2.34 (±0.67) |
357 (±37) |
| 1985–89 |
23 |
4.0 (±2.8) |
2.89 (±0.67) |
357 (±37) |
| 1990 + |
23 |
2.7 (±2.8) |
3.21 (±0.67) |
373 (±37) |
| Pharma 2000–9 |
901 |
4.1 (±0.6) |
3.43 (±0.12) |
403 (±7.2) |
|
Ion channel
|
1970–74 |
14 |
7.5 (±4.1) |
2.9 (±0.91) |
346 (±51) |
| 1975–79 |
14 |
−0.6 (±4.1) |
2.64 (±0.91) |
385 (±51) |
| 1980–84 |
13 |
2.8 (±4.2) |
3.48 (±0.94) |
390 (±52) |
| 1985–89 |
14 |
2.6 (±4.1) |
4.18 (±0.91) |
433 (±51) |
| 1990 + |
9 |
−0.4 (±5.1) |
1.94 (±1.13) |
322 (±63) |
| Pharma 2000–9 |
669 |
7.7 (±0.7) |
3.61 (±0.14) |
379 (±8.3) |
Compliance with recent drug-like guidelines
An analysis of toxicity outcomes amongst a group of 245 Pfizer compounds, taking into account compound exposures, led to a proposal that toxicity is 6-fold less likely when both cLogP is <3 and PSA is >75 Å2 (3/75) compared with cLogP >3 and PSA <75 Å2.15 A study of a wide range of AMDET properties in GlaxoSmithKline compound concluded that overall risks were reduced when cLogP is <4 and Mol Wt is <400 (4/400).12 In general, the drug groups show better compliance with the guidelines than the Pharma patent compounds, especially with 4/400 (Table 4). The steady increase in violation of 4/400 over time (Fig. 12) follows from Mol Wt increases in drugs and in Pharma compounds with further increases in cLogP. The higher PSA values of acids mean that this ion class passes 3/75 more often than bases or neutrals; the 3/75 trend with time (Fig. 12) resembles the %PSA changes (Fig. 5). It is clear that since the early 1970s, most of the approved oral drugs fail 3/75 and the trend continues with Pharma compounds. Clearly, historical oral drugs will have passed toxicity testing and the low overall 3/75 pass rates are perhaps surprising at first sight. On the other hand, there were sufficient exceptions to 3/75 in the Pfizer set15 to suggest that it is possible to find safe drugs violating 3/75. In addition, compounds displaying toxicity can of course still have acceptable margins between efficacious and toxic exposures. Considerations of the overall risk to benefit profile are additionally dependent on the proposed therapeutic indication. Reducing attrition due to toxicity is a major current challenge for drug discovery and 3/75 alone, while a useful step forward, is unlikely to be sufficient to discriminate toxic from non-toxic compounds.45 The use of in vitro cytotoxicity IC50 values in conjunction with 3/75 is a further advance.46
Table 4 The compliance of oral drugs and Pharma patent compounds with empirical toxicity (cLogP <3, PSA >75)15 and ADMET (cLogP <4, Mol Wt <400)12 guidelines, by ion class
| Ion class |
Source |
% cLogP <3, PSA <75 |
% cLogP <3, PSA >75 |
% cLogP >3, PSA <75 |
% cLogP >3, PSA >75 |
% Mol Wt <400, cLogP <4 |
% Mol Wt <400, cLogP >4 |
% Mol Wt >400, cLogP <4 |
% Mol Wt >400, cLogP >4 |
| Acid |
Oral drugs |
15.4 |
48.2
|
17.1 |
19.4 |
65.0
|
10.8 |
14.5 |
9.7 |
| Pharma 2000–9 |
1.4 |
23.3
|
19.4 |
55.9 |
15.2
|
9.0 |
25.7 |
50.1 |
|
Base
|
Oral drugs |
26.4 |
17.8
|
49.9 |
5.9 |
53.1
|
24.2 |
12.3 |
10.5 |
| Pharma 2000–9 |
13.2 |
16.5
|
44.3 |
26.0 |
22.2
|
9.2 |
28.7 |
39.9 |
| Neutral |
Oral drugs |
30.7 |
33.9
|
25.8 |
9.7 |
70.5
|
8.8 |
10.4 |
10.4 |
| Pharma 2000–9 |
9.6 |
22.3
|
38.1 |
30.0 |
28.7
|
13.9 |
25.5 |
31.9 |
| All ion classes |
Oral drugs |
27.6 |
31.4
|
31.7 |
9.3 |
62.6
|
14.4 |
13.3 |
9.7 |
| Pharma 2000–9 |
10.2 |
21.2
|
37.0 |
31.6 |
24.3
|
10.8 |
27.9 |
36.9 |
 |
| | Fig. 12 The compliance of oral drugs and Pharma Patent compounds with empirical toxicity and ADMET guidelines, by ion class, over time. Left graph, toxicity risk reduction recommendations: cLogP <3 and PSA >75;15 right graph ADMET risk reduction recommendations: cLogP <4 and Mol Wt <400.12. | |
Conclusions
The property-time relationships of oral drugs show that identifying ‘drug-likeness’ traits would have provided a different view if done in 1965, the median drug publication year, versus today. Pre-1965, the range of cLogP, PSA and HBA values in each ion class is greater and Mol Wt is lower, than post-1965. Thus, drug-like properties are clearly subject to the practices of the day – and cannot be considered as ‘absolute’ unchanging parameters. Another view is that over time, the drug discovery community has learned more and the observed changes could be taken to reflect an improvement in quality, ‘homing in’ on the most preferred drug like space. The ‘time-stable’ oral drug property observations with cLogP and %PSA4,5,17 are seen to be a result of different trends in each ion class, which balance out in all drugs over time. However, if we start the clock in the late 1960s, there is still some support for a ‘time-stable’ oral drug property hypothesis. Since then, both cLogP and %PSA show convergence to similar values in each ion class, and, with the exception of the median cLogP of acidic drugs discovered after 1990, no significant changes. In addition, this study confirms that HBD is barely changing over time whereas in comparison, HBA has increased more. Furthermore, the shape-derived parameters, sp3/C, Ar/HA, chiral C atoms and Ar-sp3, while differing by ion class, show no obvious time dependence. Thus, drugs invented over the past 40 years suggest that lipophilicity, polar/non-polar balance, HBD, and shape are indicative success factors. Since the 1980s, protein cloning, high throughput screening and combinatorial chemistry have become mainstay technologies. The application (or perhaps mis-application?) of these tools, together with corporate strategy, and a higher proportion of more challenging targets, have together played a significant part in the physical property inflation seen in current chemistry versusdrugs.5,47
The ionic class considerations also suggest some unexplored opportunities. The lipophilicity trends over time with basic compounds reflect known ADMET risks; in this sense, ‘the past predicts the future.’ In contrast, the ceilings for lipophilicity in acids and neutrals may not have been reached. Pharma space carries higher overall empirical Mol Wt/LogP ADMET risk than oral drug space, and perseverance in this space requires the identification of ‘exception’ compounds with less ADMET susceptibility. One way that the historical record suggests to achieve this is to ensure that Ar-sp3 is negative in very lipophilic and large compounds. In addition, the data suggest that acidic molecules may have fewer overall ‘high property and aromaticity’ issues than do bases or neutrals.
Is aromaticity a redundant property, simply reflecting a component of compound lipophilicity, or are there additional issues to contend with as aromatic content increases? More work is needed on this question, but there is evidence that aromaticity has a negative impact on solubility which is independent of lipophilicity31 and that increasing ring count (including aromatic rings) increases receptor promiscuity.5 Based on an analysis of 100,000 GlaxoSmithKline compounds with kinetic solubility data, the use of COMPOUND LINKS
Read more about this on ChemSpider
Download mol file of compoundoctanol–water partition coefficients was questioned and a solubility forecast index, SFI = cLogD + #Ar rings, was proposed as a guide for prediction of solubility.48 Additional binding of aromatic rings, beyond hydrophobicity, which cannot be replicated in aliphatic templates, includes edge to face and pi-pi stacking, H-bonding of aromatic heteroatoms and pi-cation binding.49 All of these can lead to improved potency but also to the additional potential for unwanted receptor promiscuity. Further, aromatic rings will be prone to oxidative metabolism and overcoming this often requires blocking of active sites, enhancing physical properties even more (leading to compounds that are outliers from normal stability/permeability space).14 The pursuit of such strategies in current lead optimisation (with a major emphasis on kinase targets), is probably largely responsible for the increase in aromaticity and lipophilicity in current chemistry versus historical drugs. We agree with the sentiments32 that this is predominantly caused by the availability of facile metal-catalysed aromatic cross coupling reactions, and that changing this trend will require synthetic chemistry effort to become more focused on non-aromatic templates for drug design. Drug history has already made good use of natural product derived sp3-rich structures: steroids, sugars, vitamins and macrocycles. Successful drugs are more similar to endogenous metabolites than development compounds50 and there are many opportunities to expand chemical space in drug discovery using under-exploited natural product derived fragments,51,52,53 and by using a wider range of synthetic reactions in drug discovery projects.54 But in all compound classes, the historical and empirical record shows that keeping lipophilicity,5,55hydrogen bond donors and shape/aromaticity under control will be needed for orally active compounds. Prediction of these molecular properties in advance of synthesis is straightforward.56
Acknowledgements
We thank Ola Engkvist, Niklas Blomberg and Sorel Muresan for their constructive comments on the manuscript, and John Proudfoot for sharing his oral drug database.
References
- C. A. Lipinski, F. Lombardo, B. W. Dominy and P. J. Feeney, Adv. Drug Delivery Rev., 1997, 23, 3–25 CrossRef.
- M. C. Wenlock, R. P. Austin, P. Barton, A. M. Davis and P. D. Leeson, J. Med. Chem., 2003, 46, 1250–1256 CrossRef CAS.
- M. Vieth, M. G. Siegel, R. E. Higgs, I. A. Watson, D. H. Robertson, K. A. Savin, G. L. Durst and P. A. Hipskind, J. Med. Chem., 2004, 47, 224–232 CrossRef CAS.
- J. R. Proudfoot, Bioorg. Med. Chem. Lett., 2005, 15, 1087–1090 CrossRef CAS.
- P. D. Leeson and B. Springthorpe, Nat. Rev. Drug Discovery, 2007, 6, 881–890 CrossRef CAS.
- T. I. Oprea, J. Comput.-Aided Mol. Des., 2002, 16, 325–334 CrossRef CAS.
- J. F. Blake, Med. Chem., 2005, 1, 649–655 CrossRef CAS.
- C. Tyrchan, N. Blomberg, O. Engkvist, T. Kogej and S. Muresan, Bioorg. Med. Chem. Lett., 2009, 19, 6943–6947 CrossRef CAS.
- I. Ksola and J. Landis, Nat. Rev. Drug Discovery, 2004, 3, 711–716 CrossRef CAS.
- S. M. Paul, D. S. Mytelka, C. T. Dunwiddie, C. C. Persinger, B. H. Munos, S. R. Lindborg and A. L. Schacht, Nat. Rev. Drug Discovery, 2010, 9, 203–214 CAS.
- B. Munos, Nat. Rev. Drug Discovery, 2009, 8, 959–968 CrossRef CAS.
- M. P. Gleeson, J. Med. Chem., 2008, 51, 817–834 CrossRef CAS.
- M. J. Waring, Bioorg. Med. Chem. Lett., 2009, 19, 2844–2851 CrossRef CAS.
- T. W. Johnson, K. R. Dress and M. Edwards, Bioorg. Med. Chem. Lett., 2009, 19, 5560–5564 CrossRef CAS.
- J. D. Hughes, J. Blagg, D. A. Price, S. Bailey, G. A. DeCrescenzo, R. V. Devraj, E. Ellsworth, Y. M. Fobian, M. E. Gibbs, R. W. Gilles, N. Greene, E. Huang, T. Krieger-Burke, J. Loesel, T. Wager, L. Whiteley and Y. Zhang, Bioorg. Med. Chem. Lett., 2008, 18, 4872–4875 CrossRef CAS.
- H. Kubinyi, Nat. Rev. Drug Discovery, 2003, 2, 665–668 CrossRef CAS.
- P. D. Leeson and A. M. Davis, J. Med. Chem., 2004, 47, 6338–6348 CrossRef CAS.
- D. T. Manallack, SAR QSAR Environ. Res., 2009, 20, 611–655 Search PubMed.
-
R. E. Fessey, R. P. Austin, P. Barton, A. M. Davis, M. C. Wenlock, in Pharmacokinetic Profiling in Drug Research: Biological, Physicochemical, and Computational Strategies, [LogP2004, Lipophilicity Symposium], B. Testa (Ed.), Verlag Helvetica Chimica Acta, Zurich, Switz., 2006, p119–141 Search PubMed.
-
A. M. Davis, R. Riley, in Drug Design, Special Publication - Royal Society of Chemistry (D. R. Flower, ed), 2002, p106–123 Search PubMed.
- M. P. Gleeson, J. Med. Chem., 2007, 50, 101–112 CrossRef CAS.
- D. A. Smith, B. C. Jones and D. K. Walker, Med. Res. Rev., 1996, 16, 243–266 CrossRef CAS.
- G. Berellini, C. Springer, N. J. Waters and F. Lombardo, J. Med. Chem., 2009, 52, 4488–4495 CrossRef CAS.
- M. P. Gleeson, N. J. Waters, S. W. Paine and A. M. Davis, J. Med. Chem., 2006, 49, 1953–1963 CrossRef CAS.
- J. Valentin and T. Hammond, J. Pharmacol. Toxicol. Methods, 2008, 58, 77–87 CrossRef CAS.
- J. Peters, P. Schnider, P. Mattei and M. Kansy, ChemMedChem, 2009, 4, 680–686 CrossRef CAS.
- M. J. Waring and C. Johnstone, Bioorg. Med. Chem. Lett., 2007, 17, 1759–1764 CrossRef CAS.
- A. J. Ratcliffe, Curr. Med. Chem., 2009, 16, 2816–2823 CrossRef CAS.
- M. V. S. Varma, B. Feng, R. S. Obach, M. D. Troutman, J. Chupka, H. R. Miller and A. El-Kattan, J. Med. Chem., 2009, 52, 4844–4852 CrossRef CAS.
- D. A. Smith, M. J. Ackland and B. C. Jones, Drug Discovery Today, 1997, 2, 479–486 CrossRef CAS.
- T. J. Ritchie and S. J. F. MacDonald, Drug Discovery Today, 2009, 14, 1011–1020 CrossRef CAS.
- F. Lovering, J. Bikker and C. Humblet, J. Med. Chem., 2009, 52, 6752–6756 CrossRef CAS.
- C. Lamanna, M. Bellini, A. Padova, G. Westerberg and L. Maccari, J. Med. Chem., 2008, 51, 2891–2897 CrossRef CAS.
- http://thomsonreuters.com/products_services/science/science_products/a-z/integrity. ©Thomson Reuters, all rights reserved.
-
(a) P. Bruneau and N. R. McElroy, J. Chem. Inf. Model., 2006, 46, 1379–1387 CrossRef CAS;
(b) http://www.biobyte.com/bb/prod/clogp40.html.
- D. J. Diller, Curr. Comput.-Aided Drug Des., 2009, 5, 106–121 Search PubMed.
- M. V. S. Varma, R. S. Obach, C. Rotter, H. R. Miller, G. Chang, S. J. Steyn, A. El-Kattan and M. D. Troutman, J. Med. Chem., 2010, 53, 1098–1108 CrossRef CAS.
- D. F. Veber, S. R. Johnson, H. Cheng, B. R. Smith, K. W. Ward and K. D. Kopple, J. Med. Chem., 2002, 45, 2615–2623 CrossRef CAS.
- M. H. Abraham, H. S. Chadha, G. S. Whiting and R. C. Mitchell, J. Pharm. Sci., 1994, 83, 1085–100 CAS.
- P. V. Oliferenko, A. A. Oliferenko, G. Poda, V. A. Palyulin, N. S. Zefirov and A. R. Katritzky, J. Chem. Inf. Model., 2009, 49, 634–646 CrossRef CAS.
- R. D. Cramer III, J. Am. Chem. Soc., 1980, 102, 1837 CrossRef.
- M. Vieth and J. J. Sutherland, J. Med. Chem., 2006, 49, 3451–3453 CrossRef CAS.
- M. J. Waring, Expert Opin. Drug Discovery, 2010, 5, 235–248 Search PubMed.
- A. L. Gill, M. Verdonk, R. G. Boyle and R. Taylor, Curr. Top. Med. Chem., 2007, 7, 1408–1422 CrossRef CAS.
- D. A. Price, J. Blagg, L. Jones, N. Greene and T. Wager, Expert Opin. Drug Metab. Toxicol., 2009, 5, 921–931 Search PubMed.
- N. Greene, M. D. Aleo, S. Louise-May, D. A. Price and Y. Will, Bioorg. Med. Chem. Lett., 2010, 20, 5308–5312 CrossRef CAS.
- G. M. Keseru and G. M. Makara, Nat. Rev. Drug Discovery, 2009, 8, 203–212 CrossRef.
- A. P. Hill and R. J. Young, Drug Discovery Today, 2010, 15, 648–655 CrossRef CAS.
- J. C. Ma and D. A. Dougherty, Chem. Rev., 1997, 97, 1303–1324 CrossRef CAS.
- D. Kong, W. Ren, W. Lu and H. Zhang, J. Chem. Inf. Model., 2009, 49, 2376–2381 CrossRef CAS.
- K. Kumar and H. Waldmann, Angew. Chem., Int. Ed., 2009, 48, 3224–3242 CrossRef CAS.
- J. Rosen, J. Gottfries, S. Muresan, A. Backlund and T. I. Oprea, J. Med. Chem., 2009, 52, 1953–1962 CrossRef CAS.
- R. F Hirschmann, K. C. Nicolaou, A. R. Angeles, J. S. Chen and A. B. Smith, Acc. Chem. Res., 2009, 42, 1511–1520 CrossRef CAS.
-
T. W. J. Cooper, I. B. Campbell, S. J. F. Macdonald, Angew. Chem. Int. Ed. Eng., online DOI:10.1002/anie.201002238.
- E. Perola, J. Med. Chem., 2010, 53, 2986–2997 CrossRef CAS.
- S. W. Muchmore, J. J. Edmunds, K. D. Stewart and P. J. Hajduk, J. Med. Chem., 2010, 53, 4830–4841 CrossRef CAS.
|
| This journal is © The Royal Society of Chemistry 2011 |
Click here to see how this site uses Cookies. View our privacy policy here.